Download as PDF, PPTX

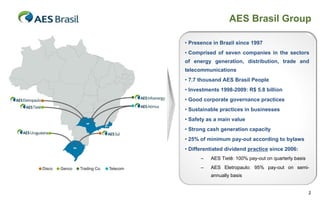
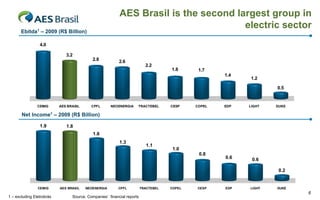
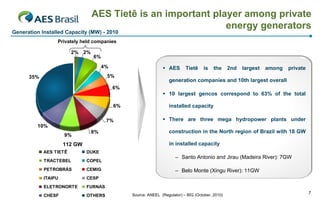
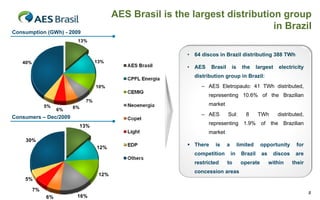

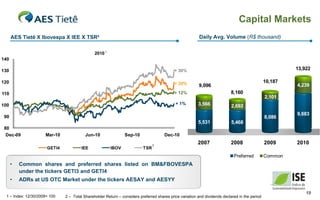
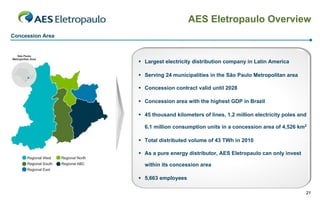


The document provides an overview of AES Brasil Group, which operates in the energy generation, distribution, trade and telecommunications sectors in Brazil. Some key points: - AES Brasil is the second largest group in the Brazilian electric sector based on 2009 EBITDA and net income. - It has a presence in Brazil since 1997 and is comprised of seven companies with over 7,700 employees. - AES Tietê is the group's main generation company and AES Eletropaulo is the largest distribution company in Latin America, serving the São Paulo metropolitan region. - Both AES Tietê and AES Eletropaulo have long-term concessions and contracts in place and have been


