Download to read offline
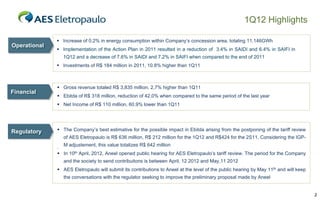
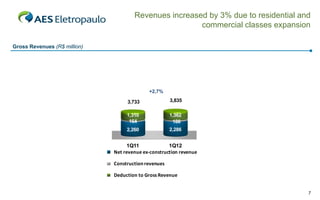
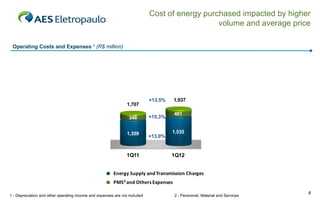
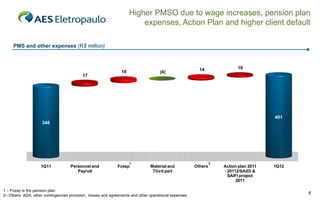
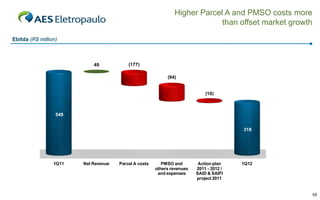
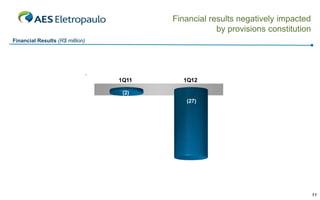
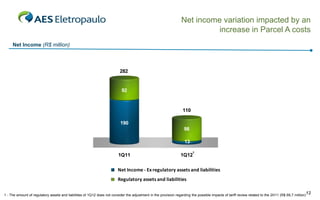

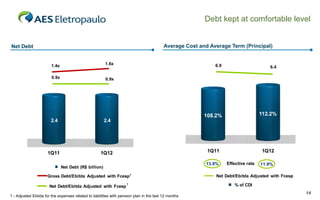

The company saw a 0.2% increase in energy consumption in 1Q12. Revenues increased 2.7% due to growth in residential and commercial classes, while EBITDA declined 42% due to higher energy purchase costs and expenses related to improving reliability metrics. Net income declined 60.9% due to increased regulatory costs. Operational cash generation declined 35% while debt levels remained comfortable.


![Eletropaulo 1 q10_eng_final [modo de compatibilidade]](https://cdn.slidesharecdn.com/ss_thumbnails/eletropaulo1q10engfinalmododecompatibilidade-100517082821-phpapp01-thumbnail.jpg?width=640&height=640&fit=bounds)


