Download to read offline


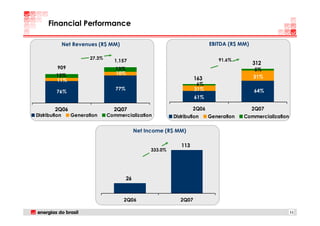


Energias do Brasil held a conference call to discuss its 2Q07 earnings results. The company reported strong growth in revenue and EBITDA of 27.3% and 91.6% respectively compared to 2Q06. Net income increased substantially to R$333 million from R$26 million in 2Q06. Manageable costs were impacted by some non-recurring provisions but productivity gains helped offset costs. The company also reduced debt levels and extended debt maturities. Overall, the results demonstrated continued improvement in the company's financial and operating performance in 2Q07.


