SlideShare a Scribd company logo
1 of 27
Download to read offline
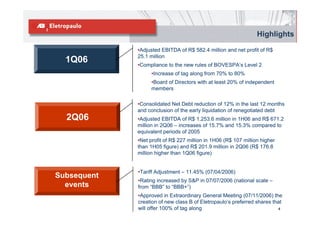
2nd quarter 2006 Results


      August 11, 2006
Highlights

Market                           Highlights

Tariff Adjusment and Operating   Operating Performance
Performance
                                 Bilateral Contract
Financial Performance
                                 Financial Performance
Debt Profile

Cash Flow
                        Conclusion
Highlights

             •Adjusted EBITDA of R$ 582.4 million and net profit of R$
             25.1 million
  1Q06       •Compliance to the new rules of BOVESPA’s Level 2
                   •Increase of tag along from 70% to 80%
                   •Board of Directors with at least 20% of independent
                   members

             •Consolidated Net Debt reduction of 12% in the last 12 months
             and conclusion of the early liquidation of renegotiated debt
  2Q06       •Adjusted EBITDA of R$ 1,253.6 million in 1H06 and R$ 671.2
             million in 2Q06 – increases of 15.7% and 15.3% compared to
             equivalent periods of 2005
             •Net profit of R$ 227 million in 1H06 (R$ 107 million higher
             than 1H05 figure) and R$ 201.9 million in 2Q06 (R$ 176.8
             million higher than 1Q06 figure)


             •Tariff Adjustment – 11.45% (07/04/2006)
Subsequent
             •Rating increased by S&P in 07/07/2006 (national scale –
  events     from “BBB” to “BBB+”)
             •Approved in Extraordinary General Meeting (07/11/2006) the
             creation of new class B of Eletropaulo’s preferred shares that
             will offer 100% of tag along                                4
Consumption Comparison in GWh
           Average Tariff R$/MWh                                                   NOTE: Charts do not consider own consumption


                  2Q05     2Q06      Variation %

RESIDENTIAL       307.3    306.1       - 0.4%

INDUSTRIAL        219.6    242.5      + 10.5%

COMMERCIAL        272.1    281.0       + 3.2%

OTHERS            210.4    230.5       + 9.5%
                                                                                                             4.7%

TOTAL             267.3    279.1       + 3.9%                                                                       9,578
                                                                                      -0.6%                9,150

 8.7%                                                                              7,968      7,924
         3,209
2,952
                  -12.5%
                                   2,434 2,433                     39.9%
                 1,902 1,663                                               1,654
                                                     -8.9%
                                                                   1,182

                                                    680   619


 Residential      Industrial       Commercial      Public Sector      Free         Billed Market           Total Market
                                                    and Others     Consumers


                                     2Q05                          2Q06                                                      5
Retention of Potentially Free Consumers

      Net Revenues with TUSD X Free                                                                 Captive Consumers X Free
         Consumers consumption                                                                             % Total Market – 2Q06
                                                       99      106
                                              95
                                       84
                               78                             1,654                                                           Potentially Free
                                                      1,500                                                                    Consumers
                         54            1,312 1,407                                             Captive
                    48                                                                                                              2%
              38               1,182                                                          Consumers
      30                 964                                                                     81%
 19                806
             750
      641
479
                                                                                                                              Free Consumers
                                                                                                                                    17%


1Q04 2Q04 3Q04 4Q04 1Q05 2Q05 3Q05 4Q05 1Q06 2Q06

            Free Consumers (GWh)             TUSD (R$ million)


                                                      Captive Market Evolution* (GWh)
                                                                 Increase of 5.3% (12 months)

                                                                                                                7,621
                                                                                  7,453 7,465
                                                          7,076 6,998 7,261 7,315
                                        6,718 6,983 7,016


                                                                                                                        * Excluding all current
                                                                                                                        free consumers from all
                                                                                                                        previous periods
                                          1Q04       2Q04     3Q04    4Q04   1Q05   2Q05   3Q05   4Q05   1Q06   2Q06

                                                                                                                                                  6
Tariff Evolution


                                                            18.6%
                      17.6%
            13.8%                  14.3%
11.1%                                        11.6%                                    11.5%
             7.6%      12.1%                                16.9%
7.5%
                                   11.8%
                                              7.3%
                                                                          2.1%
                                                                                       9.9%
                                                                              1.6%
             6.3%                                                             4.8%
3.7%                   4.5%                   3.6%
                                    2.5%                     1.7%                             1.6%

                                                                          -4.3%


1999        2000       2001        2002       2003          2004          2005         2006

        Part B                 Part A                PIS/COFINS                        IGPM


              2006 Tariff Adjustment by Consumption Class           Index
            Low voltage                                              -1.91%
            High voltage                                              8.26%
             A2 (88 to 138 kV)                                        4.57%
             A3a (34.5 kV)                                            6.20%
             A4 (2.3 to 25 kV)                                        9.08%
                                                                                                7
Operating Highlights

                  Loss Evolution (%)                                              Collection Rate -
                                                                                % over Gross Revenue

           13.5        12.9       13.4
                                               12.2

                                                                       97.5          99.0        97.7           99.0
            7.9         7.3        7.8
                                         -9%   6.6
                                                                                                        +1.4%


            5.6         5.6        5.6         5.6

                                                                      2004          2005         1H05           1H06
          2004        2005        1H05         1H06

          Technical Losses    Com m ercial Losses

Fraud combat:
      239 thousand inspections and 33 thousand frauds          Collection Rate (current bills)
     detected                                                         Public Sector: 102.6%
      Cost of R$ 29 million                                           Private Sector: 98.8%
      Retroactive Energy negotiated + Energy Added – 135        Increase of monthly average of cuts from 75 thousand to
     GWh (R$ 64 million)                                       111 thousand (1H05x1H06)
Regularization of Clandestine Connections:
      38 thousand regularizations – Revenue of R$ 26 million
                                                                                                                       8
      Investment – R$17 million
Capex 2Q06
                                                          R$ million


                404

                 49
       330

        33


217
 32
                355
       297
                        81        92
186
                                  16
                        11
                                  76
                        70

2003   2004     2005   1Q06      2Q06

        Capex    Self Financed


 R$ 173 million invested in the first semester of 2006
                                                               9
Results
                                                                                                                                                                               R$ million

                         Gross Revenue                                            Operating Expenses                                                                EBITDA

                                                                             -12.2%                                -4.4%                                   33.4%                              33.4%
             -5.7%
                                                  +1.2%                                                                                                                     29.4%
                                                                   1,777.7                              1,633.3                            28.3%
                                                                                      1,561.5                              1,561.5                 4,2%                             15,3%
      2911.2             2744.2         2711.4          2744.2                                                                           644.2             671.2                            671.2
       635.7                                                                                                                                                               582.4
                         737.1           730.7           737.1    1,243.4                                                                  72.6            147.9                            147.9
                                                                                      1,055.9           1,036.4            1,055.9                                         158.6

      2275.5             2007.1         1980.6                                                           188.9
                                                        2007.1      168.5             157.6                                 157.6                          523.3                            523.3
                                                                                                                                                                          423.8
                                                                    365.8             348.0             408.0               348.0
                                                                                                                                          571.6
      2Q05               2Q06            1Q06            2Q06       2Q05              2Q06               1Q06               2Q06           2Q05            2Q06            1Q06             2Q06
           Net Revenue     Deductio ns fro m Operating Revenue   Operating Expenses    Sector Charges    Electricity +Transport                   EBITDA   Adjust    Adjusted EBTIDA Margin


•   Increase over 1Q06: increase of 1.4% of billed                  •   Reduction over 1Q06: decrease of 50% in                      •   Adjusted EBITDA 2Q06:
    market and 2.8% of total market                                     “Other Operating Expenses”                                          – Liability Expenses - FCESP: R$
•   Reduction over 2Q05:                                                     •   Reversal of contingency with an                              60.6 million
       •    Conclusion of Tariff Review Process 2003                             impact of R$ 13.8 million in the result                    – RTE: R$ 82.2 million
            (additional revenue of R$ 106.9 million in              •   Reduction over 2Q05: decrease of 25.2% in                           – Provision - RTE: R$ 5.0 million
            2Q05)
                                                                        energy purchased costs
       •    Revenue’s reversal of R$ 35 million in
                                                                             •   Change in the energy purchase mix,
            2Q06 (devolution to tariff of the increase
                                                                                 with higher volume acquired in
            in Pis/Cofins taxes applied to Initial
            Contracts)                                                           auctions


                                                                                                                                                                                        10
Results
                                                                                                                            R$ million
                           Financial Result                                                           Net Profit


             2Q05          2Q06         1Q06          2Q06                                                                201.9
                                                                                              201.9
                                                                                  47.7%

                                                                                 136.8
                                                                                                                 705.0%

                 61.9%

             (77.9)                               3.7%                                                       25.1


                          (126.1)       (121.7)      (126.1)                     2Q05        2Q06           1Q06          2Q06


•   Negative variations stemmed from:
                                                                       •   Net Profit’s increase in the quarter:
      •   The financial revenues’ reduction in the period:
                                                                             •   Operating Expenses’ reduction
      – The reduction of Selic rate from 19.75% in 2Q05 to 16.50% in
                                                                             •   IR/CS expenses reduction (71% over 1Q06 and 84%
        1Q06 and 15.25% in 2Q06, that decreased regulatory assets’
                                                                                 compared to 2Q05)
        remuneration
      – The regulatory assets’ balance reduction on which the Selic
        remuneration is applied
      •   Lower Real appreciation against the dollar (0.4% in 2Q06,
          compared to 11.8% in 2Q05 and 7.2% in 1Q06) -
          collaborated to reversals of monetary variation expenses
          of R$ 229 million in 2Q05 and R$ 85 million in 1Q06
                                                                                                                                   11
Consolidated Debt
                                                                                                                      R$ million
                       Short Term X Long Term                                        Creditors X Indexes – 2Q06
                         -11.9%
                                                          -3.5%

         5,256
                 4,828      4,877           4,774 4,411 4,877                 Gross Debt – R$ 4, 877 million
                                    4,256                         4,256


          73%               77%             76%            77%
                                                                                        IGP-DI
                                                                                        45.05%
                                                                                                                      Fixed Rate
                                                                                                                        11.22%
          27%
                            23%             24%           23%

          2Q05              2Q06            1Q06           2Q06
                       LT            ST       Net Debt                                                                Libor
                                                                                        CDI/Selic
                                                                                                                      3.33%
                  Amortization Schedule - Current                                        40.26%
                                                                                                                  Others/R$
                                                                                                                    0.13%


                                                                          •   Pension Fund -         R$ 2,196 million
                                                                          •   Private Creditors -    R$ 2,127 million
                                                                          •   BNDES -                R$ 554 million

                                                                                                                          12
* Exchange Rate Conversion on 06/30/2006 - US$ 1.00 = R$ 2.1643
Consolidated Debt
                                                                                                                R$ million

                  Interest rates evolution                             Average Cost and Average Life
       CDI +
       6.84%                                                  112.0%
                 -17.4%
                      %                                                                 3.81                    3.9

                                -1.6%
                                                -1.4%
                                                    %
                     CDI +
                                    CDI +                                           100.8%                    100.4%
                     2.90%
                                    2.50%           CDI +
                                                    1.82%       2.05


      Bonds     8th Debenture   9th Debenture      CCB
                                                               2Q05                     1Q06                   2Q06
                                                                           Avg cost - %CDI                   Avg Life - years


        Indebtedness Highlights – last 12 months                                    Rating
                                                                                        S&P

•   Gross Debt: reduction of 7% (R$ 380 million)              National Scale                         BBB+
•   Net Debt: reduction of 12% (R$ 572 million)                                                        ‘06
                                                                                        BBB                  B+
•   Foreign Currency: reduced from 12% to 3% of total                                     ‘05
                                                                           BB
•   Hedge: 79% of foreign currency debt                                                         B+
                                                                             ‘04
                                                                DDD
•   Borrowing of R$ 300 million of CCB’s - amortization of                         B-
    remaining balance of renegotiated debt (R$ 235 million)     ‘03
                                                                       D                        International Scale
    and liquidation of its swaps
                                                                                                                      13
Cash Flow


Eletropaulo - Consolidated Cash Flow (Million)   1Q06       2Q06      1H06

Initial Cash                                        492       356       492

Operating cash generation                           687       653      1,340
Investments                                         (101)      (88)     (189)
Net Financial Expenses                              (196)      (85)     (281)
Net Amortization                                    (245)      (45)     (290)
Pension Fund Expenses                               (134)     (108)     (242)
Income Tax                                          (147)      (67)     (214)
Free Cash                                           (136)     261       125

Final Cash                                          356       617       617


                                                                                14
Conclusion

• Net profit of R$ 227.0 million in 1H06, representing an increase of R$ 107.0
  million compared to 1H05 net profit
• Adjusted EBITDA of R$ 1,253.5 million, 17.2% higher than 1H05’ figure
• Debt evolution in the last 12 months:
    • Reduction of 11.9% of consolidated net debt
    • Reduction of 10.3% of average cost
    • Increase of average life from 2 to 4 years
    • Foreign currency debt reduced from 12.2% to 3.3%
    • Conclusion of the pre-payment of March 2004 renegotiated debt
• Operating Highlights in the last 12 months:
    • Loss reduction of 9.0%
    • Collection rate increased 1.4%
• Corporate Governance Differentiated Standards:
    • Creation of new class B of preferred shares with 100% of tag along and
      convertibility ratio of 1:1 for current preferred shareholders

                                                                                15
16
Highlights 1H06

                    •   Starting in Jan/06, 100% of assured energy is sold through
                        the bilateral contract with Eletropaulo

     1Q06           •   EBITDA = R$ 274 million
                    •   Net Income = R$ 153 million


                    •   Best Public Utility in 2005 according to Exame Magazine’s
                        Melhores e Maiores Ranking
                    •   Best Public Held Company in 2005 according to the Platinum
     2Q06               List of the Forbes Brasil
                    •   EBITDA: R$ 269 million in the 2Q06 and R$ 543 million in the
                        1H06
                    •   Net Income: R$ 153 million in the 2Q06 and R$ 306 million in
                        the 1H06


                    •   Readjustment of the price of the bilateral contract with
                        Eletropaulo in 0.9%
Subsequent Events
                    •   Reversal of the allowance recorded related to penalties
                        determined by CCEE in November and December/05 (R$ 3.9
                        million)                                        17
Energy Balance– 1H06

                                                       Energy Generated x Billed Energy in GWh
            Caconde                 2.9%
             197.2
            Euclides                4.0%
             267.8
            Limoeiro                1.1%
              77.4
        Água Vermelha              57.7%
                                                                                                        82.3%      Eletropaulo - Bilateral
           3,891.2
                                                                                                                          5,557.0
         Barra Bonita               4.4%
                                                        TOTAL                   BILLED
            299.5
              Bariri                4.5%                6,748.9                  6,748.9
              301.0
                                                                                                        17.7%            MRE/CCEE*
            Ibitinga                5.4%                                                                                  1,191.9
             366.1
          Promissão                 8.5%
            573.0
     Nova Avanhandava              11.2%
           757.6
          Mogi Guaçu                0.3%
             18.2

*After deducing own consumption and transmission losses, the difference is addressed to the Energy Reallocation Mechanism – MRE
and to the Chamber of Energy Marketing – CCEE.                                                                                         18
.
Generation and Reliability

  AES Tietê’s assured energy is 1,275 MW average                                   Plant                          Period Without
                                                                                                                 Accidents –Years
  1H06: generation was 22% over the assured energy.                               Ibitinga                                 18.0
  During the last 20 years, AES Tietê has generated an                            Mogi-Guaçu                               11.4
  average of 18% above the assured energy                                         Nova Avanhandava                         8.5
  Failure Index (FI) and Equivalent Availability Factor                           Água Vermelha                            7.9
  (EAF) figures exceed the requirements established by                            Limoeiro                                 5.9
                                                                                  Barra Bonita                             5.8
  the National Eclectic Energy Agency - ANEEL: 2.9% for
                                                                                  Promissão                                4.3
  (FI) and 92.8% for EAF.
                                                                                  Caconde                                  3.2
  Average of 6.8 years of operations without accidents                            Euclides da Cunha                        2.9
  requiring the removal of personnel from the worksite                            Bariri                                   0.5
                             Generation                                                     Failure Index x Availability
123% 120% 123%        117%                                        122%
                                                           115%
                                             109% 107%
                                     98%                                 97.2%    96.8%                 96.1%
                                                                                            94.2%
                              81%                                                                                  90.9%    92.6%
                                                                                                                                              95.7%

                                                                                                 3.0%
1,617 1,619 1,581                                            1,554        2.8%
                  1,502                    1,392 1,363 1,467                                                       2.5%
                                     1,258                                         2.2%                  2.3%                            2.2%
                             1,040
                                                                                                                              1.6%


1997    1998   1999   2000   2001     2002   2003   2004   2005   1S06
                                                                          2000     2001          2002    2003       2004      2005       1S06*

       Generation - MW Average         Generation / Assured Energy               Failure Index                  Equivalent Availability Factor
                                                                                                                                         19
                                                                         *Annualized
Bilateral Contract

•   Initial Contracts ended December 31, 2005

•   Starting in January 2006, 1.268 MW (100% assured energy) is sold through the
    bilateral contract with Eletropaulo
       Price readjusted by the IGP-M variation in July
       Current Price = R$ 133.87 / MWh, readjusted in 0.86% in July 2006
       Maturity: December 2015
       Collateral: receivables
                                  Average Revenue – R$/ MWh
                                                                           133.9
                                                                119.6


                                                         94.4

                                                 73.6

                                         54.0
                                 48.8
                         45.9


                         2000    2001    2002    2003    2004   2005    Bilateral
                                                                        Contract
                                                                                                20
Operational Provision

PIS and Cofins
•   In June 2006, Aneel published Technical Note, reaffirming its understanding of the PIS
    / Cofins taxation rules and determined that the amounts paid in excess due to the
    application of non-cumulative taxation rules to the initial contracts should be returned.
•   AES Tietê took the following measures:
        Made a formal inquiry to the Secretariat of the Federal Tax Office to confirm the taxation
        rules applicable to the Company;
        Initiated administrative proceedings at Aneel, requesting that the reimbursements to the
        distribution companies be suspended until the Company has obtained a reply to its
        inquiry from the Secretariat of the Federal Tax Office;
        Requested court injunctions to suspend the effect of Aneel’s resolutions concerning the
        reimbursement until the Secretariat of the Federal Tax Office has produced a reply to the
        inquiry made by AES Tietê
        Registered an allowance of the amount to be reimbursed to the distribution companies
        as corresponding tax credit is still a matter of controversy (R$ 15,3 million)
RTE
•   Provision referring to the monetary correction of the balance of the credits to receive
    from energy distributors regarding the RTE (R$ 9.7 million, in the 1H06)

                                                                                           21
Results
                                                                                                              R$ million

                    Net Revenue                                 Costs and Operational Expenses
                                                                               190
                                                                      34%
              30%   698                                       142              54

        538                                                                    25
                                                               40                                             96
                                                                 16            25
                                                                                                   59%    22
                                      30%   349               24                         61
                                                                               37                              20
                                268                            26                            19           12
                                                                                        11                     17
                                                                                           14
                                                               36              49        17                   24

                                                              1H05          1H06        2Q05              2Q06
       1H05         1H06       2Q05         2Q06                      Power Purchase              Royalties
                                                                      Operational Expenses        Provisions
                                                                      Others

•   Increase in the volume of energy sold through the   •   Power Purchase - Transmission fees - increase in
    bilateral contract – 100% of assured energy since       volume of sales through bilateral contract
    January / 2006
                                                        •   Provisions – R$ 25.0 million in the 1H06 related to
•   Price readjustment occurred in July 2005: from          monetary correction of RTE (R$ 9.7 million) and
    R$ 117.59/MWh to R$ 132.73/MWh                          allowance for PIS / Cofins levied on the initial
                                                            contracts (R$ 15.3 million)

                                                                                                                    22
Results
                                                                                                                          R$ million


               EBITDA                                   Financial Results                                  Net Income

                        83.4%                    1H05         1H06   2Q05         2Q06
    79.5%
              77.7%                 77.1%                                                                  43.8%    42.3%     43.8%
                                                                                             39.1%
              543                                                                                          306
    427 27%                                                                       (24)       210     45%
                                                                     (34)
                                    269                                                                                   35% 153
                        223   20%                             (47)          30%                                    113

                                                        37%
                                                 (75)
    1H05      1H06    2Q05          2Q06                                                     1H05          1H06    2Q05       2Q06


•   Increase in volume of energy            •   Increase in financial income:            •   Increase in volume of energy
    sold through the bilateral                  more funds invested in securities            sold through the bilateral
    contract                                                                                 contract
                                            •   Decrease in financial expenses in
•   Decrease in EBITDA margin due               1H06: reduction in the IGP-M,            •   Improvement in the financial
    to the increase in the                      from 1.8% in the 1H05 to 1.4%                results
    operational provisions                      1H06


                                                                                                                             23
Debt

       Cash availability = R$ 776.7 million (jun06)

                               Amount -
         Creditor                                      Maturity                 Terms                Collateral
                               R$ million
        Eletrobras                  1,405.8                May-13       IGP-M + 10% p.y.             Receivables
        FunCesp III                   20.4                 Nov-17        IGP-DI + 6% p.y.            Receivables


                Net Debt – R$ billion                                         Breakdown of Financial Investments

                      3.2x
        3.3x                                                                          Prived Bonds
3.0x                         2.0x                                                          (A3)
                                    1.4x                               Foreign Bonds        1%
                1.4                                  1.1x               - US$ - (Aa1)
                                            0.7x
                             1.3                              0.6x           5%
 1.1                                 1.1                             Foreign Bonds
         1.1
                                                                      - US$ - (Aa3)
                                                     0.9                   6%
                                              0.7            0.6                                              Federal T
                                                                                                             Bonds (Ba3)
                                                                                                                88%


2000    2001    2002     2003        2004   2005    1H05     1H06

          Net Debt (R$ m illion)               Net Debt / EBITDA                                                     24
CAPEX

  Increase Capacity Requirement: waiting decision of ANEEL and São Paulo State
  Government
  Capex – 1H06: R$ 11.1 million:
          Bariri: re-equipping and modernization of the Generating Unit 2
          Reforestation

  Reducing the expected capital expenditure for 2006: R$ 43.7 million


              Capex – R$ million                                          Capex – 1H06

                                                   43.7
                                                                              7%
       37.5
                                                            25%
              30.5
                                    27.5

                             21.9
17.7
                      12.4                 11.1
                                                                                                        68%

2000   2001    2002   2003   2004   2005   1S06    2006
                                                  Revised         Equipment   Environmental   Others

                                                                                                         25
Dividend

Dividend Payment:
        Payout of 100% of the net income reported in the 1H6: R$ 305.5 million
             R$ 3.06 for 1,000 common shares
             R$ 3.36 for 1,000 non voting shares
        Payment in August 29, 2006

              Pay-out Ratio                                       Dividend Yield

                                                                                         11.8%
                                                    1S06*
 1S06       305.5 million             100.0%                                               12.4%


                                                                                                 13.6%
                                                      2005
 2005       538.9 million       96.9%                                                             14.1%


                                                                                          12.3%
                                                      2004
                                                                                             13.4%
 2004       276.9 million     95.0%

                                                                            6.6%
                                                      2003
                                                                                        11.4%
 2003       185.6 million     95.0%
                                                                  Votting          Non Votting
                                                   * annualized
                                                                                                          26
Conclusion


Generation was 22% higher than assured energy;

Operational Excellence: FR and EAF above ANEEL requirements;

Assured energy completely sold in the long term;

EBITDA of R$ 542.5 million in 1H06 – increase of 26.9% compared with
the same period of 2005;

Net Income of R$ 305.5 million in the 1H06, 45.2% higher than the
1H05 – net margin of 43.8% in the semester.


                                                                    27

More Related Content

What's hot

Slide presentation 1 q10
Slide presentation 1 q10Slide presentation 1 q10
Slide presentation 1 q10Cia Hering RI
 
2 q11 presentation results
2 q11 presentation results2 q11 presentation results
2 q11 presentation resultsrimagazineluiza
 
unum group Updated_Merrill_Lynch
unum group   Updated_Merrill_Lynchunum group   Updated_Merrill_Lynch
unum group Updated_Merrill_Lynchfinance26
 
Earnings release 4 q08 presentation
Earnings release 4 q08 presentationEarnings release 4 q08 presentation
Earnings release 4 q08 presentationBrasilEcodiesel
 
unum group Updated_Citigroup
unum group   Updated_Citigroupunum group   Updated_Citigroup
unum group Updated_Citigroupfinance26
 
baxter international Schedules_Q2-05
baxter international Schedules_Q2-05baxter international Schedules_Q2-05
baxter international Schedules_Q2-05finance24
 
wyeth Deutsche Bank 32nd Annual Health Care Conference
wyeth 	Deutsche Bank 32nd Annual Health Care Conferencewyeth 	Deutsche Bank 32nd Annual Health Care Conference
wyeth Deutsche Bank 32nd Annual Health Care Conferencefinance12
 
3 q08 financial and operationg results presentation
3 q08 financial and operationg results presentation3 q08 financial and operationg results presentation
3 q08 financial and operationg results presentationEquatorial
 
2Q11 Earnings Presentation
 2Q11 Earnings Presentation  2Q11 Earnings Presentation
2Q11 Earnings Presentation Multiplus
 

What's hot (16)

Slide presentation 1 q10
Slide presentation 1 q10Slide presentation 1 q10
Slide presentation 1 q10
 
2 q11 presentation results
2 q11 presentation results2 q11 presentation results
2 q11 presentation results
 
unum group Updated_Merrill_Lynch
unum group   Updated_Merrill_Lynchunum group   Updated_Merrill_Lynch
unum group Updated_Merrill_Lynch
 
Hl td
Hl tdHl td
Hl td
 
Earnings release 4 q08 presentation
Earnings release 4 q08 presentationEarnings release 4 q08 presentation
Earnings release 4 q08 presentation
 
Apre 4 t08
Apre 4 t08Apre 4 t08
Apre 4 t08
 
unum group Updated_Citigroup
unum group   Updated_Citigroupunum group   Updated_Citigroup
unum group Updated_Citigroup
 
2007 Results
2007 Results2007 Results
2007 Results
 
Social Externalities of Different Fuels in Brazil
Social Externalities of Different Fuels in BrazilSocial Externalities of Different Fuels in Brazil
Social Externalities of Different Fuels in Brazil
 
4Q08 Results
4Q08 Results4Q08 Results
4Q08 Results
 
baxter international Schedules_Q2-05
baxter international Schedules_Q2-05baxter international Schedules_Q2-05
baxter international Schedules_Q2-05
 
Apre 4 t06
Apre 4 t06Apre 4 t06
Apre 4 t06
 
Godawari Power
Godawari PowerGodawari Power
Godawari Power
 
wyeth Deutsche Bank 32nd Annual Health Care Conference
wyeth 	Deutsche Bank 32nd Annual Health Care Conferencewyeth 	Deutsche Bank 32nd Annual Health Care Conference
wyeth Deutsche Bank 32nd Annual Health Care Conference
 
3 q08 financial and operationg results presentation
3 q08 financial and operationg results presentation3 q08 financial and operationg results presentation
3 q08 financial and operationg results presentation
 
2Q11 Earnings Presentation
 2Q11 Earnings Presentation  2Q11 Earnings Presentation
2Q11 Earnings Presentation
 

Viewers also liked (9)

Apre 3 t05
Apre 3 t05Apre 3 t05
Apre 3 t05
 
Apre 2 t09
Apre 2 t09Apre 2 t09
Apre 2 t09
 
Apresentação institucional 1_q12_en_v8
Apresentação institucional 1_q12_en_v8Apresentação institucional 1_q12_en_v8
Apresentação institucional 1_q12_en_v8
 
Apre 3 t09
Apre 3 t09Apre 3 t09
Apre 3 t09
 
Apre 3 t06
Apre 3 t06Apre 3 t06
Apre 3 t06
 
3rd Quartes 2003 Results
3rd Quartes 2003 Results3rd Quartes 2003 Results
3rd Quartes 2003 Results
 
3 t10 aes eletropaulo
3 t10 aes eletropaulo3 t10 aes eletropaulo
3 t10 aes eletropaulo
 
Apre 4 t09
Apre 4 t09Apre 4 t09
Apre 4 t09
 
Apre 4 t05
Apre 4 t05Apre 4 t05
Apre 4 t05
 

Similar to Apre 2 t06 (20)

Apre 3 t07
Apre 3 t07Apre 3 t07
Apre 3 t07
 
2Q09 Results
2Q09 Results2Q09 Results
2Q09 Results
 
1Q09 Results
1Q09 Results1Q09 Results
1Q09 Results
 
11/13/2007 - 3Q07 Earnings Call Presentation
11/13/2007  	-   	3Q07 Earnings Call Presentation11/13/2007  	-   	3Q07 Earnings Call Presentation
11/13/2007 - 3Q07 Earnings Call Presentation
 
2Q07 Results
2Q07 Results2Q07 Results
2Q07 Results
 
3 q08 financial and operationg results presentation
3 q08 financial and operationg results presentation3 q08 financial and operationg results presentation
3 q08 financial and operationg results presentation
 
2Q06 Results
2Q06 Results2Q06 Results
2Q06 Results
 
3Q09 Results
3Q09 Results3Q09 Results
3Q09 Results
 
3rd Quarter 2008 Results
3rd Quarter 2008 Results3rd Quarter 2008 Results
3rd Quarter 2008 Results
 
Apre 3 t08
Apre 3 t08Apre 3 t08
Apre 3 t08
 
Webcast 3Q11 eng
Webcast 3Q11 engWebcast 3Q11 eng
Webcast 3Q11 eng
 
1 q07 financial and operating results presentation
1 q07 financial and operating results presentation1 q07 financial and operating results presentation
1 q07 financial and operating results presentation
 
Profarma apresentação 3 q11 final
Profarma apresentação 3 q11 finalProfarma apresentação 3 q11 final
Profarma apresentação 3 q11 final
 
Presentation aes eletropaulo_2_q12_sem discurso_v3
Presentation aes eletropaulo_2_q12_sem discurso_v3Presentation aes eletropaulo_2_q12_sem discurso_v3
Presentation aes eletropaulo_2_q12_sem discurso_v3
 
Apre 3 t04
Apre 3 t04Apre 3 t04
Apre 3 t04
 
3 q10 presentation
3 q10 presentation3 q10 presentation
3 q10 presentation
 
Webcast 2 q12 eng
Webcast 2 q12 engWebcast 2 q12 eng
Webcast 2 q12 eng
 
Investors meeting 1 q08 results
Investors meeting   1 q08 resultsInvestors meeting   1 q08 results
Investors meeting 1 q08 results
 
Earnings release 1 q11 presentation
Earnings release 1 q11 presentationEarnings release 1 q11 presentation
Earnings release 1 q11 presentation
 
3Q07 Results
3Q07 Results3Q07 Results
3Q07 Results
 

More from AES Eletropaulo

Apresentação bradesco ceo_forum2013_final (2)
Apresentação bradesco ceo_forum2013_final (2)Apresentação bradesco ceo_forum2013_final (2)
Apresentação bradesco ceo_forum2013_final (2)AES Eletropaulo
 
Apresentacao aes eletropaulo_3_q13_ing
Apresentacao aes eletropaulo_3_q13_ingApresentacao aes eletropaulo_3_q13_ing
Apresentacao aes eletropaulo_3_q13_ingAES Eletropaulo
 
Apresentacao aes eletropaulo_3_t13_final
Apresentacao aes eletropaulo_3_t13_finalApresentacao aes eletropaulo_3_t13_final
Apresentacao aes eletropaulo_3_t13_finalAES Eletropaulo
 
Apresentacao aes eletropaulo_4_q12_eng
Apresentacao aes eletropaulo_4_q12_engApresentacao aes eletropaulo_4_q12_eng
Apresentacao aes eletropaulo_4_q12_engAES Eletropaulo
 
Apresentacao aes eletropaulo_4_t12_v7
Apresentacao aes eletropaulo_4_t12_v7Apresentacao aes eletropaulo_4_t12_v7
Apresentacao aes eletropaulo_4_t12_v7AES Eletropaulo
 
Presentation aes eletropaulo_3_q12_sem discurso_v2
Presentation aes eletropaulo_3_q12_sem discurso_v2Presentation aes eletropaulo_3_q12_sem discurso_v2
Presentation aes eletropaulo_3_q12_sem discurso_v2AES Eletropaulo
 
Apresentacao aes eletropaulo_3_t12_sem discurso_v12
Apresentacao aes eletropaulo_3_t12_sem discurso_v12Apresentacao aes eletropaulo_3_t12_sem discurso_v12
Apresentacao aes eletropaulo_3_t12_sem discurso_v12AES Eletropaulo
 
Brasil 2013 btg pactual xiv ceo conference
Brasil 2013 btg pactual xiv ceo conferenceBrasil 2013 btg pactual xiv ceo conference
Brasil 2013 btg pactual xiv ceo conferenceAES Eletropaulo
 
Apresentacao aes eletropaulo_1_q13_eng_final
Apresentacao aes eletropaulo_1_q13_eng_finalApresentacao aes eletropaulo_1_q13_eng_final
Apresentacao aes eletropaulo_1_q13_eng_finalAES Eletropaulo
 
Apresentacao aes eletropaulo_1_t13_final - sem discurso
Apresentacao aes eletropaulo_1_t13_final - sem discursoApresentacao aes eletropaulo_1_t13_final - sem discurso
Apresentacao aes eletropaulo_1_t13_final - sem discursoAES Eletropaulo
 
Itaú bba 8th annual lat am ceo conference in ny
Itaú bba   8th annual lat am ceo conference in nyItaú bba   8th annual lat am ceo conference in ny
Itaú bba 8th annual lat am ceo conference in nyAES Eletropaulo
 
Hsbc utilities ceo roundtable
Hsbc utilities ceo roundtableHsbc utilities ceo roundtable
Hsbc utilities ceo roundtableAES Eletropaulo
 
6th annual citi brazil equity conference são paulo
6th annual citi brazil equity conference   são paulo6th annual citi brazil equity conference   são paulo
6th annual citi brazil equity conference são pauloAES Eletropaulo
 
Apresentação institucional 3_q12_en_v11
Apresentação institucional 3_q12_en_v11Apresentação institucional 3_q12_en_v11
Apresentação institucional 3_q12_en_v11AES Eletropaulo
 
Apresentação institucional audiencia pub lica
Apresentação institucional audiencia pub licaApresentação institucional audiencia pub lica
Apresentação institucional audiencia pub licaAES Eletropaulo
 
Apresentação expomoney en_v1 - impressão
Apresentação expomoney en_v1 - impressãoApresentação expomoney en_v1 - impressão
Apresentação expomoney en_v1 - impressãoAES Eletropaulo
 
Apresentação expomoney pt_cvm
Apresentação expomoney pt_cvmApresentação expomoney pt_cvm
Apresentação expomoney pt_cvmAES Eletropaulo
 
Apresentação institucional 3_q12_en_v8-
Apresentação institucional 3_q12_en_v8-Apresentação institucional 3_q12_en_v8-
Apresentação institucional 3_q12_en_v8-AES Eletropaulo
 
Apresentação institucional 3_q12_en_v11
Apresentação institucional 3_q12_en_v11Apresentação institucional 3_q12_en_v11
Apresentação institucional 3_q12_en_v11AES Eletropaulo
 
Apresentação institucional 3_q12_en_v11
Apresentação institucional 3_q12_en_v11Apresentação institucional 3_q12_en_v11
Apresentação institucional 3_q12_en_v11AES Eletropaulo
 

More from AES Eletropaulo (20)

Apresentação bradesco ceo_forum2013_final (2)
Apresentação bradesco ceo_forum2013_final (2)Apresentação bradesco ceo_forum2013_final (2)
Apresentação bradesco ceo_forum2013_final (2)
 
Apresentacao aes eletropaulo_3_q13_ing
Apresentacao aes eletropaulo_3_q13_ingApresentacao aes eletropaulo_3_q13_ing
Apresentacao aes eletropaulo_3_q13_ing
 
Apresentacao aes eletropaulo_3_t13_final
Apresentacao aes eletropaulo_3_t13_finalApresentacao aes eletropaulo_3_t13_final
Apresentacao aes eletropaulo_3_t13_final
 
Apresentacao aes eletropaulo_4_q12_eng
Apresentacao aes eletropaulo_4_q12_engApresentacao aes eletropaulo_4_q12_eng
Apresentacao aes eletropaulo_4_q12_eng
 
Apresentacao aes eletropaulo_4_t12_v7
Apresentacao aes eletropaulo_4_t12_v7Apresentacao aes eletropaulo_4_t12_v7
Apresentacao aes eletropaulo_4_t12_v7
 
Presentation aes eletropaulo_3_q12_sem discurso_v2
Presentation aes eletropaulo_3_q12_sem discurso_v2Presentation aes eletropaulo_3_q12_sem discurso_v2
Presentation aes eletropaulo_3_q12_sem discurso_v2
 
Apresentacao aes eletropaulo_3_t12_sem discurso_v12
Apresentacao aes eletropaulo_3_t12_sem discurso_v12Apresentacao aes eletropaulo_3_t12_sem discurso_v12
Apresentacao aes eletropaulo_3_t12_sem discurso_v12
 
Brasil 2013 btg pactual xiv ceo conference
Brasil 2013 btg pactual xiv ceo conferenceBrasil 2013 btg pactual xiv ceo conference
Brasil 2013 btg pactual xiv ceo conference
 
Apresentacao aes eletropaulo_1_q13_eng_final
Apresentacao aes eletropaulo_1_q13_eng_finalApresentacao aes eletropaulo_1_q13_eng_final
Apresentacao aes eletropaulo_1_q13_eng_final
 
Apresentacao aes eletropaulo_1_t13_final - sem discurso
Apresentacao aes eletropaulo_1_t13_final - sem discursoApresentacao aes eletropaulo_1_t13_final - sem discurso
Apresentacao aes eletropaulo_1_t13_final - sem discurso
 
Itaú bba 8th annual lat am ceo conference in ny
Itaú bba   8th annual lat am ceo conference in nyItaú bba   8th annual lat am ceo conference in ny
Itaú bba 8th annual lat am ceo conference in ny
 
Hsbc utilities ceo roundtable
Hsbc utilities ceo roundtableHsbc utilities ceo roundtable
Hsbc utilities ceo roundtable
 
6th annual citi brazil equity conference são paulo
6th annual citi brazil equity conference   são paulo6th annual citi brazil equity conference   são paulo
6th annual citi brazil equity conference são paulo
 
Apresentação institucional 3_q12_en_v11
Apresentação institucional 3_q12_en_v11Apresentação institucional 3_q12_en_v11
Apresentação institucional 3_q12_en_v11
 
Apresentação institucional audiencia pub lica
Apresentação institucional audiencia pub licaApresentação institucional audiencia pub lica
Apresentação institucional audiencia pub lica
 
Apresentação expomoney en_v1 - impressão
Apresentação expomoney en_v1 - impressãoApresentação expomoney en_v1 - impressão
Apresentação expomoney en_v1 - impressão
 
Apresentação expomoney pt_cvm
Apresentação expomoney pt_cvmApresentação expomoney pt_cvm
Apresentação expomoney pt_cvm
 
Apresentação institucional 3_q12_en_v8-
Apresentação institucional 3_q12_en_v8-Apresentação institucional 3_q12_en_v8-
Apresentação institucional 3_q12_en_v8-
 
Apresentação institucional 3_q12_en_v11
Apresentação institucional 3_q12_en_v11Apresentação institucional 3_q12_en_v11
Apresentação institucional 3_q12_en_v11
 
Apresentação institucional 3_q12_en_v11
Apresentação institucional 3_q12_en_v11Apresentação institucional 3_q12_en_v11
Apresentação institucional 3_q12_en_v11
 

Apre 2 t06

  • 1. 2nd quarter 2006 Results August 11, 2006
  • 2. Highlights Market Highlights Tariff Adjusment and Operating Operating Performance Performance Bilateral Contract Financial Performance Financial Performance Debt Profile Cash Flow Conclusion
  • 3.
  • 4. Highlights •Adjusted EBITDA of R$ 582.4 million and net profit of R$ 25.1 million 1Q06 •Compliance to the new rules of BOVESPA’s Level 2 •Increase of tag along from 70% to 80% •Board of Directors with at least 20% of independent members •Consolidated Net Debt reduction of 12% in the last 12 months and conclusion of the early liquidation of renegotiated debt 2Q06 •Adjusted EBITDA of R$ 1,253.6 million in 1H06 and R$ 671.2 million in 2Q06 – increases of 15.7% and 15.3% compared to equivalent periods of 2005 •Net profit of R$ 227 million in 1H06 (R$ 107 million higher than 1H05 figure) and R$ 201.9 million in 2Q06 (R$ 176.8 million higher than 1Q06 figure) •Tariff Adjustment – 11.45% (07/04/2006) Subsequent •Rating increased by S&P in 07/07/2006 (national scale – events from “BBB” to “BBB+”) •Approved in Extraordinary General Meeting (07/11/2006) the creation of new class B of Eletropaulo’s preferred shares that will offer 100% of tag along 4
  • 5. Consumption Comparison in GWh Average Tariff R$/MWh NOTE: Charts do not consider own consumption 2Q05 2Q06 Variation % RESIDENTIAL 307.3 306.1 - 0.4% INDUSTRIAL 219.6 242.5 + 10.5% COMMERCIAL 272.1 281.0 + 3.2% OTHERS 210.4 230.5 + 9.5% 4.7% TOTAL 267.3 279.1 + 3.9% 9,578 -0.6% 9,150 8.7% 7,968 7,924 3,209 2,952 -12.5% 2,434 2,433 39.9% 1,902 1,663 1,654 -8.9% 1,182 680 619 Residential Industrial Commercial Public Sector Free Billed Market Total Market and Others Consumers 2Q05 2Q06 5
  • 6. Retention of Potentially Free Consumers Net Revenues with TUSD X Free Captive Consumers X Free Consumers consumption % Total Market – 2Q06 99 106 95 84 78 1,654 Potentially Free 1,500 Consumers 54 1,312 1,407 Captive 48 2% 38 1,182 Consumers 30 964 81% 19 806 750 641 479 Free Consumers 17% 1Q04 2Q04 3Q04 4Q04 1Q05 2Q05 3Q05 4Q05 1Q06 2Q06 Free Consumers (GWh) TUSD (R$ million) Captive Market Evolution* (GWh) Increase of 5.3% (12 months) 7,621 7,453 7,465 7,076 6,998 7,261 7,315 6,718 6,983 7,016 * Excluding all current free consumers from all previous periods 1Q04 2Q04 3Q04 4Q04 1Q05 2Q05 3Q05 4Q05 1Q06 2Q06 6
  • 7. Tariff Evolution 18.6% 17.6% 13.8% 14.3% 11.1% 11.6% 11.5% 7.6% 12.1% 16.9% 7.5% 11.8% 7.3% 2.1% 9.9% 1.6% 6.3% 4.8% 3.7% 4.5% 3.6% 2.5% 1.7% 1.6% -4.3% 1999 2000 2001 2002 2003 2004 2005 2006 Part B Part A PIS/COFINS IGPM 2006 Tariff Adjustment by Consumption Class Index Low voltage -1.91% High voltage 8.26% A2 (88 to 138 kV) 4.57% A3a (34.5 kV) 6.20% A4 (2.3 to 25 kV) 9.08% 7
  • 8. Operating Highlights Loss Evolution (%) Collection Rate - % over Gross Revenue 13.5 12.9 13.4 12.2 97.5 99.0 97.7 99.0 7.9 7.3 7.8 -9% 6.6 +1.4% 5.6 5.6 5.6 5.6 2004 2005 1H05 1H06 2004 2005 1H05 1H06 Technical Losses Com m ercial Losses Fraud combat: 239 thousand inspections and 33 thousand frauds Collection Rate (current bills) detected Public Sector: 102.6% Cost of R$ 29 million Private Sector: 98.8% Retroactive Energy negotiated + Energy Added – 135 Increase of monthly average of cuts from 75 thousand to GWh (R$ 64 million) 111 thousand (1H05x1H06) Regularization of Clandestine Connections: 38 thousand regularizations – Revenue of R$ 26 million 8 Investment – R$17 million
  • 9. Capex 2Q06 R$ million 404 49 330 33 217 32 355 297 81 92 186 16 11 76 70 2003 2004 2005 1Q06 2Q06 Capex Self Financed R$ 173 million invested in the first semester of 2006 9
  • 10. Results R$ million Gross Revenue Operating Expenses EBITDA -12.2% -4.4% 33.4% 33.4% -5.7% +1.2% 29.4% 1,777.7 1,633.3 28.3% 1,561.5 1,561.5 4,2% 15,3% 2911.2 2744.2 2711.4 2744.2 644.2 671.2 671.2 635.7 582.4 737.1 730.7 737.1 1,243.4 72.6 147.9 147.9 1,055.9 1,036.4 1,055.9 158.6 2275.5 2007.1 1980.6 188.9 2007.1 168.5 157.6 157.6 523.3 523.3 423.8 365.8 348.0 408.0 348.0 571.6 2Q05 2Q06 1Q06 2Q06 2Q05 2Q06 1Q06 2Q06 2Q05 2Q06 1Q06 2Q06 Net Revenue Deductio ns fro m Operating Revenue Operating Expenses Sector Charges Electricity +Transport EBITDA Adjust Adjusted EBTIDA Margin • Increase over 1Q06: increase of 1.4% of billed • Reduction over 1Q06: decrease of 50% in • Adjusted EBITDA 2Q06: market and 2.8% of total market “Other Operating Expenses” – Liability Expenses - FCESP: R$ • Reduction over 2Q05: • Reversal of contingency with an 60.6 million • Conclusion of Tariff Review Process 2003 impact of R$ 13.8 million in the result – RTE: R$ 82.2 million (additional revenue of R$ 106.9 million in • Reduction over 2Q05: decrease of 25.2% in – Provision - RTE: R$ 5.0 million 2Q05) energy purchased costs • Revenue’s reversal of R$ 35 million in • Change in the energy purchase mix, 2Q06 (devolution to tariff of the increase with higher volume acquired in in Pis/Cofins taxes applied to Initial Contracts) auctions 10
  • 11. Results R$ million Financial Result Net Profit 2Q05 2Q06 1Q06 2Q06 201.9 201.9 47.7% 136.8 705.0% 61.9% (77.9) 3.7% 25.1 (126.1) (121.7) (126.1) 2Q05 2Q06 1Q06 2Q06 • Negative variations stemmed from: • Net Profit’s increase in the quarter: • The financial revenues’ reduction in the period: • Operating Expenses’ reduction – The reduction of Selic rate from 19.75% in 2Q05 to 16.50% in • IR/CS expenses reduction (71% over 1Q06 and 84% 1Q06 and 15.25% in 2Q06, that decreased regulatory assets’ compared to 2Q05) remuneration – The regulatory assets’ balance reduction on which the Selic remuneration is applied • Lower Real appreciation against the dollar (0.4% in 2Q06, compared to 11.8% in 2Q05 and 7.2% in 1Q06) - collaborated to reversals of monetary variation expenses of R$ 229 million in 2Q05 and R$ 85 million in 1Q06 11
  • 12. Consolidated Debt R$ million Short Term X Long Term Creditors X Indexes – 2Q06 -11.9% -3.5% 5,256 4,828 4,877 4,774 4,411 4,877 Gross Debt – R$ 4, 877 million 4,256 4,256 73% 77% 76% 77% IGP-DI 45.05% Fixed Rate 11.22% 27% 23% 24% 23% 2Q05 2Q06 1Q06 2Q06 LT ST Net Debt Libor CDI/Selic 3.33% Amortization Schedule - Current 40.26% Others/R$ 0.13% • Pension Fund - R$ 2,196 million • Private Creditors - R$ 2,127 million • BNDES - R$ 554 million 12 * Exchange Rate Conversion on 06/30/2006 - US$ 1.00 = R$ 2.1643
  • 13. Consolidated Debt R$ million Interest rates evolution Average Cost and Average Life CDI + 6.84% 112.0% -17.4% % 3.81 3.9 -1.6% -1.4% % CDI + CDI + 100.8% 100.4% 2.90% 2.50% CDI + 1.82% 2.05 Bonds 8th Debenture 9th Debenture CCB 2Q05 1Q06 2Q06 Avg cost - %CDI Avg Life - years Indebtedness Highlights – last 12 months Rating S&P • Gross Debt: reduction of 7% (R$ 380 million) National Scale BBB+ • Net Debt: reduction of 12% (R$ 572 million) ‘06 BBB B+ • Foreign Currency: reduced from 12% to 3% of total ‘05 BB • Hedge: 79% of foreign currency debt B+ ‘04 DDD • Borrowing of R$ 300 million of CCB’s - amortization of B- remaining balance of renegotiated debt (R$ 235 million) ‘03 D International Scale and liquidation of its swaps 13
  • 14. Cash Flow Eletropaulo - Consolidated Cash Flow (Million) 1Q06 2Q06 1H06 Initial Cash 492 356 492 Operating cash generation 687 653 1,340 Investments (101) (88) (189) Net Financial Expenses (196) (85) (281) Net Amortization (245) (45) (290) Pension Fund Expenses (134) (108) (242) Income Tax (147) (67) (214) Free Cash (136) 261 125 Final Cash 356 617 617 14
  • 15. Conclusion • Net profit of R$ 227.0 million in 1H06, representing an increase of R$ 107.0 million compared to 1H05 net profit • Adjusted EBITDA of R$ 1,253.5 million, 17.2% higher than 1H05’ figure • Debt evolution in the last 12 months: • Reduction of 11.9% of consolidated net debt • Reduction of 10.3% of average cost • Increase of average life from 2 to 4 years • Foreign currency debt reduced from 12.2% to 3.3% • Conclusion of the pre-payment of March 2004 renegotiated debt • Operating Highlights in the last 12 months: • Loss reduction of 9.0% • Collection rate increased 1.4% • Corporate Governance Differentiated Standards: • Creation of new class B of preferred shares with 100% of tag along and convertibility ratio of 1:1 for current preferred shareholders 15
  • 16. 16
  • 17. Highlights 1H06 • Starting in Jan/06, 100% of assured energy is sold through the bilateral contract with Eletropaulo 1Q06 • EBITDA = R$ 274 million • Net Income = R$ 153 million • Best Public Utility in 2005 according to Exame Magazine’s Melhores e Maiores Ranking • Best Public Held Company in 2005 according to the Platinum 2Q06 List of the Forbes Brasil • EBITDA: R$ 269 million in the 2Q06 and R$ 543 million in the 1H06 • Net Income: R$ 153 million in the 2Q06 and R$ 306 million in the 1H06 • Readjustment of the price of the bilateral contract with Eletropaulo in 0.9% Subsequent Events • Reversal of the allowance recorded related to penalties determined by CCEE in November and December/05 (R$ 3.9 million) 17
  • 18. Energy Balance– 1H06 Energy Generated x Billed Energy in GWh Caconde 2.9% 197.2 Euclides 4.0% 267.8 Limoeiro 1.1% 77.4 Água Vermelha 57.7% 82.3% Eletropaulo - Bilateral 3,891.2 5,557.0 Barra Bonita 4.4% TOTAL BILLED 299.5 Bariri 4.5% 6,748.9 6,748.9 301.0 17.7% MRE/CCEE* Ibitinga 5.4% 1,191.9 366.1 Promissão 8.5% 573.0 Nova Avanhandava 11.2% 757.6 Mogi Guaçu 0.3% 18.2 *After deducing own consumption and transmission losses, the difference is addressed to the Energy Reallocation Mechanism – MRE and to the Chamber of Energy Marketing – CCEE. 18 .
  • 19. Generation and Reliability AES Tietê’s assured energy is 1,275 MW average Plant Period Without Accidents –Years 1H06: generation was 22% over the assured energy. Ibitinga 18.0 During the last 20 years, AES Tietê has generated an Mogi-Guaçu 11.4 average of 18% above the assured energy Nova Avanhandava 8.5 Failure Index (FI) and Equivalent Availability Factor Água Vermelha 7.9 (EAF) figures exceed the requirements established by Limoeiro 5.9 Barra Bonita 5.8 the National Eclectic Energy Agency - ANEEL: 2.9% for Promissão 4.3 (FI) and 92.8% for EAF. Caconde 3.2 Average of 6.8 years of operations without accidents Euclides da Cunha 2.9 requiring the removal of personnel from the worksite Bariri 0.5 Generation Failure Index x Availability 123% 120% 123% 117% 122% 115% 109% 107% 98% 97.2% 96.8% 96.1% 94.2% 81% 90.9% 92.6% 95.7% 3.0% 1,617 1,619 1,581 1,554 2.8% 1,502 1,392 1,363 1,467 2.5% 1,258 2.2% 2.3% 2.2% 1,040 1.6% 1997 1998 1999 2000 2001 2002 2003 2004 2005 1S06 2000 2001 2002 2003 2004 2005 1S06* Generation - MW Average Generation / Assured Energy Failure Index Equivalent Availability Factor 19 *Annualized
  • 20. Bilateral Contract • Initial Contracts ended December 31, 2005 • Starting in January 2006, 1.268 MW (100% assured energy) is sold through the bilateral contract with Eletropaulo Price readjusted by the IGP-M variation in July Current Price = R$ 133.87 / MWh, readjusted in 0.86% in July 2006 Maturity: December 2015 Collateral: receivables Average Revenue – R$/ MWh 133.9 119.6 94.4 73.6 54.0 48.8 45.9 2000 2001 2002 2003 2004 2005 Bilateral Contract 20
  • 21. Operational Provision PIS and Cofins • In June 2006, Aneel published Technical Note, reaffirming its understanding of the PIS / Cofins taxation rules and determined that the amounts paid in excess due to the application of non-cumulative taxation rules to the initial contracts should be returned. • AES Tietê took the following measures: Made a formal inquiry to the Secretariat of the Federal Tax Office to confirm the taxation rules applicable to the Company; Initiated administrative proceedings at Aneel, requesting that the reimbursements to the distribution companies be suspended until the Company has obtained a reply to its inquiry from the Secretariat of the Federal Tax Office; Requested court injunctions to suspend the effect of Aneel’s resolutions concerning the reimbursement until the Secretariat of the Federal Tax Office has produced a reply to the inquiry made by AES Tietê Registered an allowance of the amount to be reimbursed to the distribution companies as corresponding tax credit is still a matter of controversy (R$ 15,3 million) RTE • Provision referring to the monetary correction of the balance of the credits to receive from energy distributors regarding the RTE (R$ 9.7 million, in the 1H06) 21
  • 22. Results R$ million Net Revenue Costs and Operational Expenses 190 34% 30% 698 142 54 538 25 40 96 16 25 59% 22 30% 349 24 61 37 20 268 26 19 12 11 17 14 36 49 17 24 1H05 1H06 2Q05 2Q06 1H05 1H06 2Q05 2Q06 Power Purchase Royalties Operational Expenses Provisions Others • Increase in the volume of energy sold through the • Power Purchase - Transmission fees - increase in bilateral contract – 100% of assured energy since volume of sales through bilateral contract January / 2006 • Provisions – R$ 25.0 million in the 1H06 related to • Price readjustment occurred in July 2005: from monetary correction of RTE (R$ 9.7 million) and R$ 117.59/MWh to R$ 132.73/MWh allowance for PIS / Cofins levied on the initial contracts (R$ 15.3 million) 22
  • 23. Results R$ million EBITDA Financial Results Net Income 83.4% 1H05 1H06 2Q05 2Q06 79.5% 77.7% 77.1% 43.8% 42.3% 43.8% 39.1% 543 306 427 27% (24) 210 45% (34) 269 35% 153 223 20% (47) 30% 113 37% (75) 1H05 1H06 2Q05 2Q06 1H05 1H06 2Q05 2Q06 • Increase in volume of energy • Increase in financial income: • Increase in volume of energy sold through the bilateral more funds invested in securities sold through the bilateral contract contract • Decrease in financial expenses in • Decrease in EBITDA margin due 1H06: reduction in the IGP-M, • Improvement in the financial to the increase in the from 1.8% in the 1H05 to 1.4% results operational provisions 1H06 23
  • 24. Debt Cash availability = R$ 776.7 million (jun06) Amount - Creditor Maturity Terms Collateral R$ million Eletrobras 1,405.8 May-13 IGP-M + 10% p.y. Receivables FunCesp III 20.4 Nov-17 IGP-DI + 6% p.y. Receivables Net Debt – R$ billion Breakdown of Financial Investments 3.2x 3.3x Prived Bonds 3.0x 2.0x (A3) 1.4x Foreign Bonds 1% 1.4 1.1x - US$ - (Aa1) 0.7x 1.3 0.6x 5% 1.1 1.1 Foreign Bonds 1.1 - US$ - (Aa3) 0.9 6% 0.7 0.6 Federal T Bonds (Ba3) 88% 2000 2001 2002 2003 2004 2005 1H05 1H06 Net Debt (R$ m illion) Net Debt / EBITDA 24
  • 25. CAPEX Increase Capacity Requirement: waiting decision of ANEEL and São Paulo State Government Capex – 1H06: R$ 11.1 million: Bariri: re-equipping and modernization of the Generating Unit 2 Reforestation Reducing the expected capital expenditure for 2006: R$ 43.7 million Capex – R$ million Capex – 1H06 43.7 7% 37.5 25% 30.5 27.5 21.9 17.7 12.4 11.1 68% 2000 2001 2002 2003 2004 2005 1S06 2006 Revised Equipment Environmental Others 25
  • 26. Dividend Dividend Payment: Payout of 100% of the net income reported in the 1H6: R$ 305.5 million R$ 3.06 for 1,000 common shares R$ 3.36 for 1,000 non voting shares Payment in August 29, 2006 Pay-out Ratio Dividend Yield 11.8% 1S06* 1S06 305.5 million 100.0% 12.4% 13.6% 2005 2005 538.9 million 96.9% 14.1% 12.3% 2004 13.4% 2004 276.9 million 95.0% 6.6% 2003 11.4% 2003 185.6 million 95.0% Votting Non Votting * annualized 26
  • 27. Conclusion Generation was 22% higher than assured energy; Operational Excellence: FR and EAF above ANEEL requirements; Assured energy completely sold in the long term; EBITDA of R$ 542.5 million in 1H06 – increase of 26.9% compared with the same period of 2005; Net Income of R$ 305.5 million in the 1H06, 45.2% higher than the 1H05 – net margin of 43.8% in the semester. 27