Download to read offline


![Bone Marrow Examination
Bone marrow aspirate and smear or a needle biopsy.
In patients with hypoproliferative anemia and normal iron
status, it is indicated.
Can diagnose primary marrow disorders such as
myelofibrosis, a red cell maturation defect, or an
infiltrative disease.
The increase or decrease of one cell lineage (myeloid vs
erythroid) compared to another is obtained by a
differential count of nucleated cells in a bone marrow
smear (the myeloid/erythroid [M/E] ratio).
Maturation disorders are identified from the discrepancy
between the M/E ratio and the reticulocyte production
index .](https://image.slidesharecdn.com/approachtoanemiabikal-200827155340/85/Approach-to-anemia-bikal-25-320.jpg)


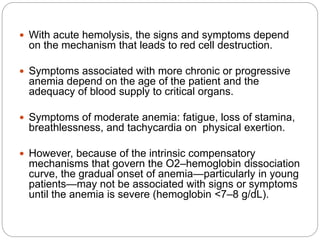
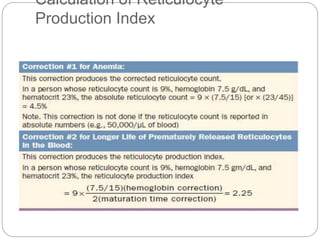
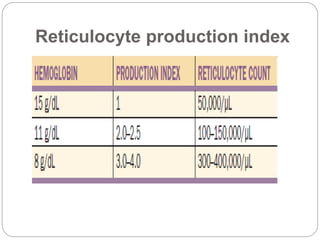
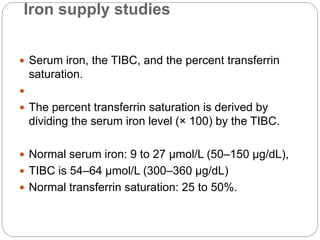
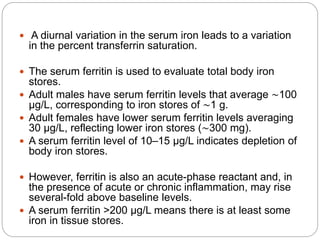
This document provides an overview of approaches to anemia. It begins by defining anemia and describing normal hemoglobin levels based on age, sex and pregnancy status. It then discusses the classification of anemias based on underlying causes such as defects in erythropoiesis, iron availability or red blood cell survival. Clinical presentations and compensatory mechanisms are reviewed. The laboratory evaluation of anemia including complete blood count, iron studies and bone marrow examination is outlined. Finally, the document classifies specific types of anemias such as hypoproliferative anemias, maturation disorders, blood loss anemias and hemolytic anemias based on laboratory findings.


![CTEV [ clubfoot] DR ARUN LAL ,DR MOHAMED ASHRAF travancore medical college k...](https://cdn.slidesharecdn.com/ss_thumbnails/ctevclubfootdrarunlaldrmohamedashraftravancoremedicalcollegekollamkeralaindia-260208063247-18fc466c-thumbnail.jpg?width=640&height=640&fit=bounds)


