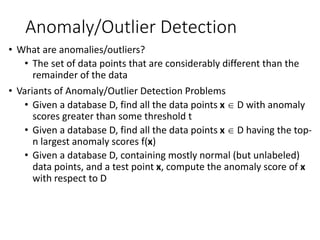
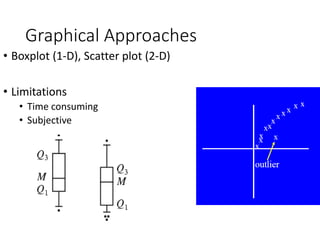
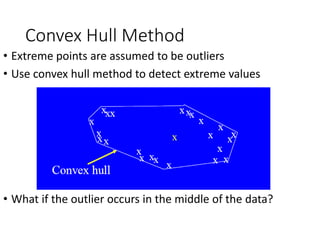
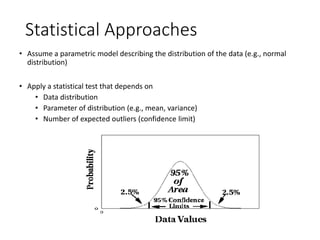
Anomaly Detection
Anomaly/Outlier Detection
• What are anomalies/outliers?
• The set of data points that are considerably different than the
remainder of the data
• Variants of Anomaly/Outlier Detection Problems
• Given a database D, find all the data points x  D with anomaly
scores greater than some threshold t
• Given a database D, find all the data points x  D having the top-
n largest anomaly scores f(x)
• Given a database D, containing mostly normal (but unlabeled)
data points, and a test point x, compute the anomaly score of x
with respect to D
Applications
• Credit card fraud detection
• telecommunication fraud detection
• network intrusion detection
• fault detection
• many more
Anomaly Detection
• Challenges
• How many outliers are there in the data?
• Method is unsupervised
• Validation can be quite challenging (just like for clustering)
• Finding needle in a haystack
• Working assumption:
• There are considerably more “normal” observations
than “abnormal” observations (outliers/anomalies) in
the data
Graphical Approaches
• Boxplot (1-D), Scatter plot (2-D)
• Limitations
• Time consuming
• Subjective
Convex Hull Method
• Extreme points are assumed to be outliers
• Use convex hull method to detect extreme values
• What if the outlier occurs in the middle of the data?
Statistical Approaches
• Assume a parametric model describing the distribution of the data (e.g., normal
distribution)
• Apply a statistical test that depends on
• Data distribution
• Parameter of distribution (e.g., mean, variance)
• Number of expected outliers (confidence limit)
Distance-based Approaches
• Data is represented as a vector of features
• Three major approaches
• Nearest-neighbor based
• Density based
• Clustering based

Annommaly detection techniques and approaches

  • 1.
  • 2.
    Anomaly/Outlier Detection • Whatare anomalies/outliers? • The set of data points that are considerably different than the remainder of the data • Variants of Anomaly/Outlier Detection Problems • Given a database D, find all the data points x  D with anomaly scores greater than some threshold t • Given a database D, find all the data points x  D having the top- n largest anomaly scores f(x) • Given a database D, containing mostly normal (but unlabeled) data points, and a test point x, compute the anomaly score of x with respect to D
  • 3.
    Applications • Credit cardfraud detection • telecommunication fraud detection • network intrusion detection • fault detection • many more
  • 4.
    Anomaly Detection • Challenges •How many outliers are there in the data? • Method is unsupervised • Validation can be quite challenging (just like for clustering) • Finding needle in a haystack • Working assumption: • There are considerably more “normal” observations than “abnormal” observations (outliers/anomalies) in the data
  • 5.
    Graphical Approaches • Boxplot(1-D), Scatter plot (2-D) • Limitations • Time consuming • Subjective
  • 6.
    Convex Hull Method •Extreme points are assumed to be outliers • Use convex hull method to detect extreme values • What if the outlier occurs in the middle of the data?
  • 7.
    Statistical Approaches • Assumea parametric model describing the distribution of the data (e.g., normal distribution) • Apply a statistical test that depends on • Data distribution • Parameter of distribution (e.g., mean, variance) • Number of expected outliers (confidence limit)
  • 8.
    Distance-based Approaches • Datais represented as a vector of features • Three major approaches • Nearest-neighbor based • Density based • Clustering based