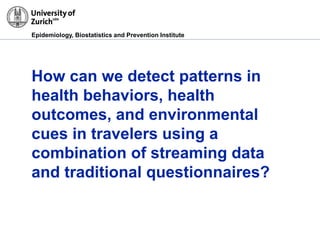
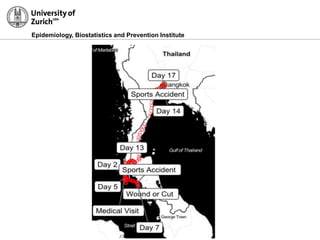
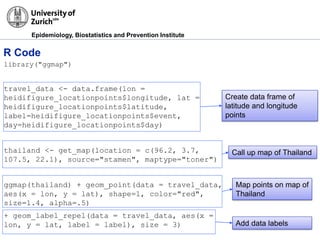
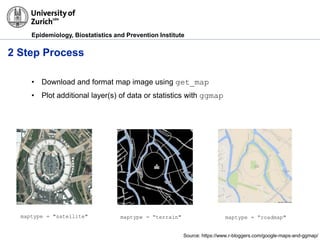
The document discusses mapping health data from travelers using R code and visualization. It proposes combining streaming data with questionnaires to detect patterns in health behaviors, outcomes, and environmental cues. It provides an example R code to map location points from a travel dataset on a map of Thailand. The code creates a data frame with latitude and longitude points, calls up a Stamen toner map of Thailand, plots the points on the map, and adds labels to the points. A two step process for mapping data with R is also outlined.


![제 23회 보아즈(BOAZ) 빅데이터 컨퍼런스 - [MBOAX] : ABSA를 활용한 소비자 반응 분석 기반 운영 효율화 대시보드 설계](https://cdn.slidesharecdn.com/ss_thumbnails/3-1boaz23rdconferencemboax-260203102709-9d519923-thumbnail.jpg?width=640&height=640&fit=bounds)


