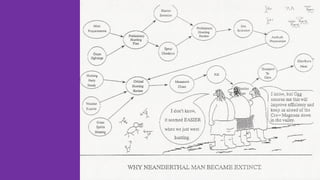
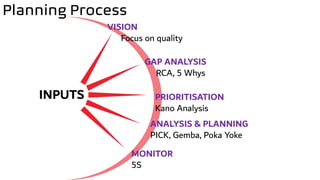
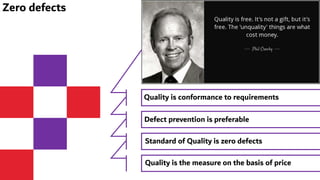
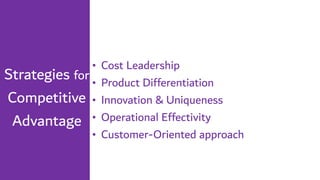
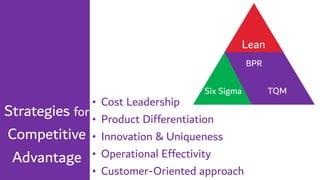
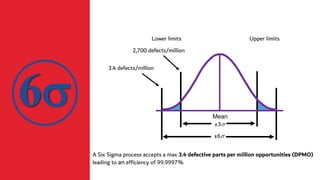
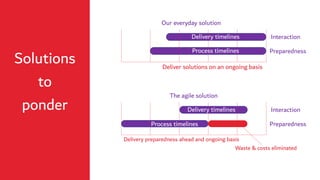
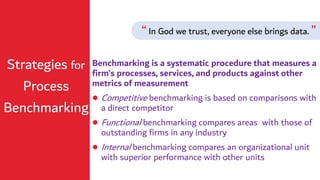
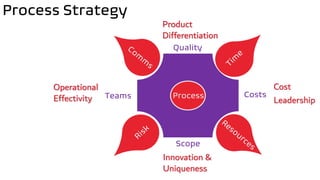
Process
planning
“No one has enough time for
everything.
But change does not come by
prioritizing everything else.”
~Kano Analysis
Planning Process
INPUTS
VISION
Focus on quality
GAP ANALYSIS
RCA, 5 Whys
PRIORITISATION
Kano Analysis
ANALYSIS & PLANNING
PICK, Gemba, Poka Yoke
MONITOR
5S
Zero defects
Quality is conformance to requirements
Defect prevention is preferable
Standard of Quality is zero defects
Quality is the measure on the basis of price
Is it enough
to have Zero
defects?
Satisfaction
Importance
Strategies for
Competitive
Advantage
• Cost Leadership
• Product Differentiation
• Innovation & Uniqueness
• Operational Effectivity
• Customer-Oriented approach
Strategies for
Competitive
Advantage
• Cost Leadership
• Product Differentiation
• Innovation & Uniqueness
• Operational Effectivity
• Customer-Oriented approach
Lean
Six Sigma TQM
BPR
A Six Sigma process accepts a max 3.4 defective parts per million opportunities (DPMO)
leading to an efficiency of 99.9997%
Lower limits Upper limits
3.4 defects/million
±6
2,700 defects/million
±3
Mean
6
Solutions
to
ponder
Interaction
Preparedness
Interaction
Preparedness
Our everyday solution
Deliver solutions on an ongoing basis
Delivery preparedness ahead and ongoing basis
Waste & costs eliminated
Process timelines
Delivery timelines
Process timelines
Delivery timelines
The agile solution
Benchmarking is a systematic procedure that measures a
firm’s processes, services, and products against other
metrics of measurement
⚫ Competitive benchmarking is based on comparisons with
a direct competitor
⚫ Functional benchmarking compares areas with those of
outstanding firms in any industry
⚫ Internal benchmarking compares an organizational unit
with superior performance with other units
Strategies for
Process
Benchmarking
“ In God we trust, everyone else brings data. ”
Quality is what the customer says it is.
Think of yourself as the customer.
Customer satisfaction is impossible without employee
satisfaction.
Improve continuously to stay agile.
Leadership and accountability make quality happen.
Focusing on quality increases efficiency; focusing on
efficiency often decreases quality.
If you can’t measure it, you can’t manage it.
Strategies for
Process
Improvement
Value Creation
• Customer is willing to pay for it
• Transforms a product or service
• Helps eliminate wastage
• Delivers correct the first time
Strategies for
Process
Implementation
WHAT WHAT
HOW HOW
NOW FUTURE
NOW FUTURE
Current State
Current Data Future State
Future Data
Gap Analysis
Customer’s
expectations
concerning a
product or service
Customer’s
perceptions
concerning the
product or service
Previous
Experience
Word of mouth
communications
Image of product or
service
Customer’s own
specification of
quality
Management’s
concept of the
product or service
organization’s
specification of
quality
The actual product or
serviceGap 1
Gap 2
Gap 3
Gap 4
5 Whys
Problem:
Orders are late going
out the door.•Product not completed
on time
•Spend too much time hunting
down tools
•Tools are located in various
places
•Different people store tools
in different places
•No standard protocol for tool
storage
Why?
Why?
Why?
Why?
Why?
Poka-Yoke
Poka-Yoke (Mistake-Proofing)
Poka-yoke – an approach for mistake-proofing processes using
automatic devices or methods to avoid simple human or
machine error, such as forgetfulness, misunderstanding, errors
in identification, lack of experience, absentmindedness, delays,
or malfunctions.
Poka-Yoke
Poka-Yoke 3 levels DESIGN
Design potential errors out of the product or process –
Eliminates any possibility that the error or defect might occur.
IDENTIFY
Identify potential defects and stopping a process before the
defect is produced – Requires time to stop a process and take
corrective action.
ELIMINATE
Find defects that enter or leave a process – Eliminates wasted
resources that would add value to nonconforming work, but
clearly result in scrap or rework.
PICK Chart
Possible Kill
Implement ChallengeG1
G2
G3
G4
G5
High Importance
High Dysfunction
High Importance
Low Dysfunction
Low Importance
High Dysfunction
Low Importance
Low Dysfunction
K1
K2
K3
K4
K5
M
1
M
2
M
3
M
4
M
5
G1
G2
G3
G4
G5
S1
S2
S3
S4
S5
B1
B2
B3
B4
B5
Mandates
Act Influence React
Address processes with customer touchpoints first
Start with the end in mind
See how far you can break down the tasks
Keep the list of resources to understand impact
New processes should generate data; gains should be measurable
Check for the application of resources sequentially
Keep eliminating mistakes – Poka Yoke
Team Mandates
How many people on a team?
Five people per team is best practice
o Smaller teams may not have fully realized solutions
o Larger teams may become bogged down in too many opinions
Who should be on the team?
Process Owner & Maker mandatory
Helps ensure process sees ‘light of day’
A Process Expert or benefactor view
Intimately understand the process or suggests usage
Outsider
Someone with ‘no skin in the game’
Outside perspectives can lead to unexpected solutions
Process Strategy
Process
Scope
Quality
Teams Costs
✓Productivity
✓Efficiency
✓Cycle Time
✓Benchmarking
Process
Scope
Quality
Teams Costs
Benefactor
Owner
User
Maker
Process Ownership
Process Strategy
Process
Scope
Quality
Teams Costs
Cost
Leadership
Product
Differentiation
Operational
Effectivity
Innovation &
Uniqueness
WHY
WHAT WHEN HOW
Functional Flow
Process
Tasks Time Outcome
Why is the goal
Functional Flow
How is the goal
Process Flow
Task Junction/Decision
Process Flow
Humans are the weakest link in any process.
Why?

Analysis Prioritisation Communication-Day Seven

  • 1.
  • 2.
    “No one hasenough time for everything. But change does not come by prioritizing everything else.” ~Kano Analysis
  • 4.
    Planning Process INPUTS VISION Focus onquality GAP ANALYSIS RCA, 5 Whys PRIORITISATION Kano Analysis ANALYSIS & PLANNING PICK, Gemba, Poka Yoke MONITOR 5S
  • 6.
    Zero defects Quality isconformance to requirements Defect prevention is preferable Standard of Quality is zero defects Quality is the measure on the basis of price
  • 7.
    Is it enough tohave Zero defects? Satisfaction Importance
  • 8.
    Strategies for Competitive Advantage • CostLeadership • Product Differentiation • Innovation & Uniqueness • Operational Effectivity • Customer-Oriented approach
  • 9.
    Strategies for Competitive Advantage • CostLeadership • Product Differentiation • Innovation & Uniqueness • Operational Effectivity • Customer-Oriented approach Lean Six Sigma TQM BPR
  • 10.
    A Six Sigmaprocess accepts a max 3.4 defective parts per million opportunities (DPMO) leading to an efficiency of 99.9997% Lower limits Upper limits 3.4 defects/million ±6 2,700 defects/million ±3 Mean 6
  • 11.
    Solutions to ponder Interaction Preparedness Interaction Preparedness Our everyday solution Deliversolutions on an ongoing basis Delivery preparedness ahead and ongoing basis Waste & costs eliminated Process timelines Delivery timelines Process timelines Delivery timelines The agile solution
  • 12.
    Benchmarking is asystematic procedure that measures a firm’s processes, services, and products against other metrics of measurement ⚫ Competitive benchmarking is based on comparisons with a direct competitor ⚫ Functional benchmarking compares areas with those of outstanding firms in any industry ⚫ Internal benchmarking compares an organizational unit with superior performance with other units Strategies for Process Benchmarking “ In God we trust, everyone else brings data. ”
  • 13.
    Quality is whatthe customer says it is. Think of yourself as the customer. Customer satisfaction is impossible without employee satisfaction. Improve continuously to stay agile. Leadership and accountability make quality happen. Focusing on quality increases efficiency; focusing on efficiency often decreases quality. If you can’t measure it, you can’t manage it. Strategies for Process Improvement
  • 14.
    Value Creation • Customeris willing to pay for it • Transforms a product or service • Helps eliminate wastage • Delivers correct the first time
  • 15.
    Strategies for Process Implementation WHAT WHAT HOWHOW NOW FUTURE NOW FUTURE Current State Current Data Future State Future Data
  • 16.
    Gap Analysis Customer’s expectations concerning a productor service Customer’s perceptions concerning the product or service Previous Experience Word of mouth communications Image of product or service Customer’s own specification of quality Management’s concept of the product or service organization’s specification of quality The actual product or serviceGap 1 Gap 2 Gap 3 Gap 4
  • 17.
    5 Whys Problem: Orders arelate going out the door.•Product not completed on time •Spend too much time hunting down tools •Tools are located in various places •Different people store tools in different places •No standard protocol for tool storage Why? Why? Why? Why? Why?
  • 18.
    Poka-Yoke Poka-Yoke (Mistake-Proofing) Poka-yoke –an approach for mistake-proofing processes using automatic devices or methods to avoid simple human or machine error, such as forgetfulness, misunderstanding, errors in identification, lack of experience, absentmindedness, delays, or malfunctions.
  • 19.
    Poka-Yoke Poka-Yoke 3 levelsDESIGN Design potential errors out of the product or process – Eliminates any possibility that the error or defect might occur. IDENTIFY Identify potential defects and stopping a process before the defect is produced – Requires time to stop a process and take corrective action. ELIMINATE Find defects that enter or leave a process – Eliminates wasted resources that would add value to nonconforming work, but clearly result in scrap or rework.
  • 20.
    PICK Chart Possible Kill ImplementChallengeG1 G2 G3 G4 G5 High Importance High Dysfunction High Importance Low Dysfunction Low Importance High Dysfunction Low Importance Low Dysfunction K1 K2 K3 K4 K5 M 1 M 2 M 3 M 4 M 5 G1 G2 G3 G4 G5 S1 S2 S3 S4 S5 B1 B2 B3 B4 B5
  • 21.
    Mandates Act Influence React Addressprocesses with customer touchpoints first Start with the end in mind See how far you can break down the tasks Keep the list of resources to understand impact New processes should generate data; gains should be measurable Check for the application of resources sequentially Keep eliminating mistakes – Poka Yoke
  • 22.
    Team Mandates How manypeople on a team? Five people per team is best practice o Smaller teams may not have fully realized solutions o Larger teams may become bogged down in too many opinions Who should be on the team? Process Owner & Maker mandatory Helps ensure process sees ‘light of day’ A Process Expert or benefactor view Intimately understand the process or suggests usage Outsider Someone with ‘no skin in the game’ Outside perspectives can lead to unexpected solutions
  • 23.
  • 24.
  • 25.
  • 26.
  • 27.
    Process Tasks Time Outcome Whyis the goal Functional Flow How is the goal
  • 28.
  • 29.
    Process Flow Humans arethe weakest link in any process. Why?