Download to read offline


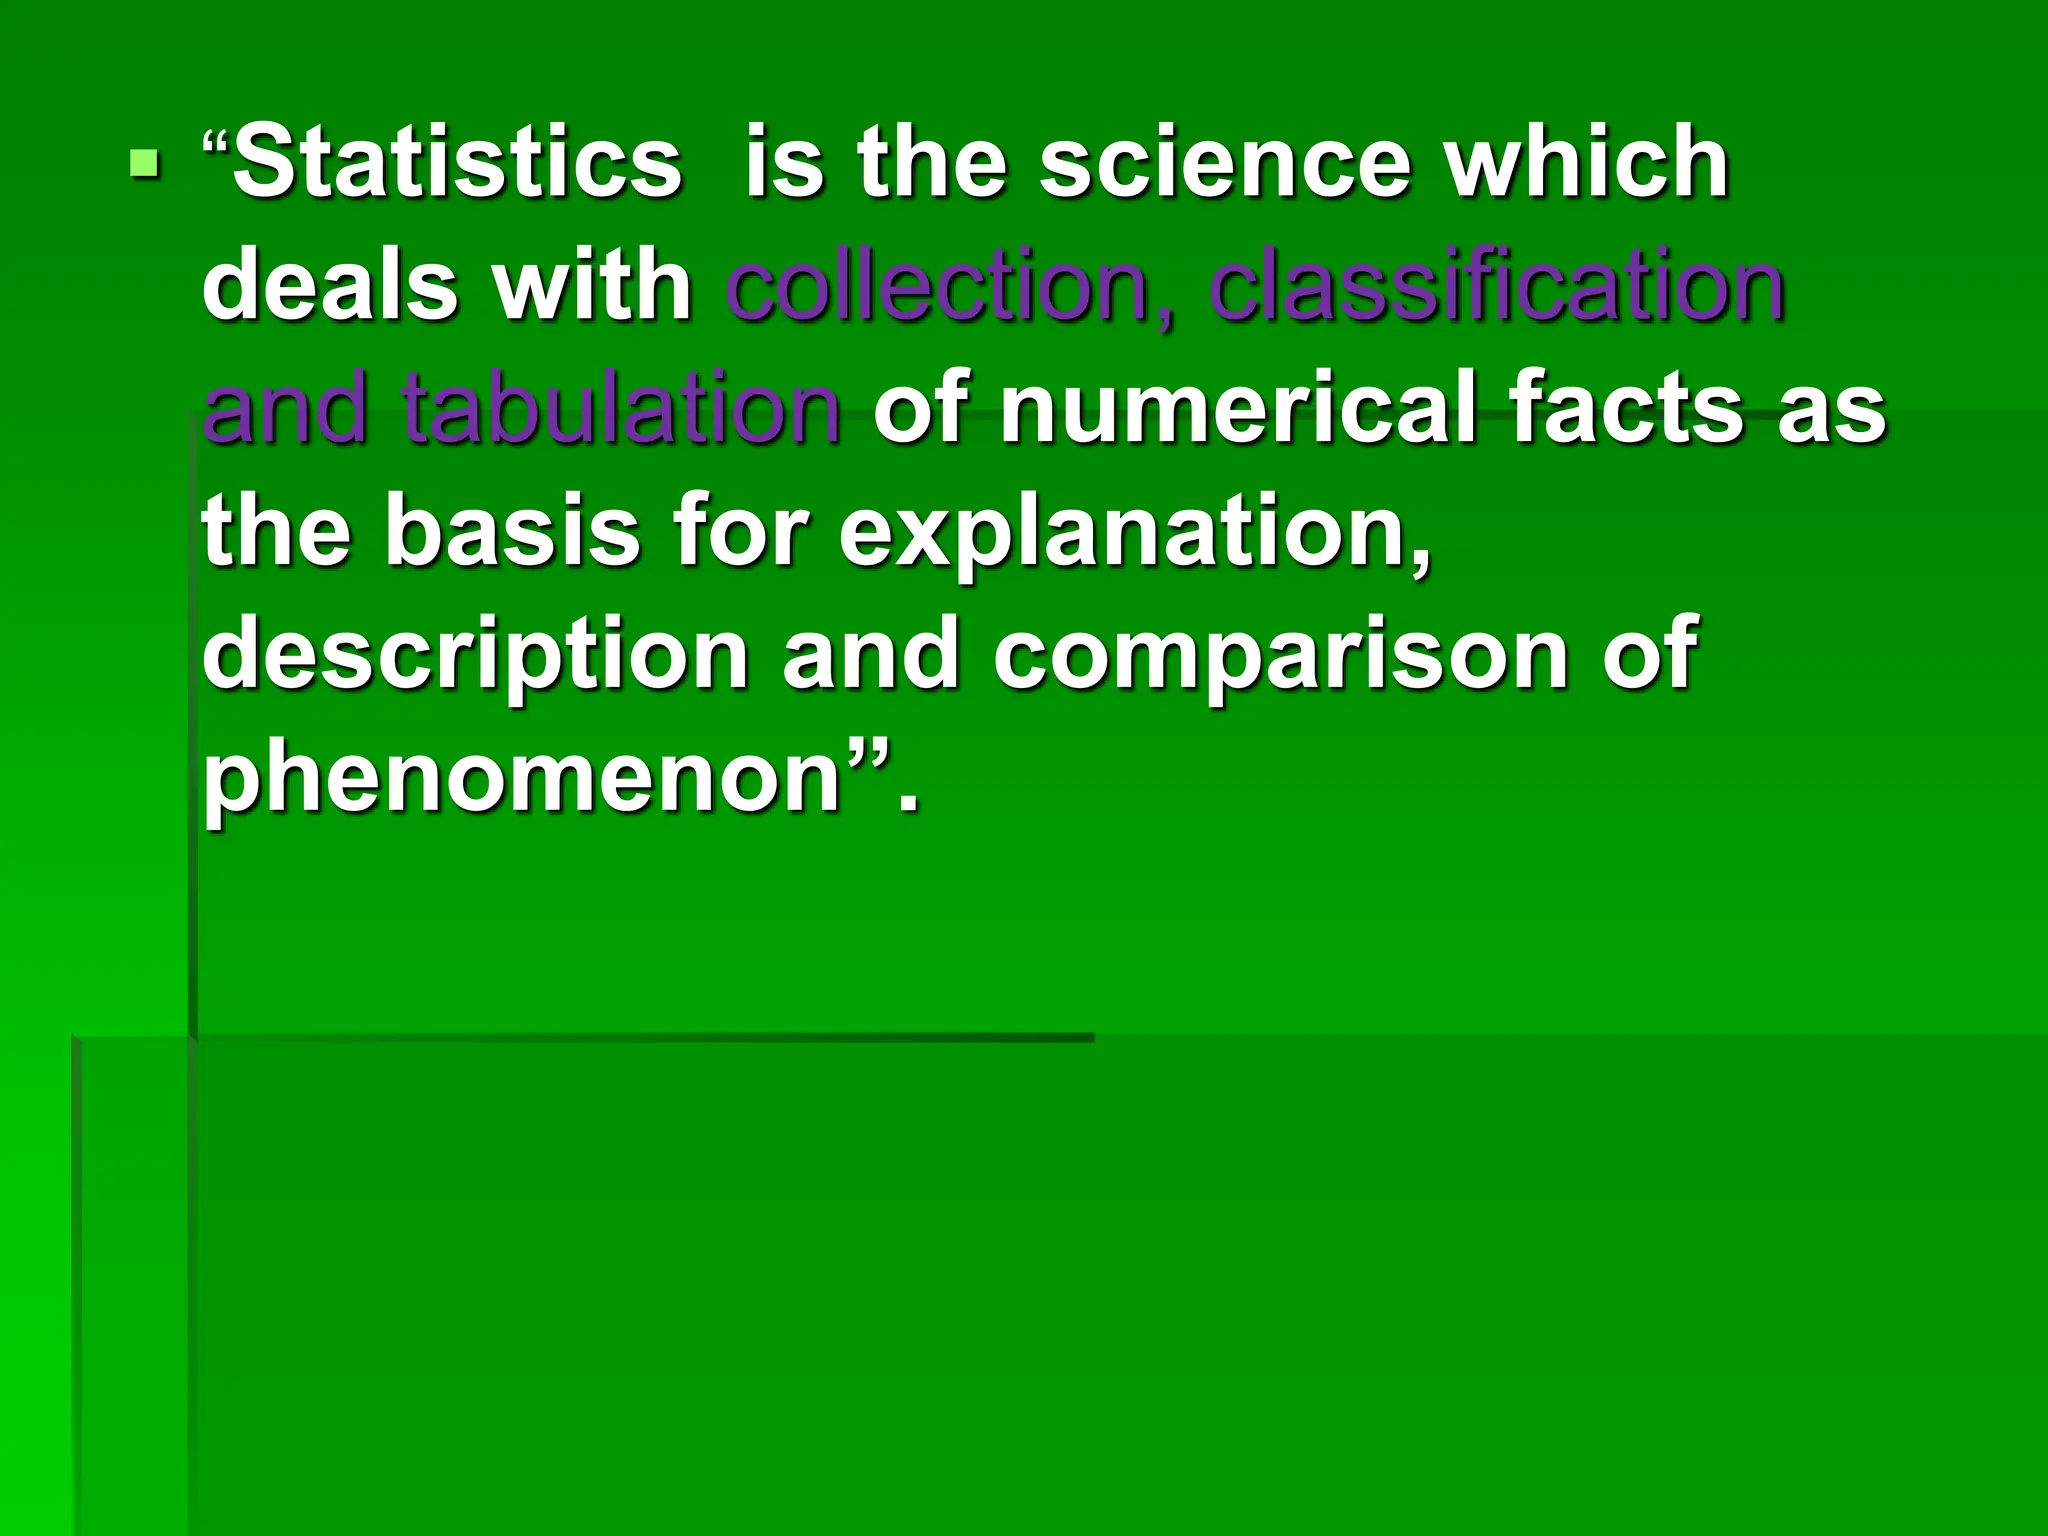
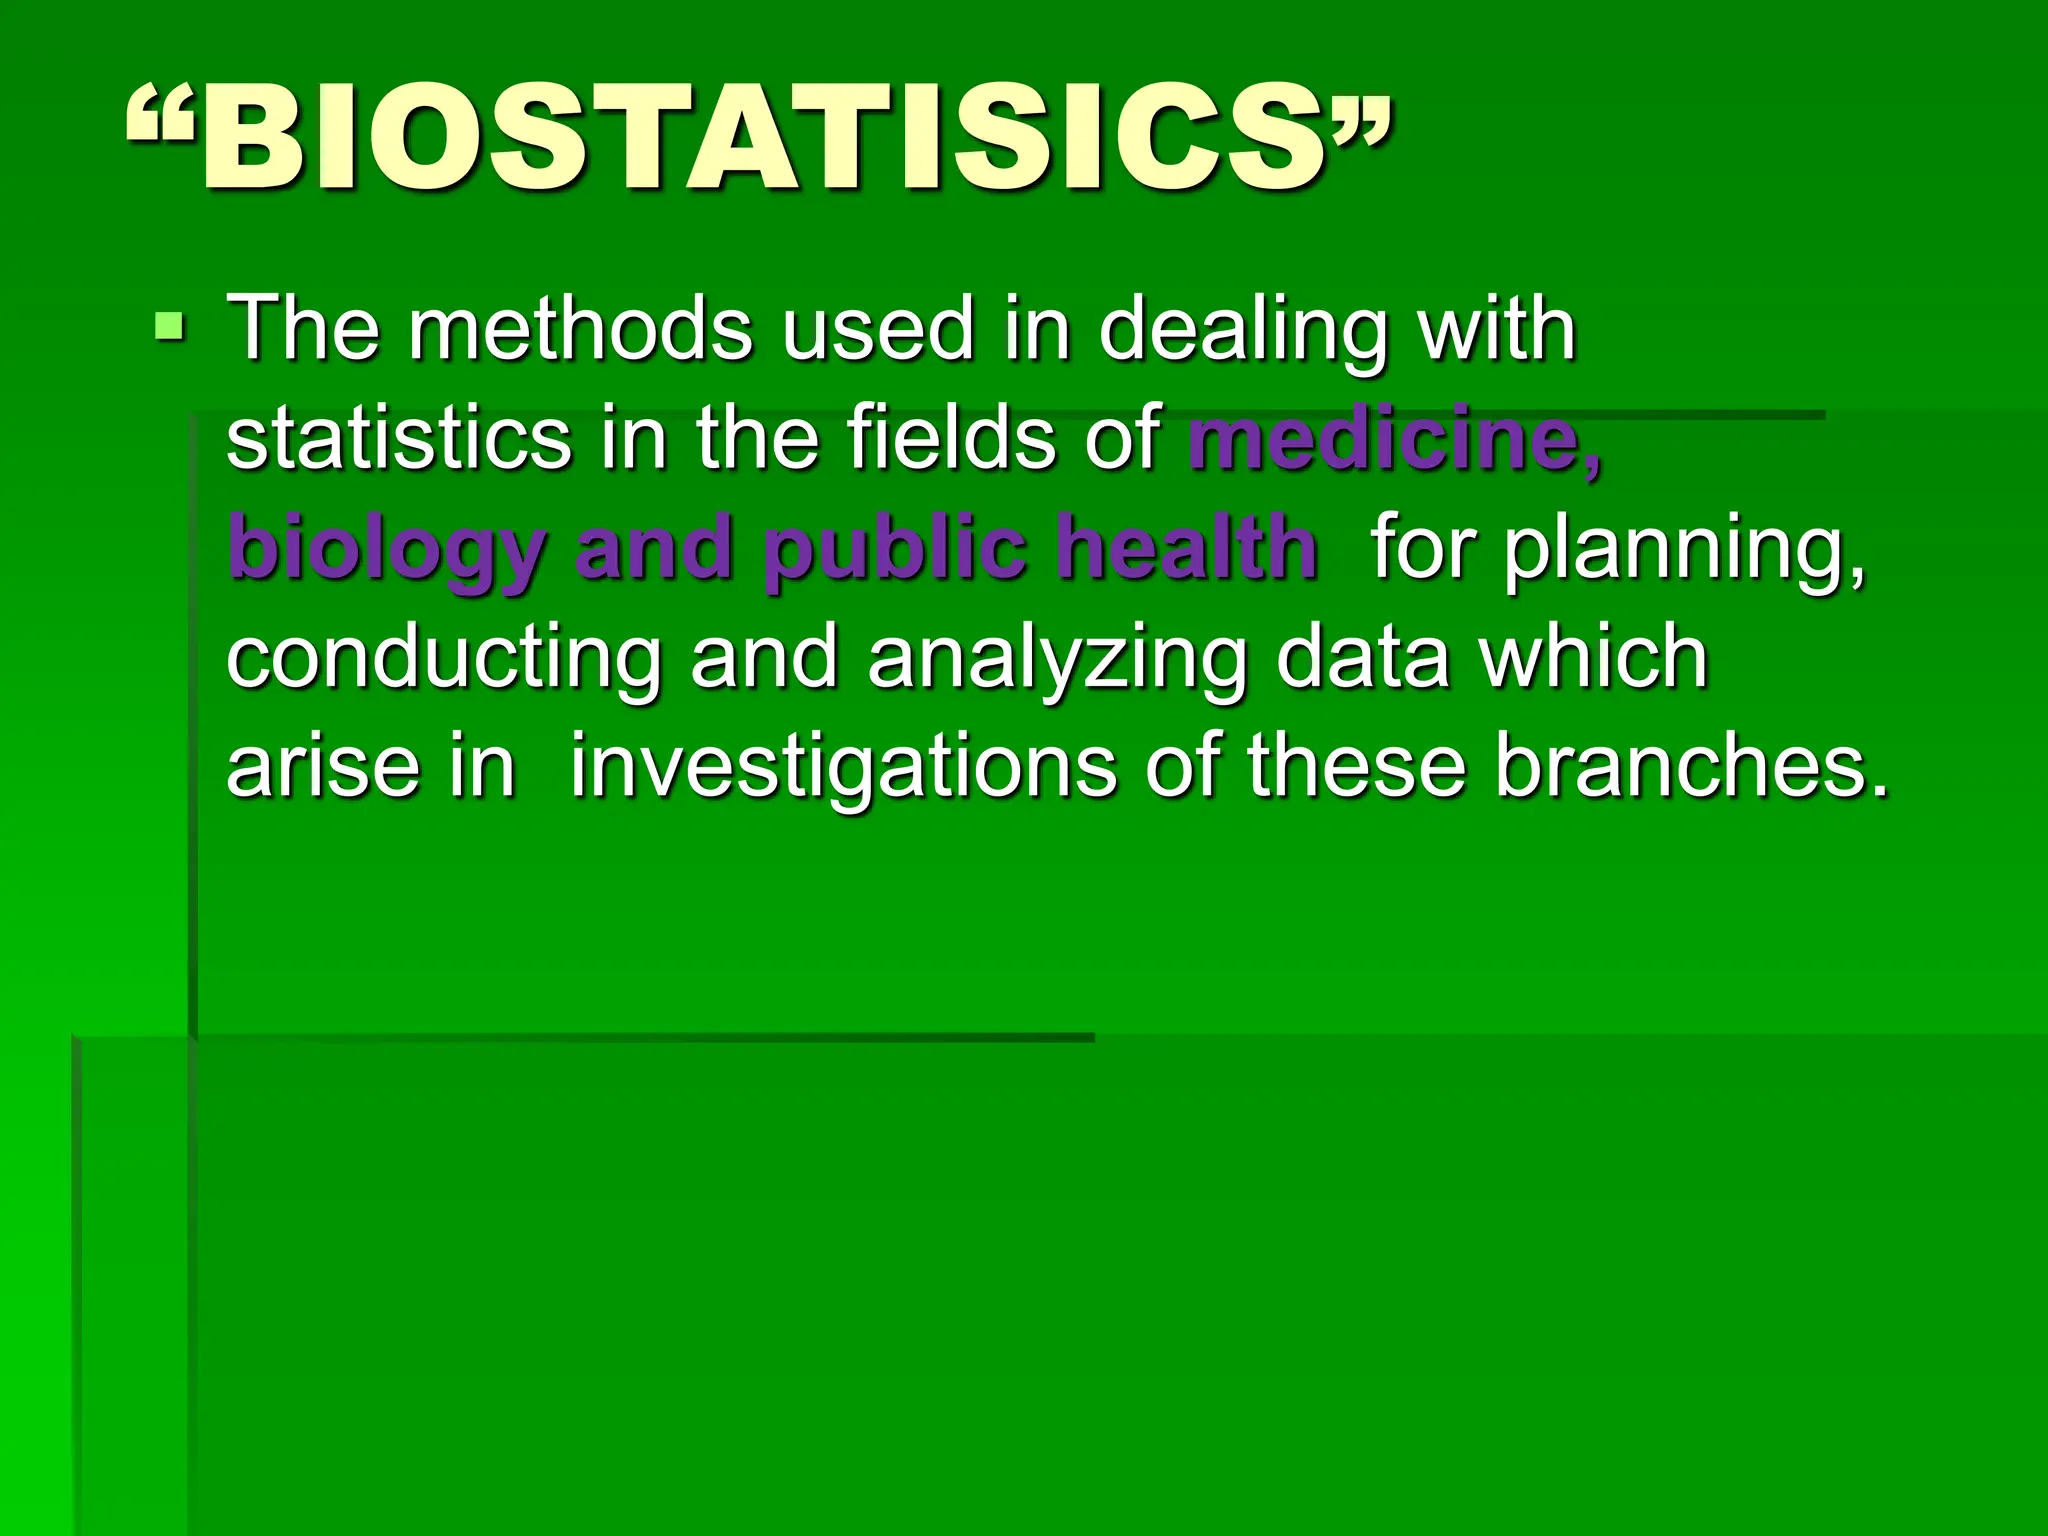

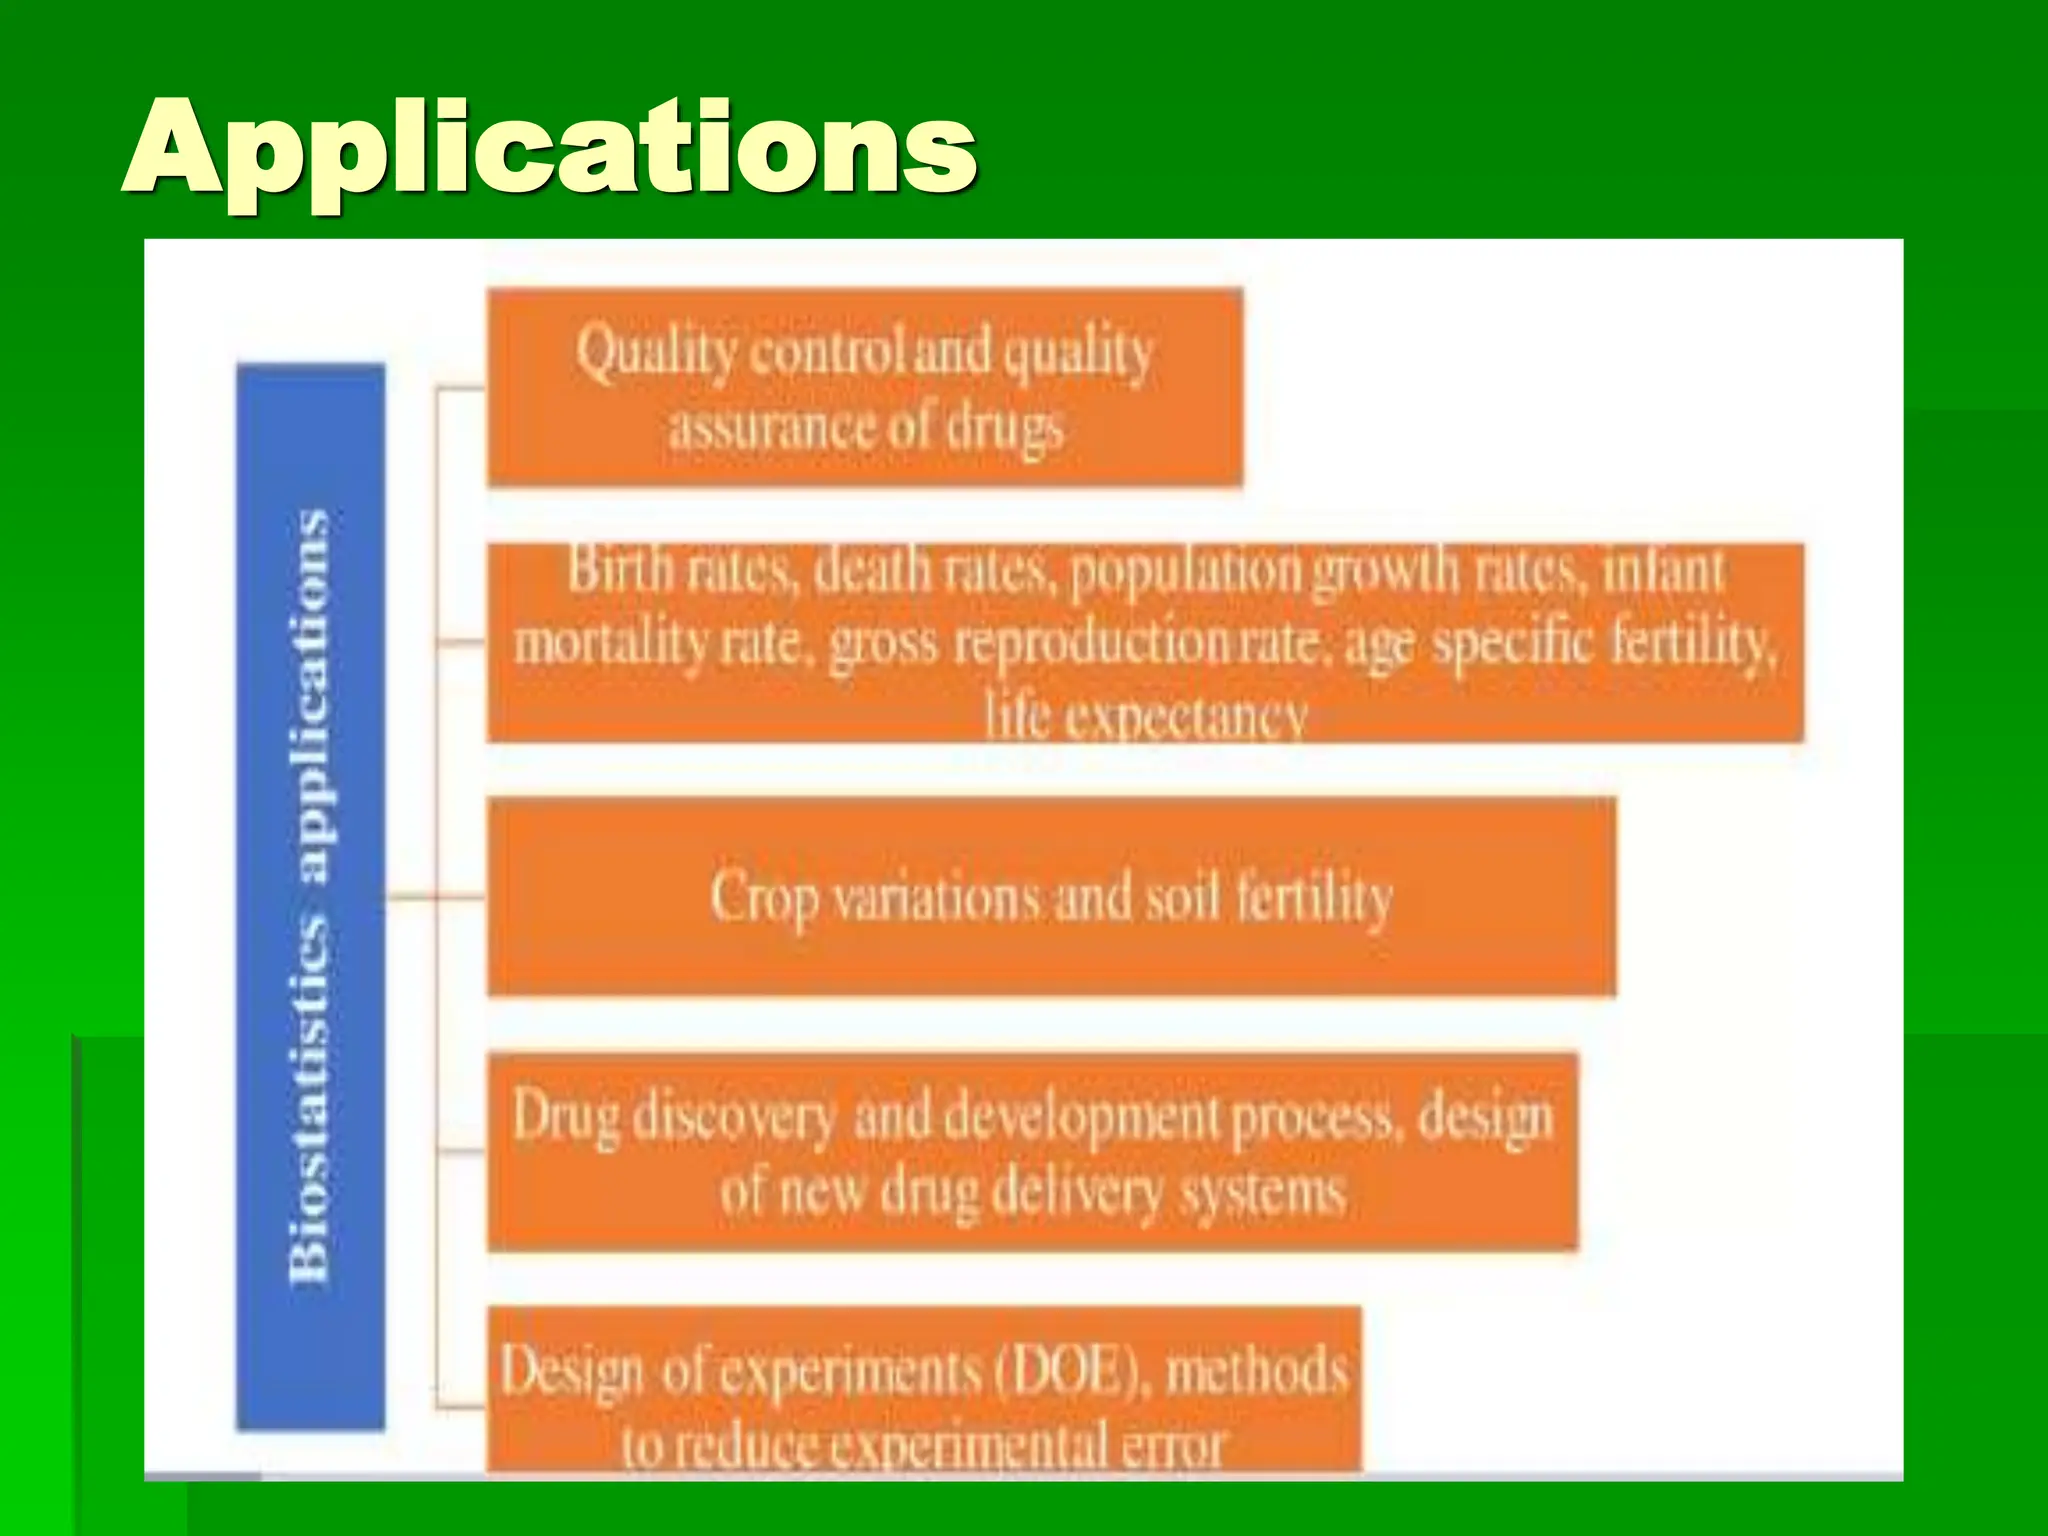
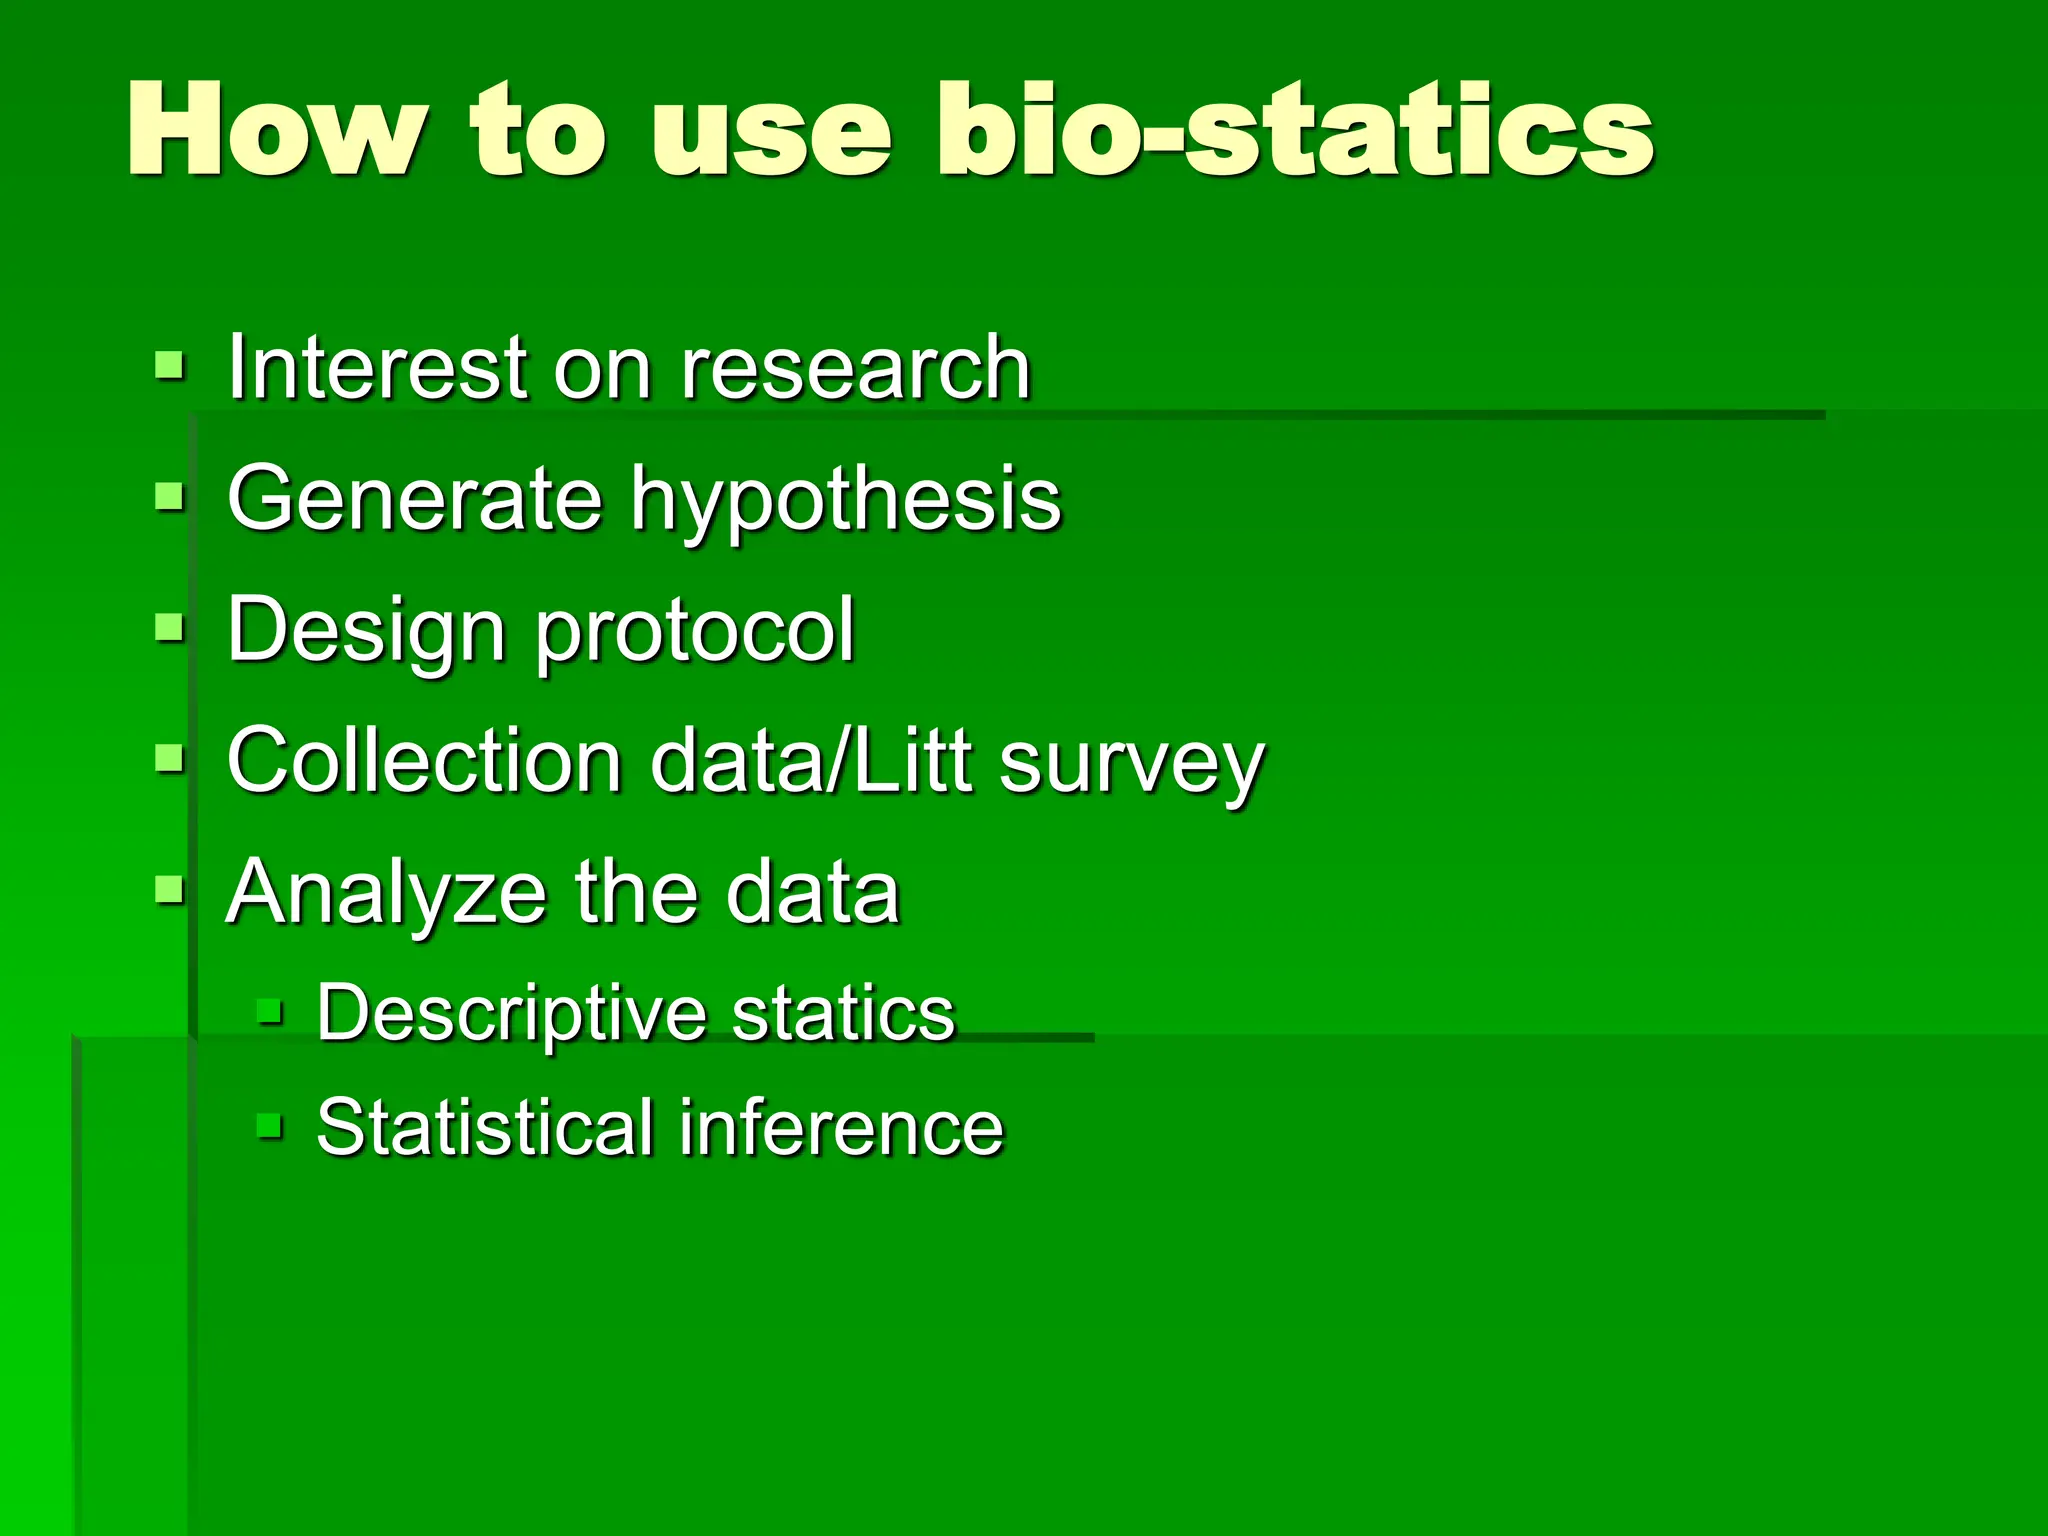
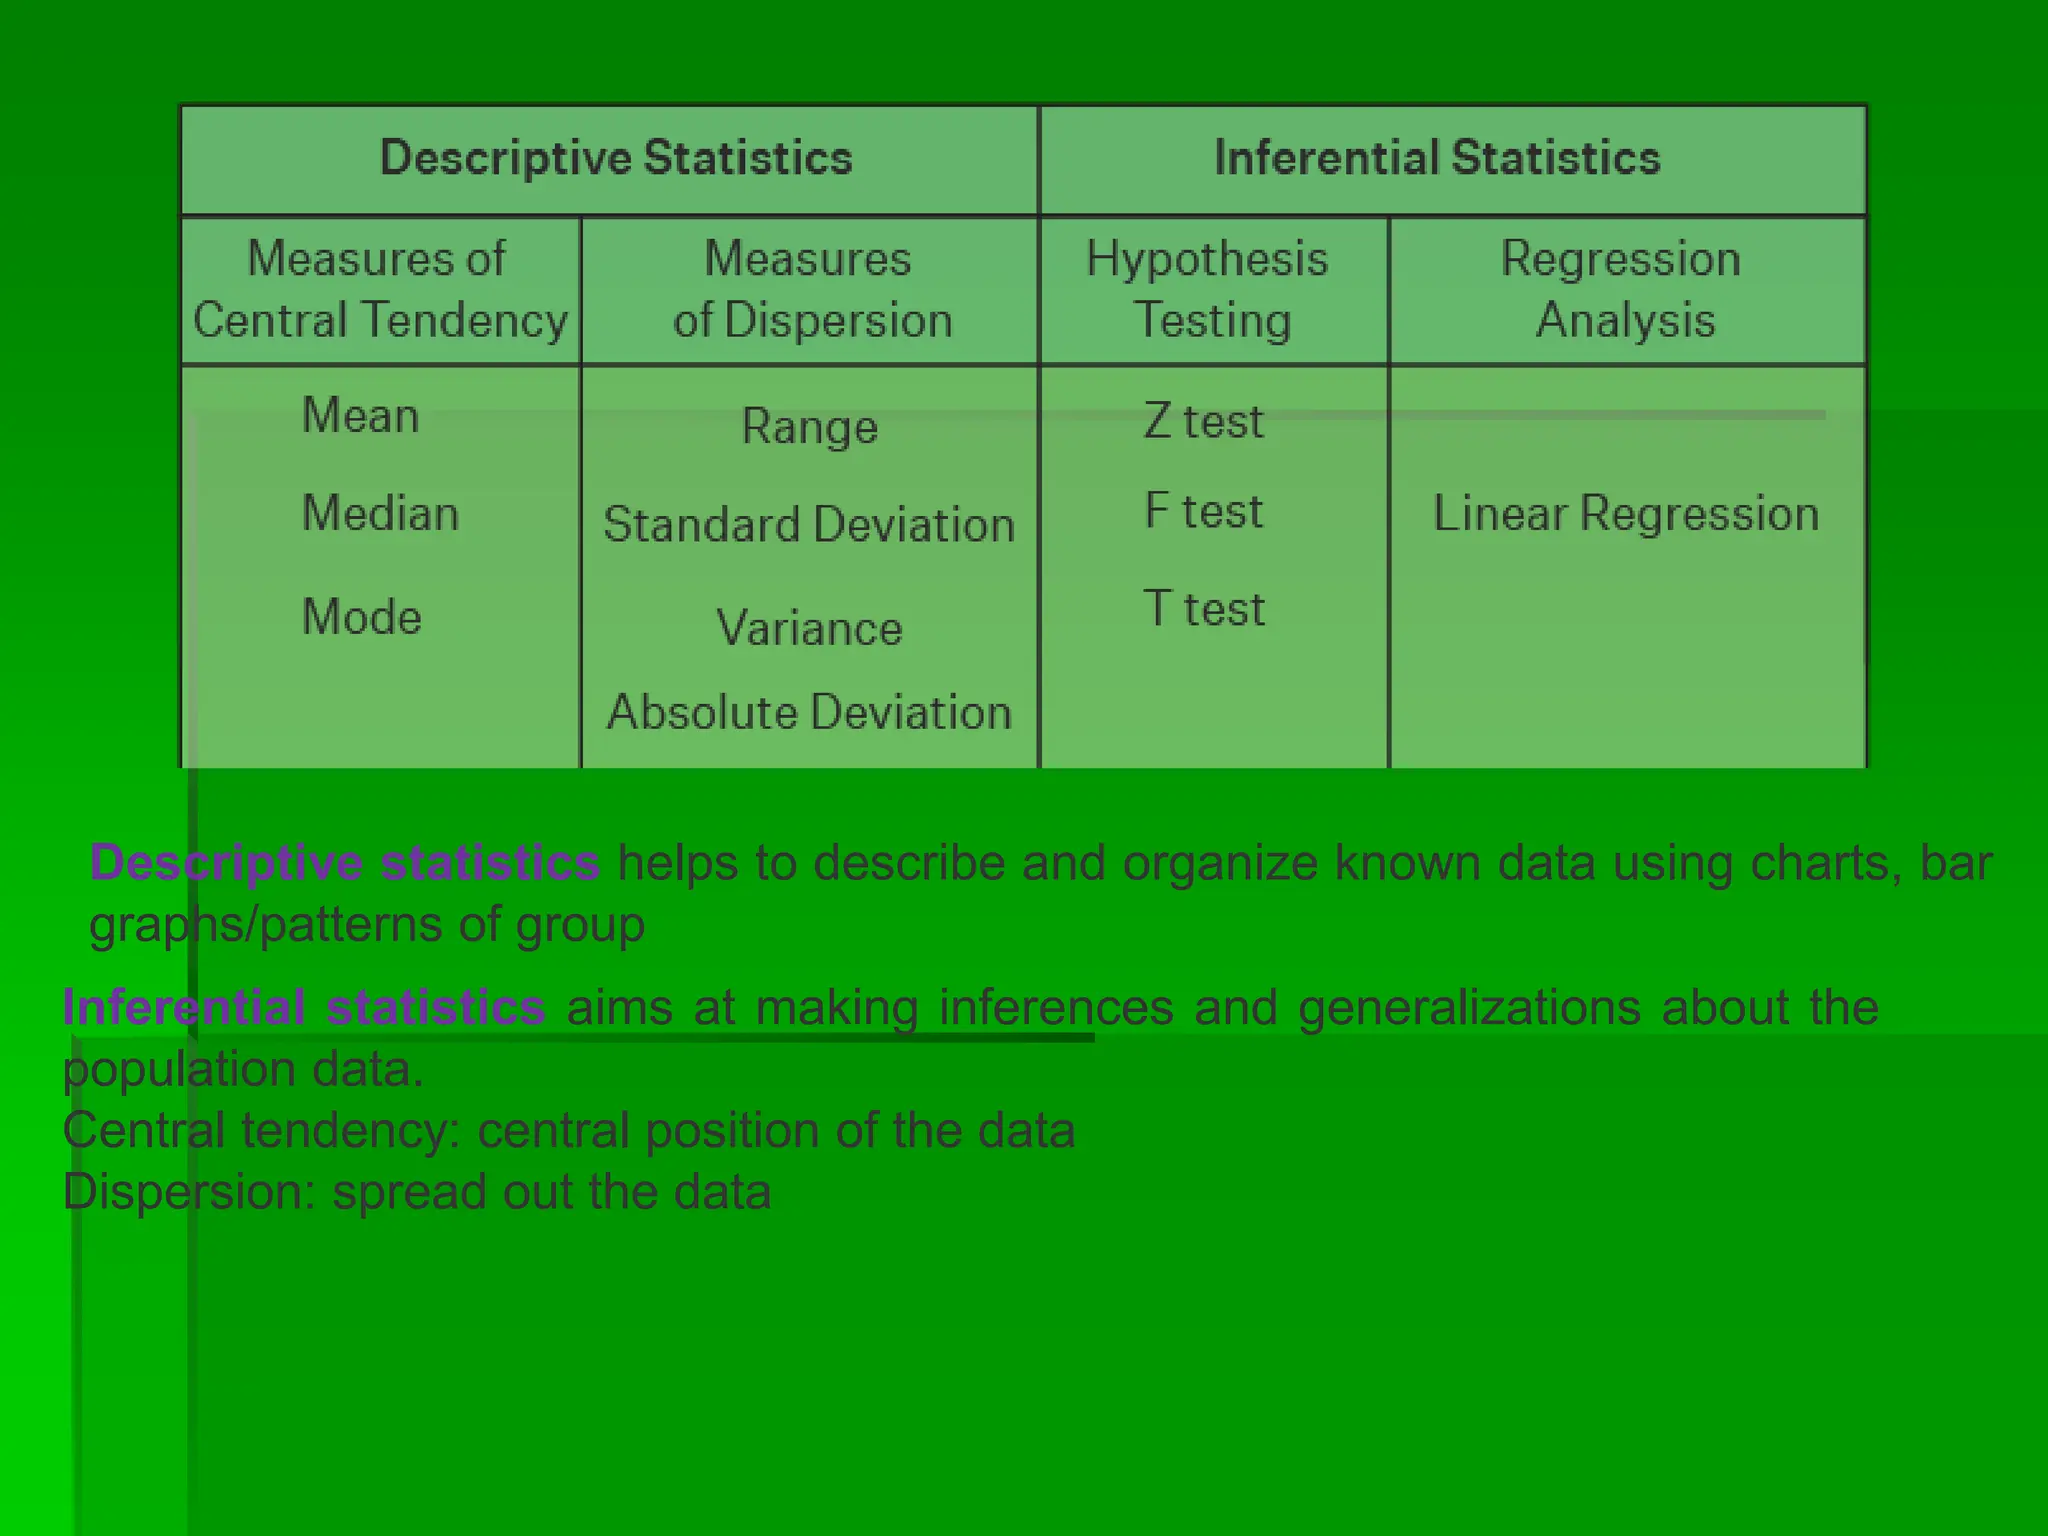
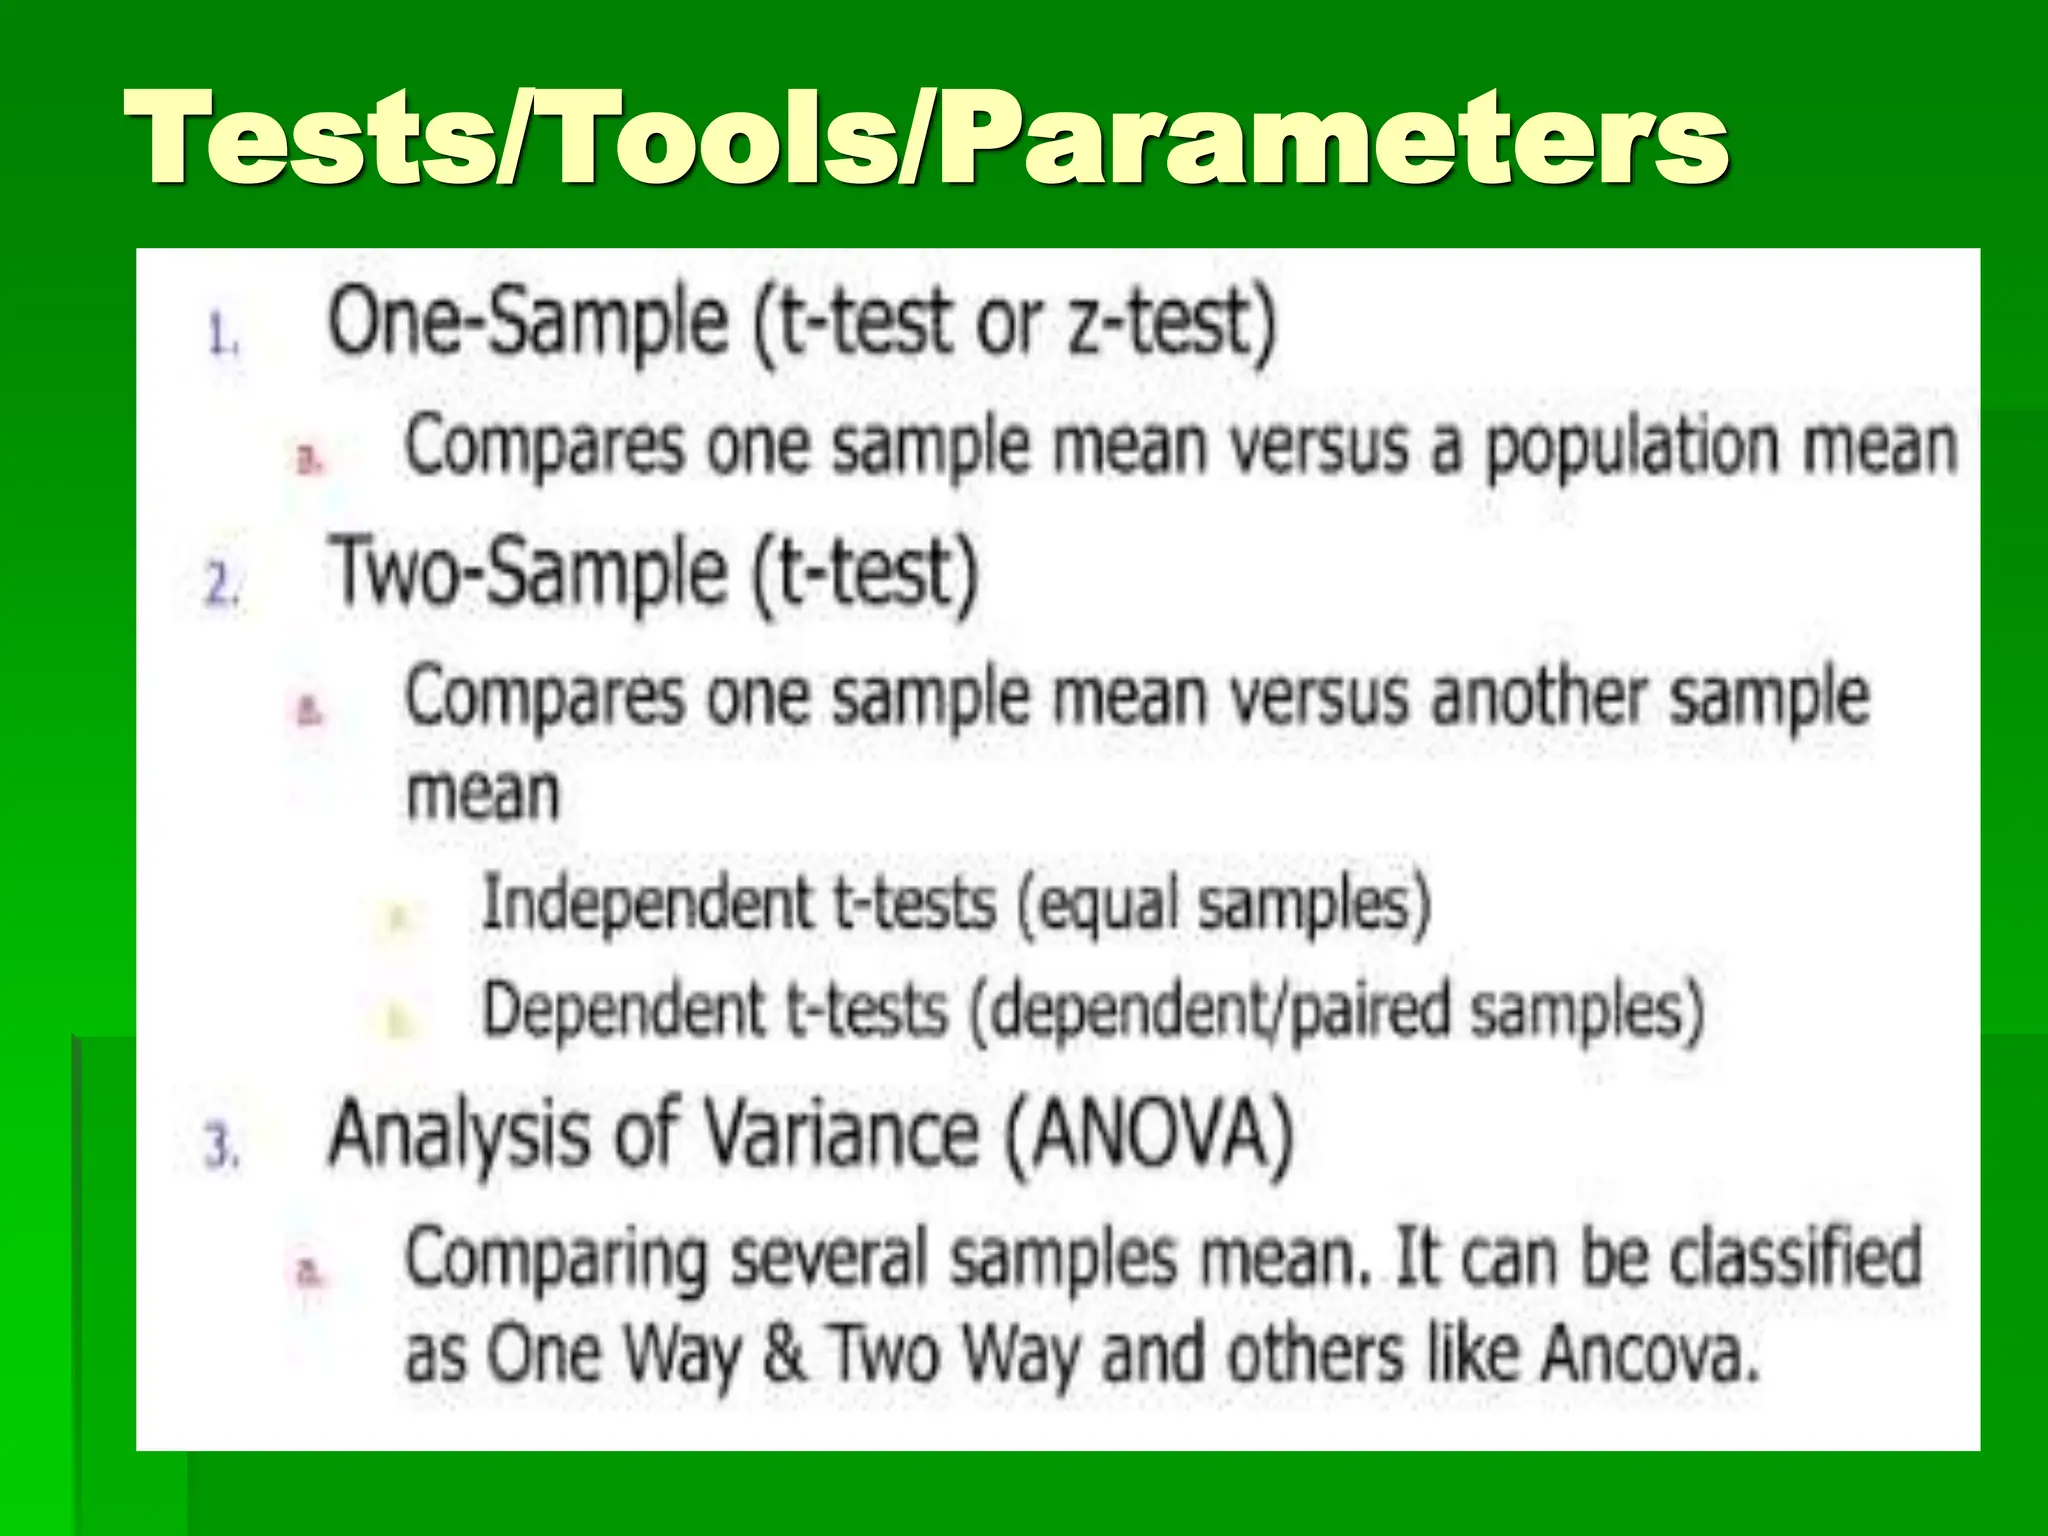
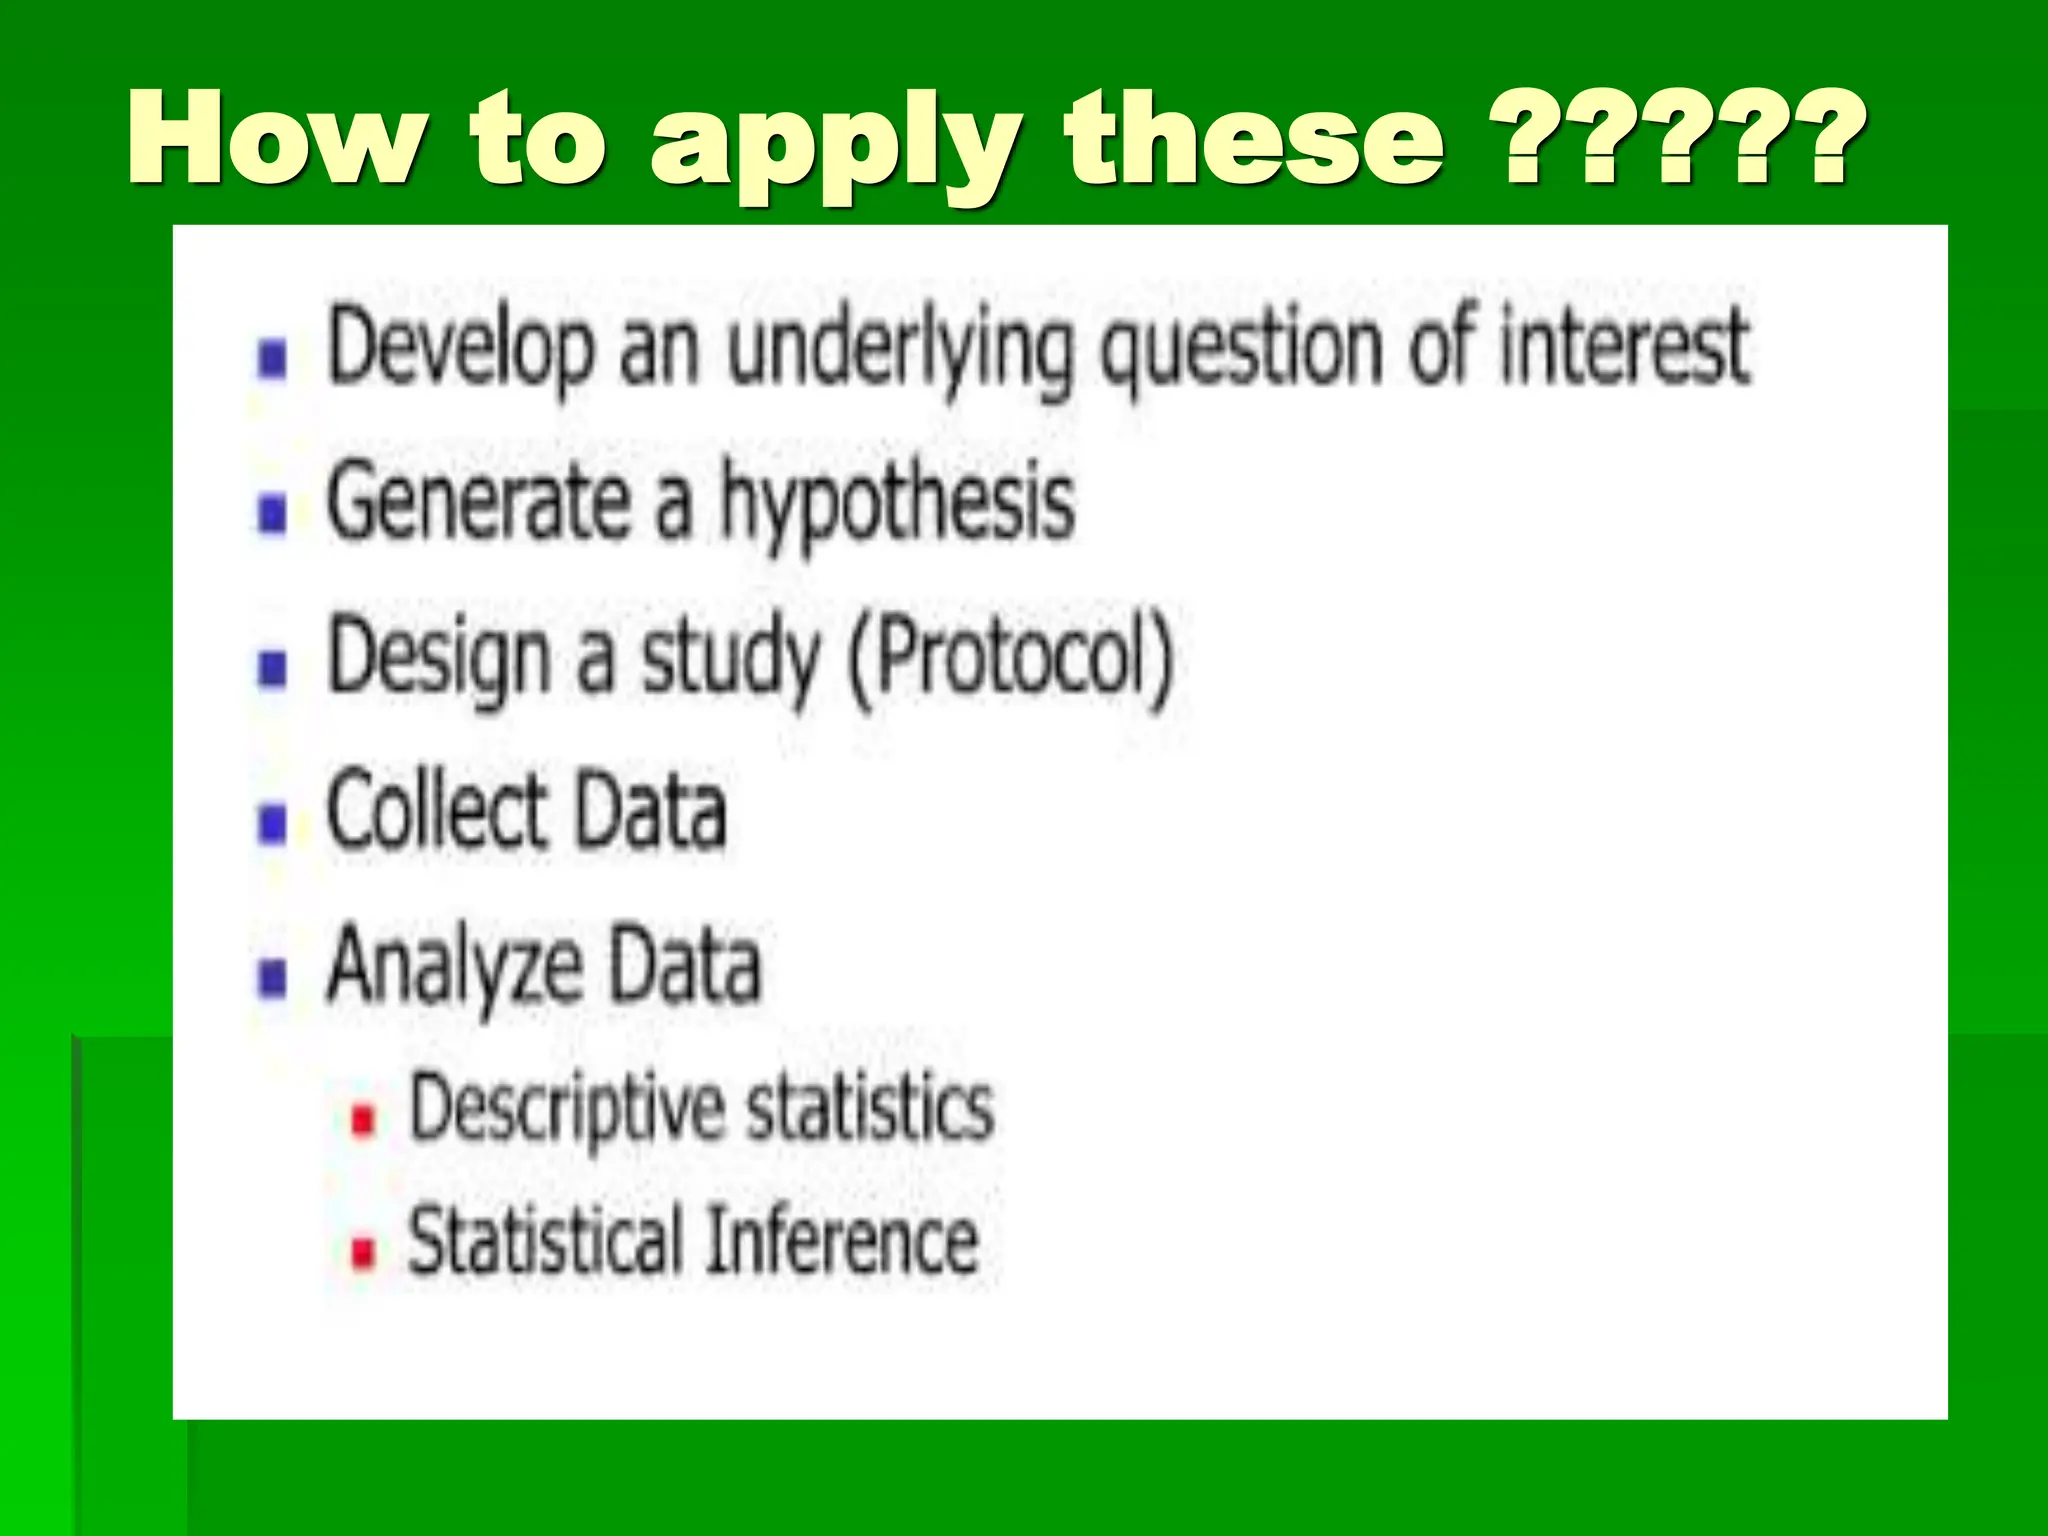
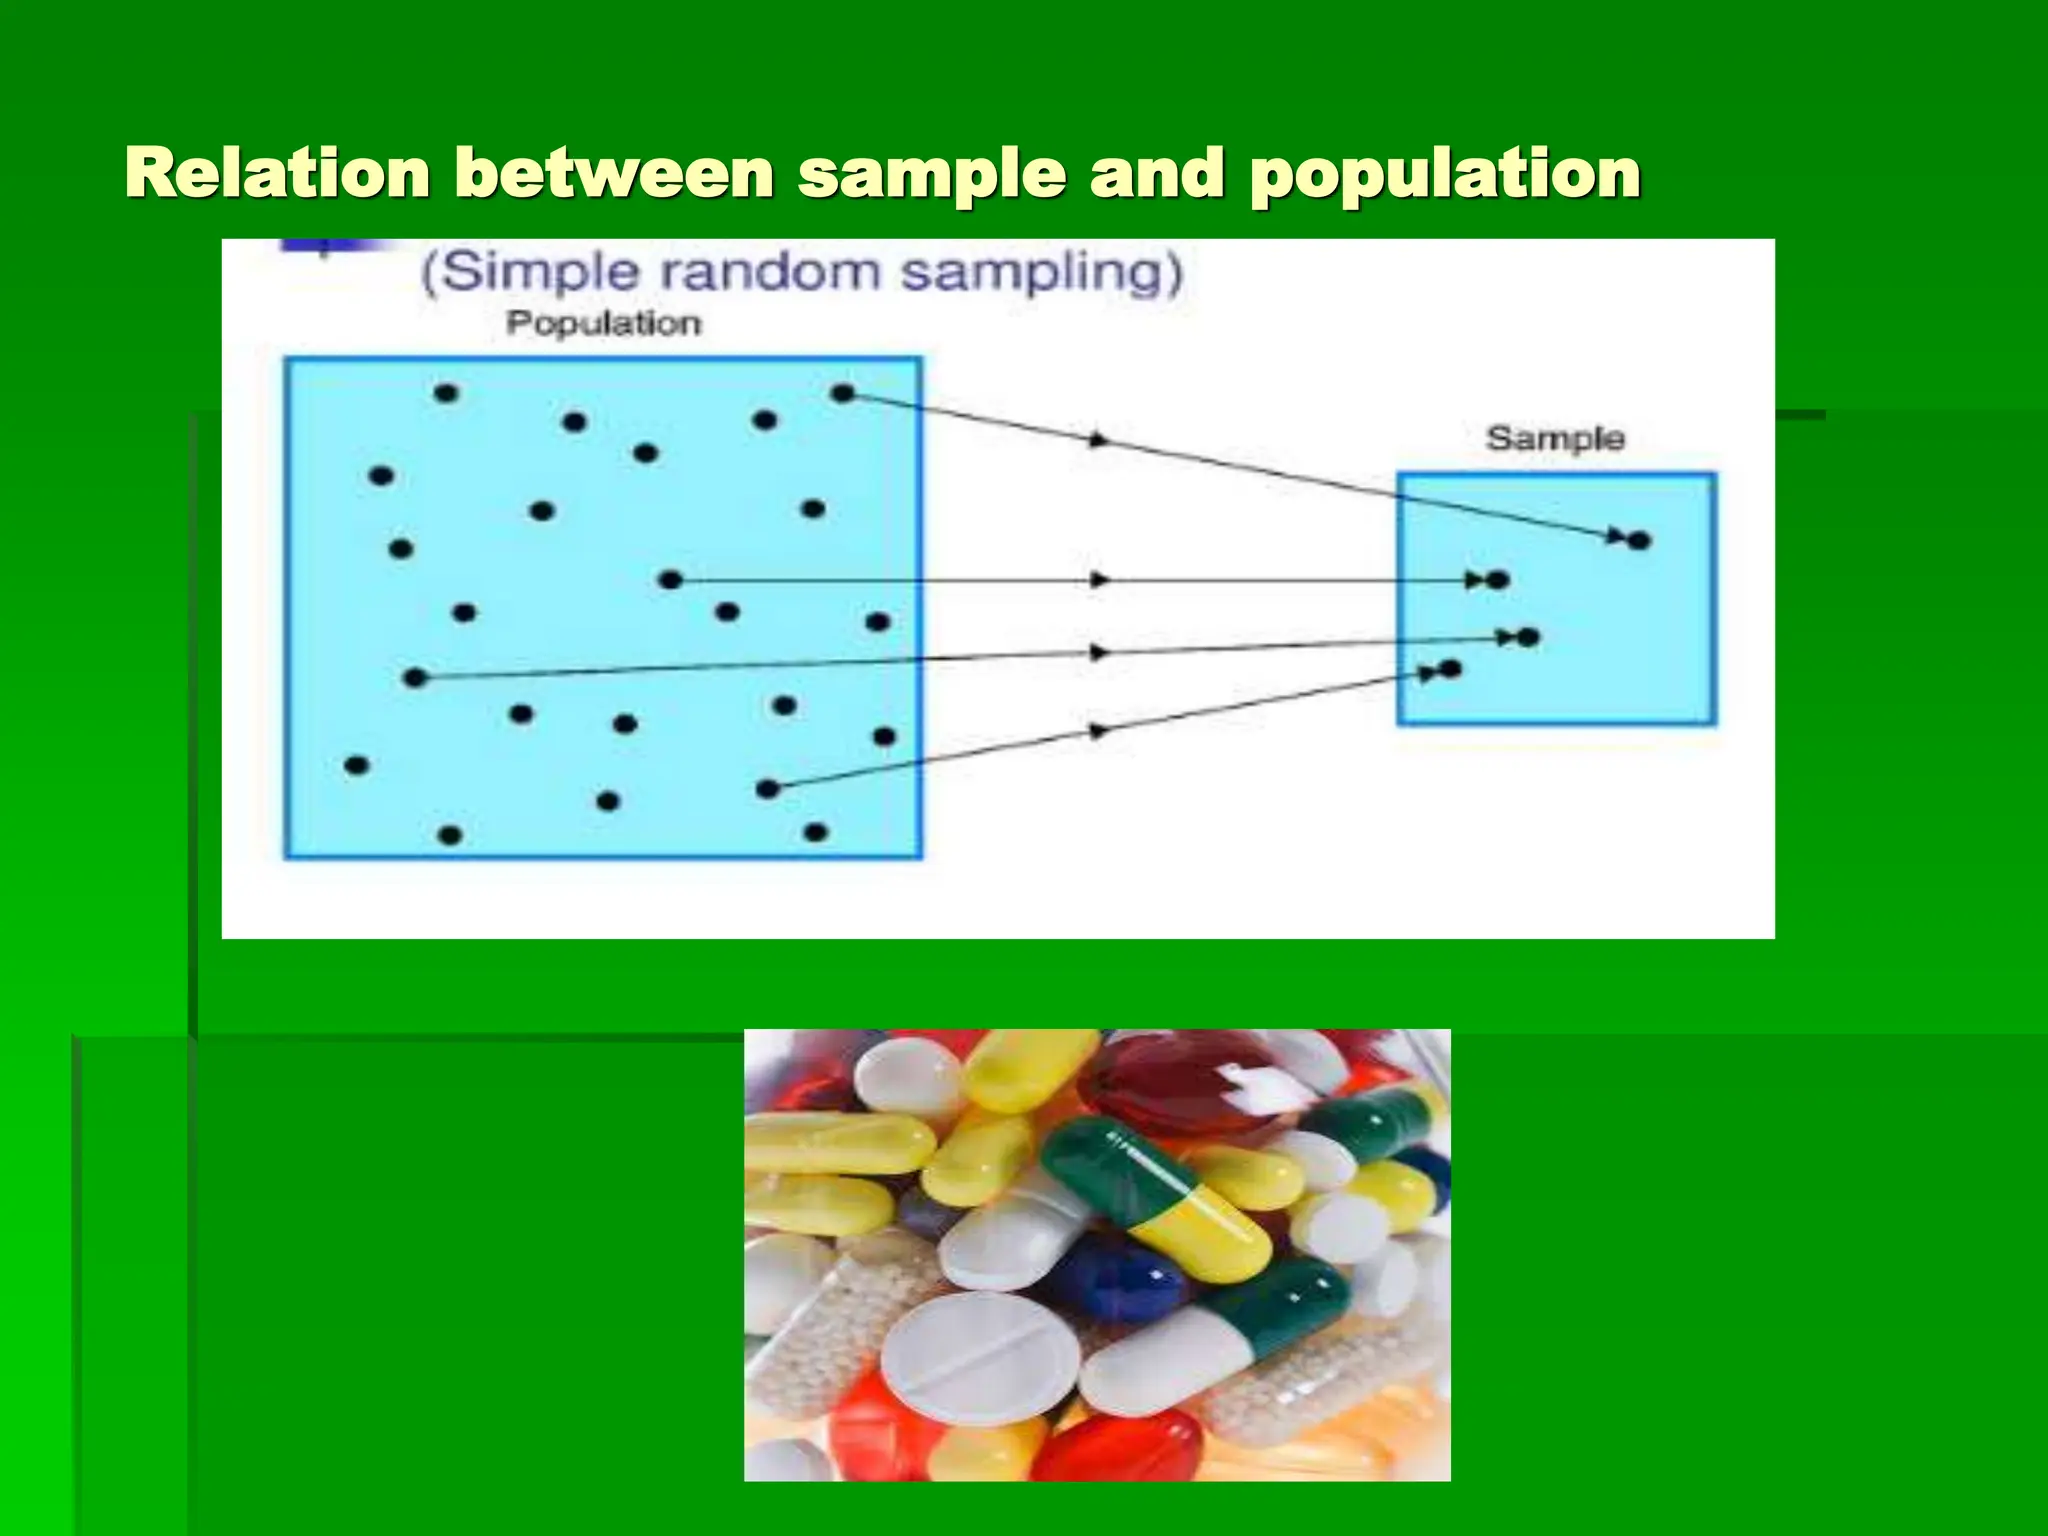
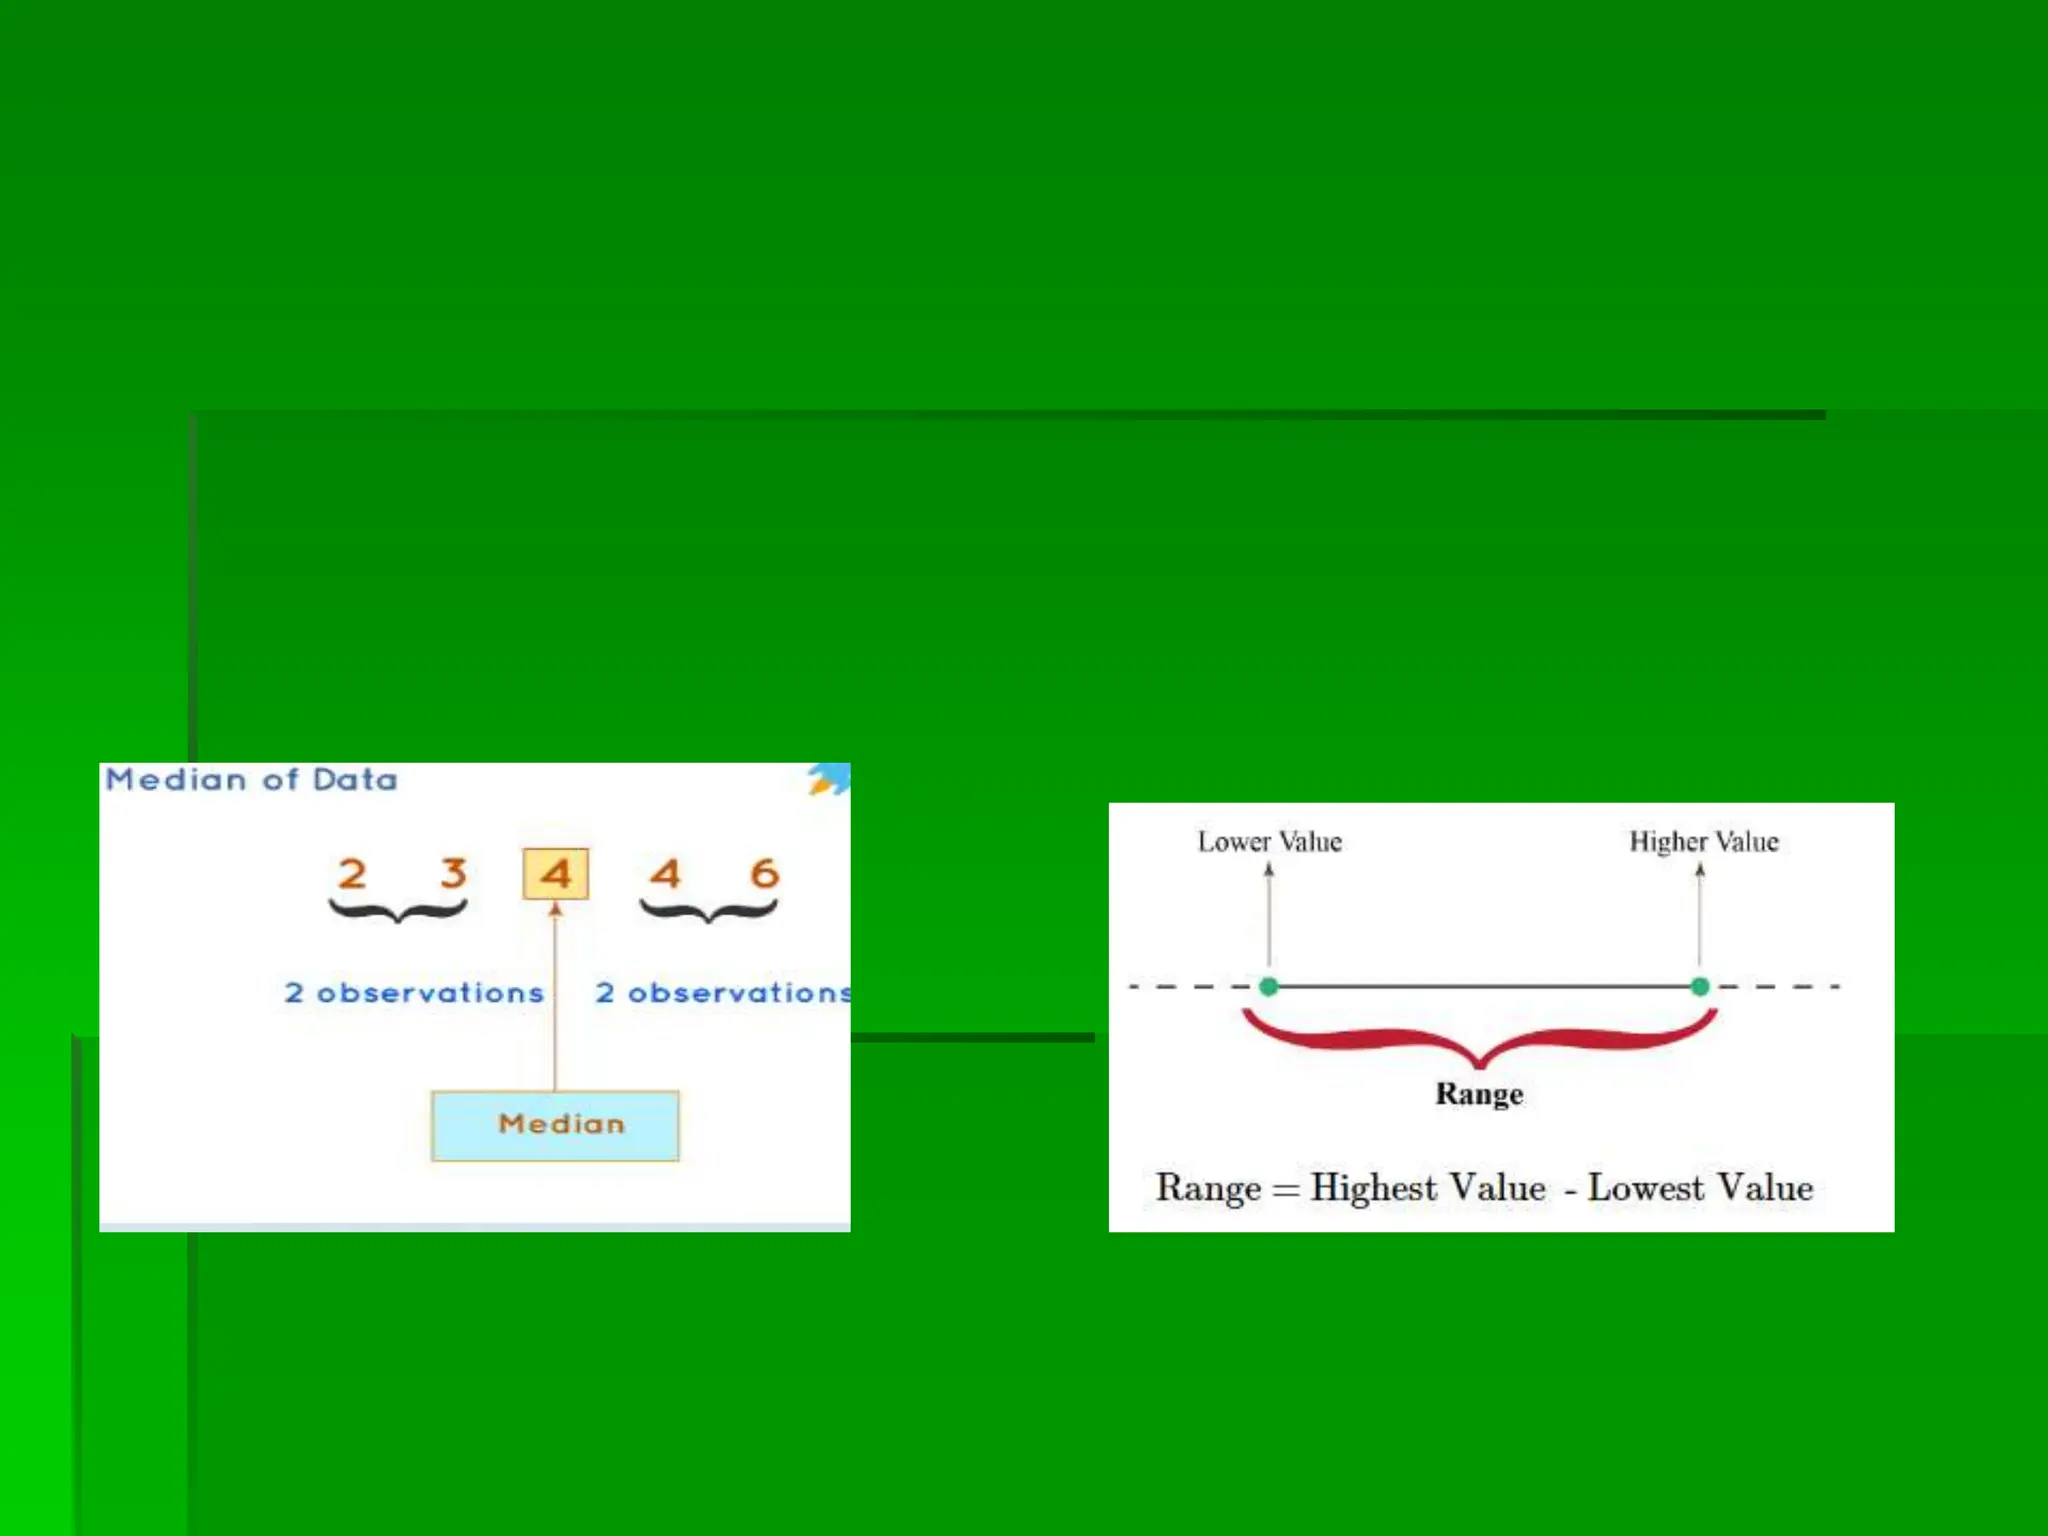

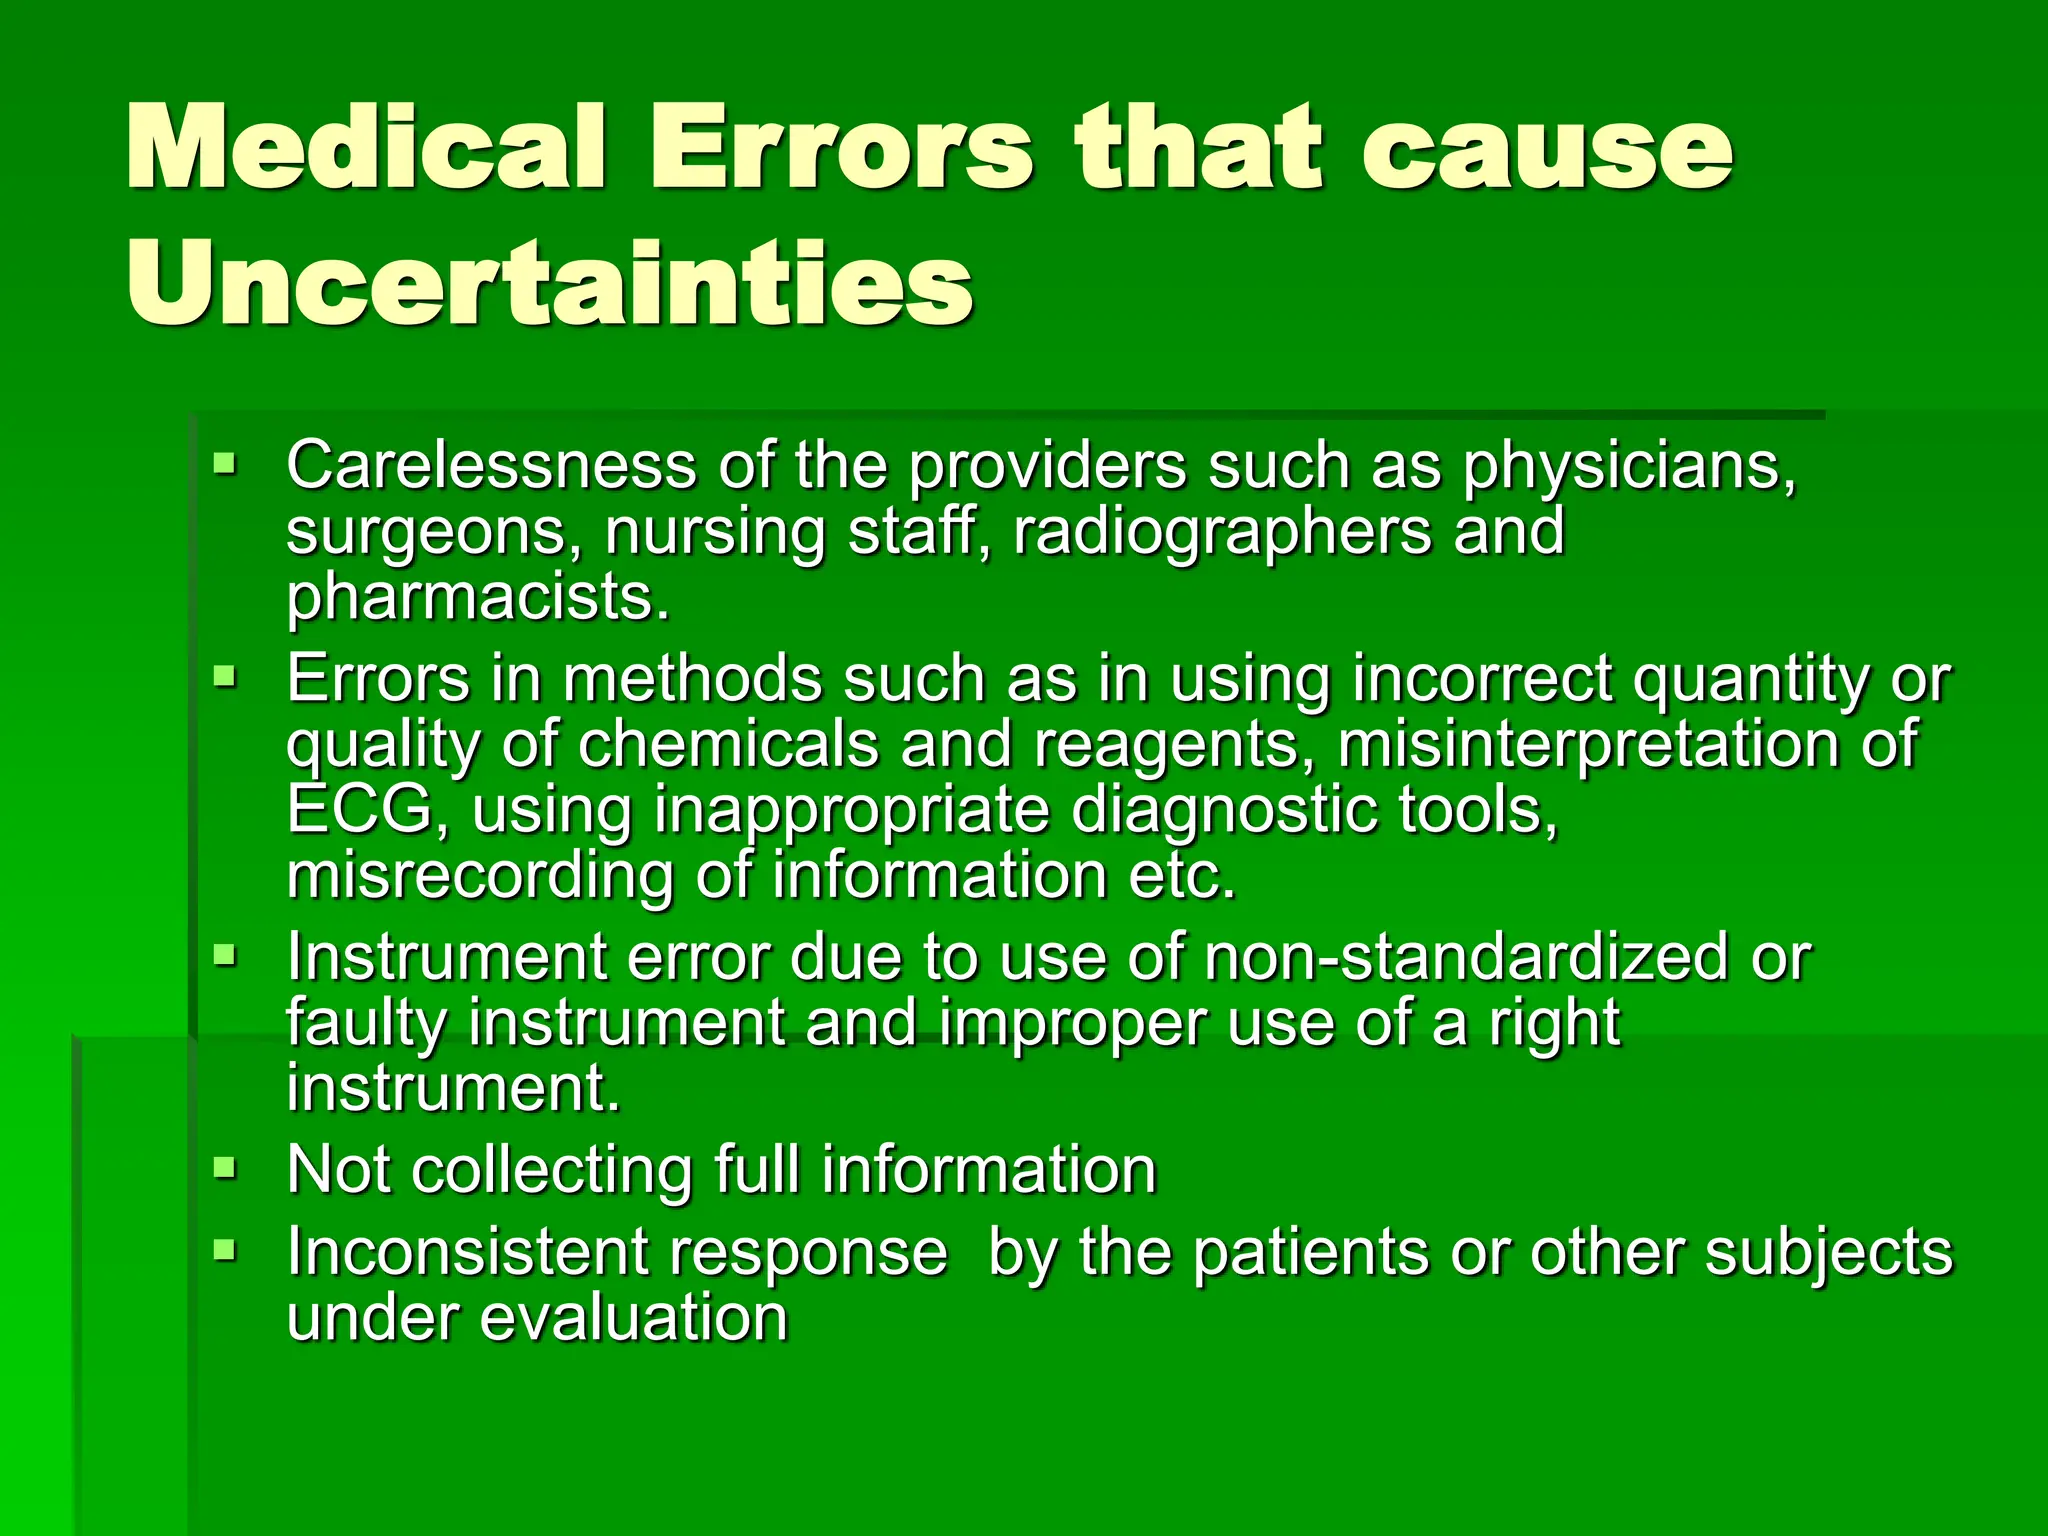
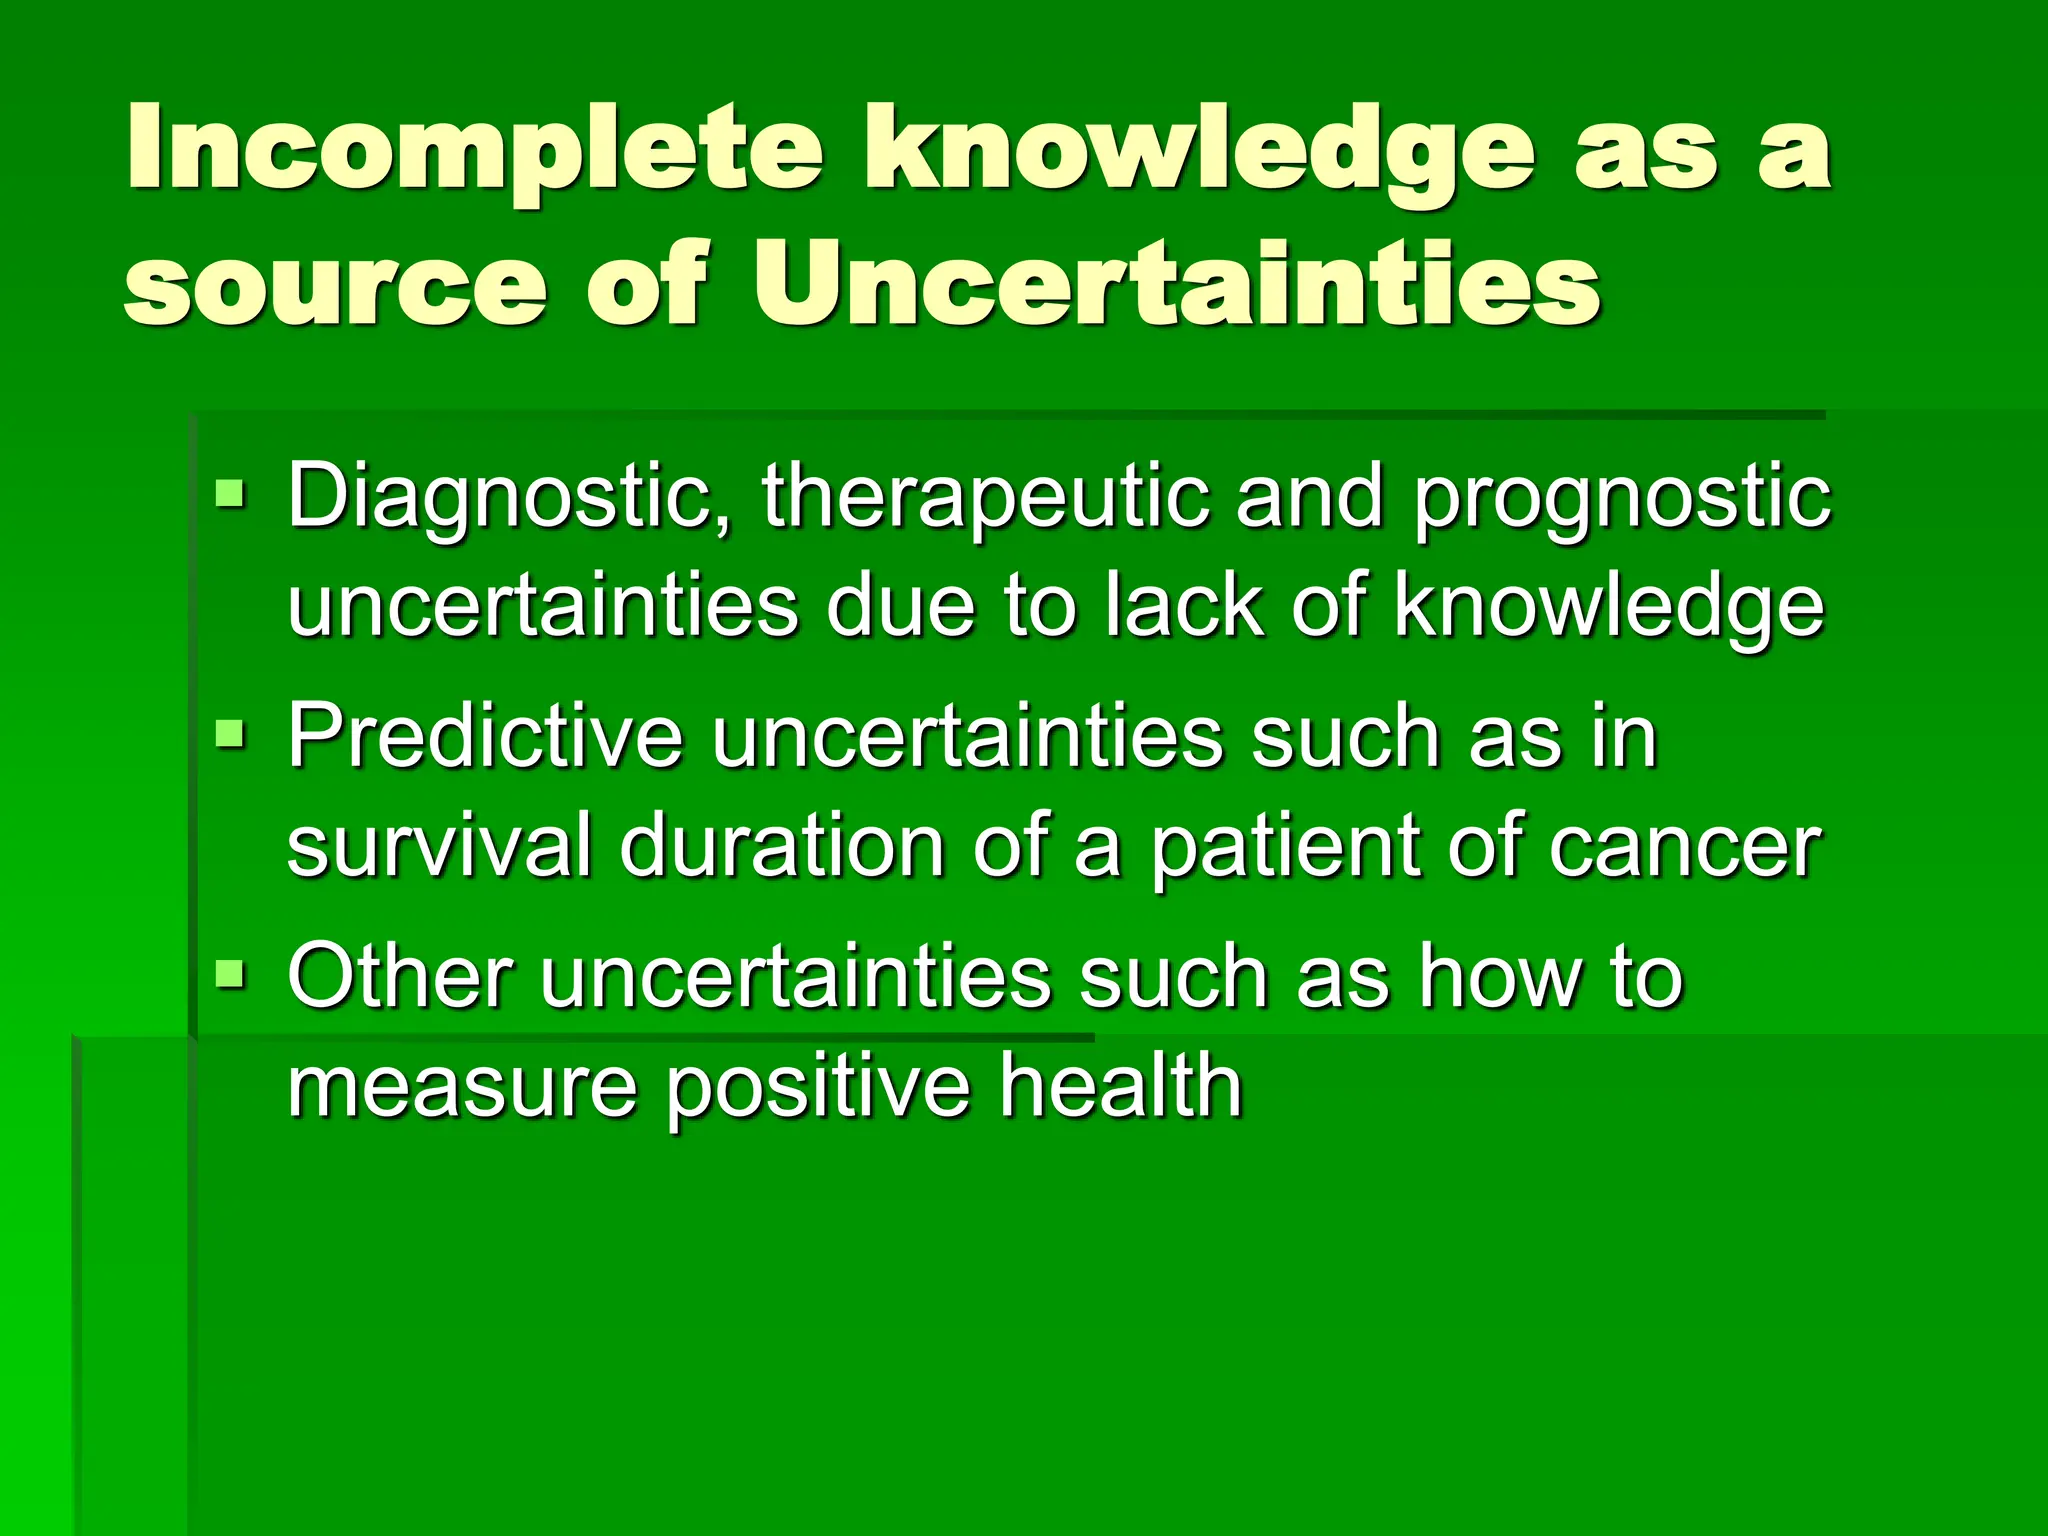
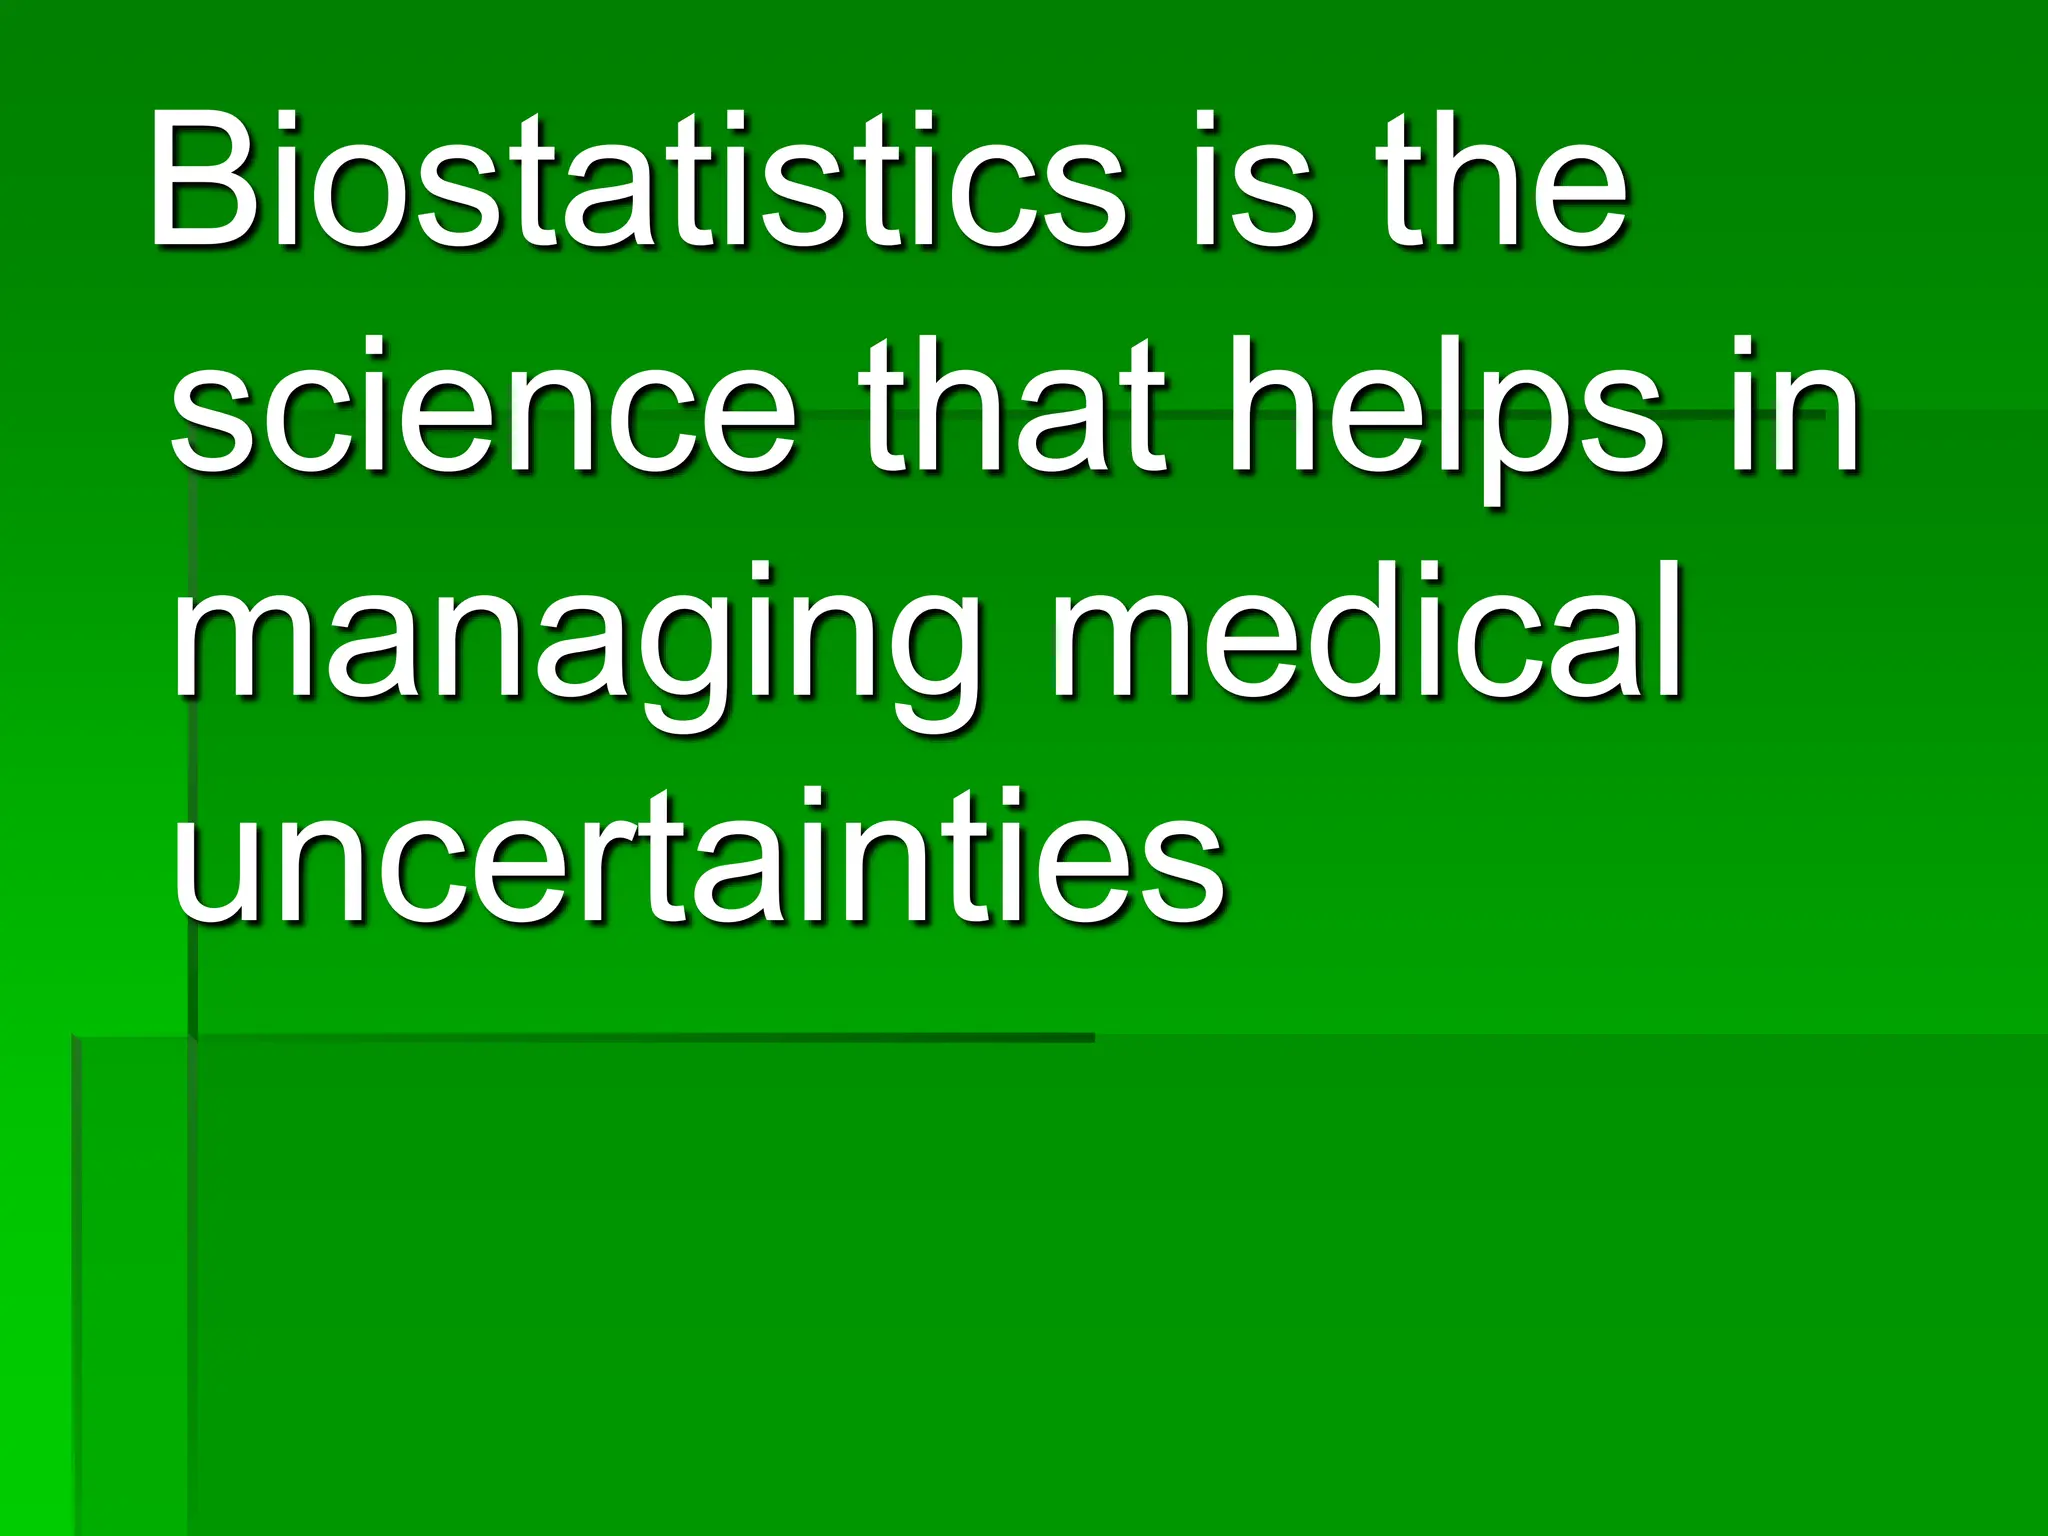
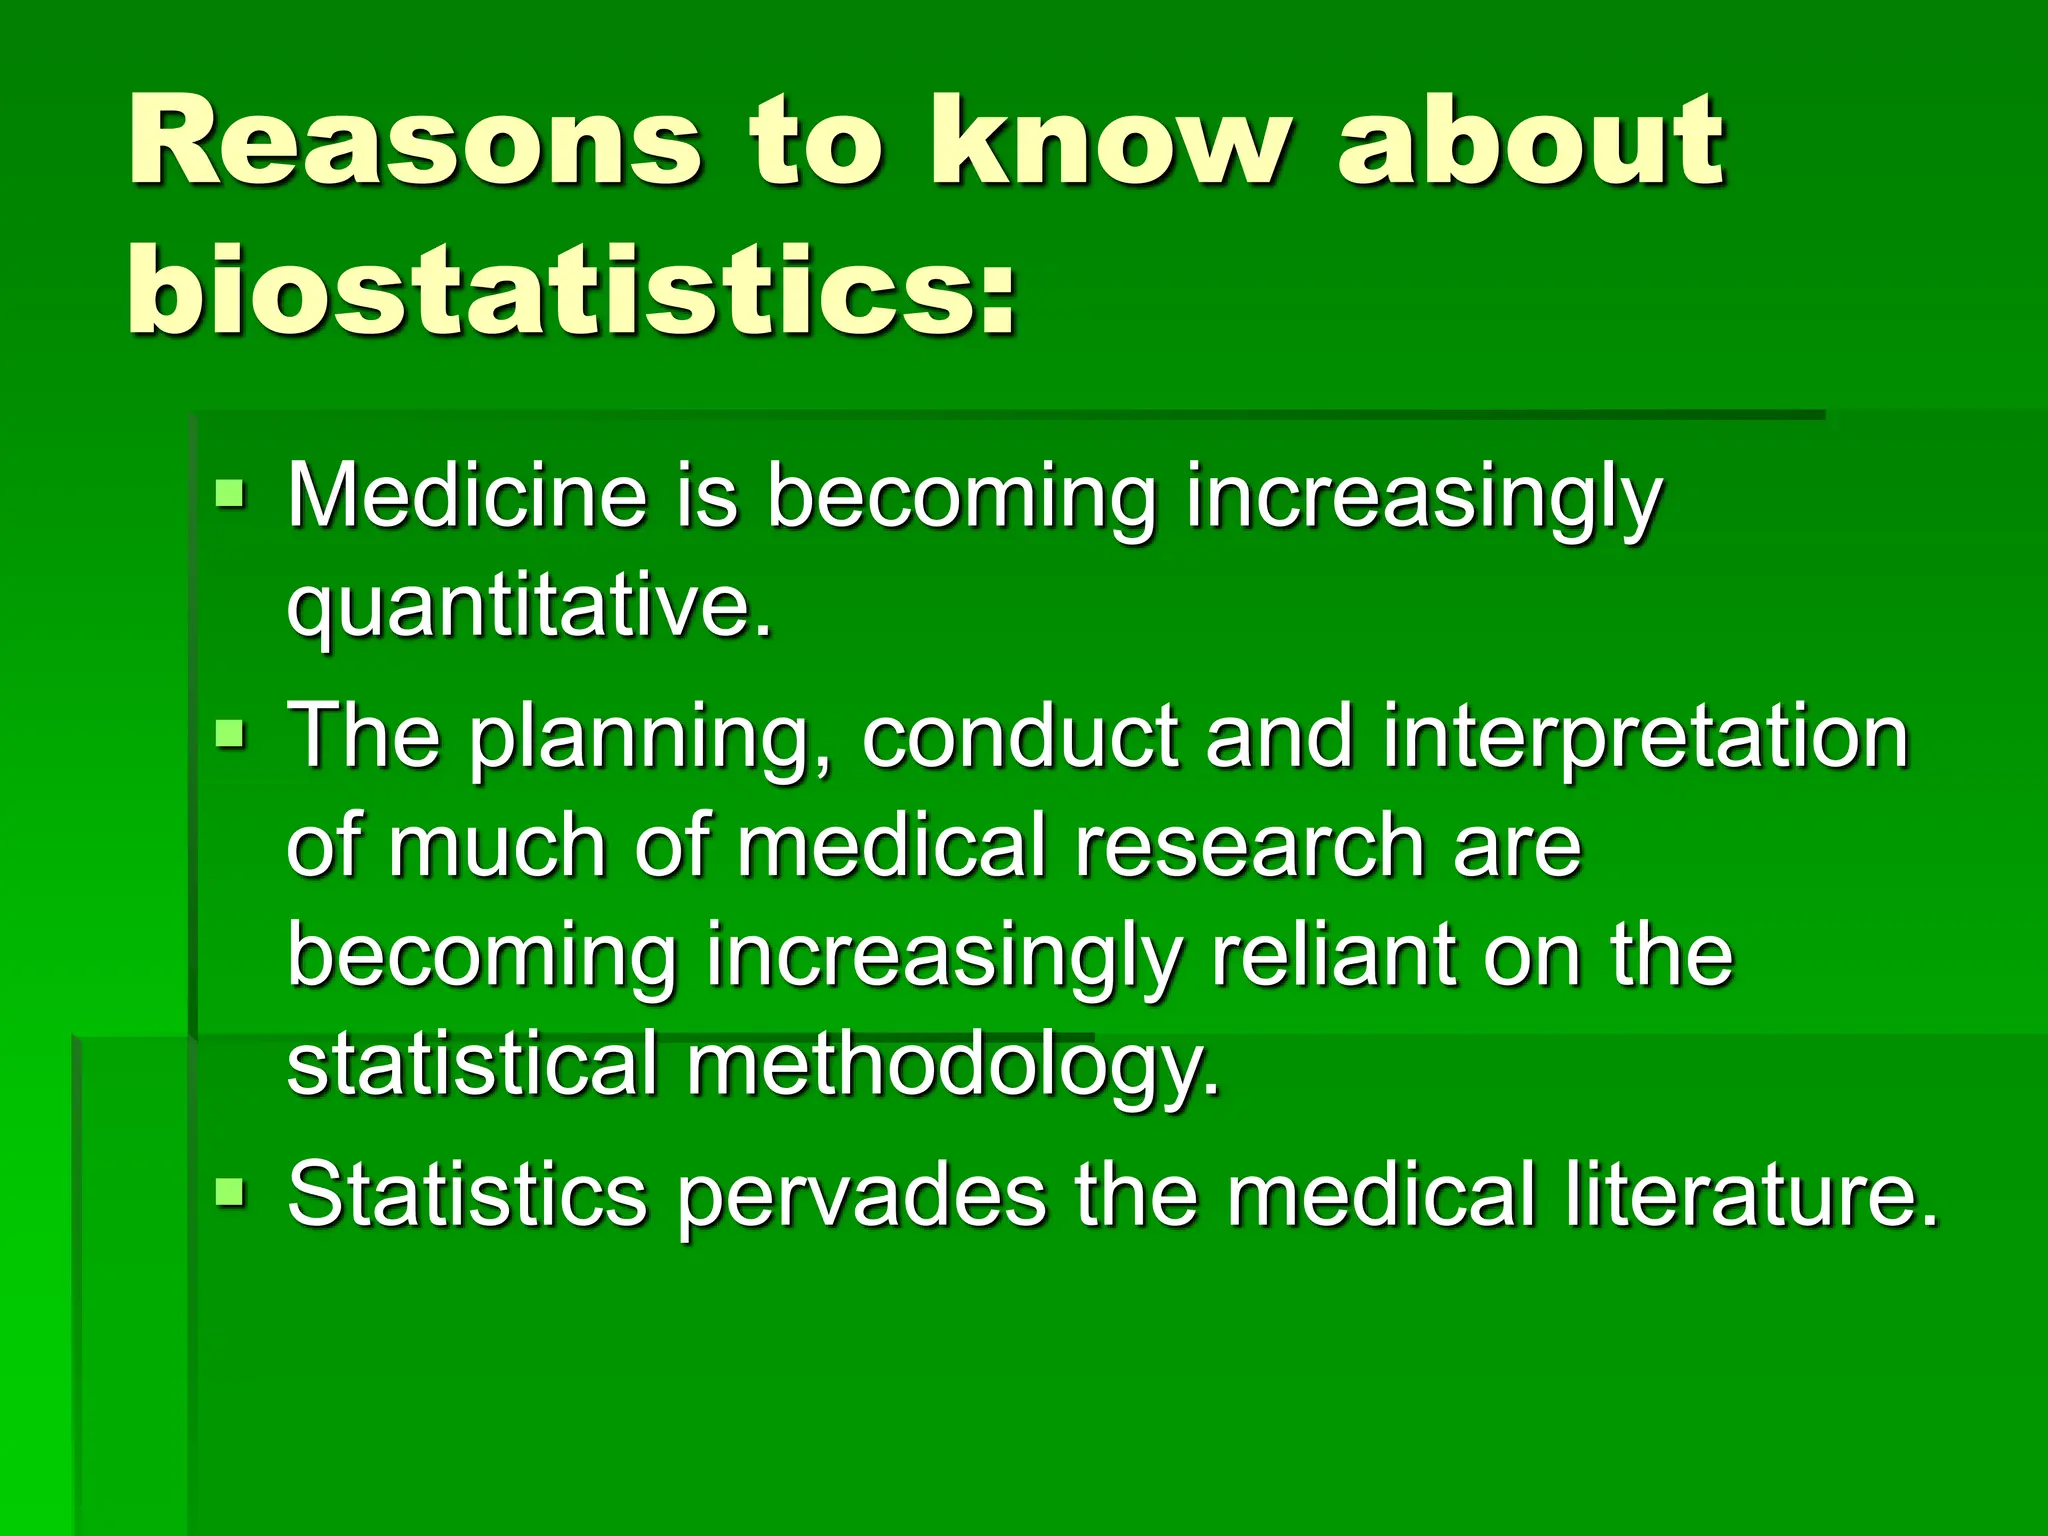
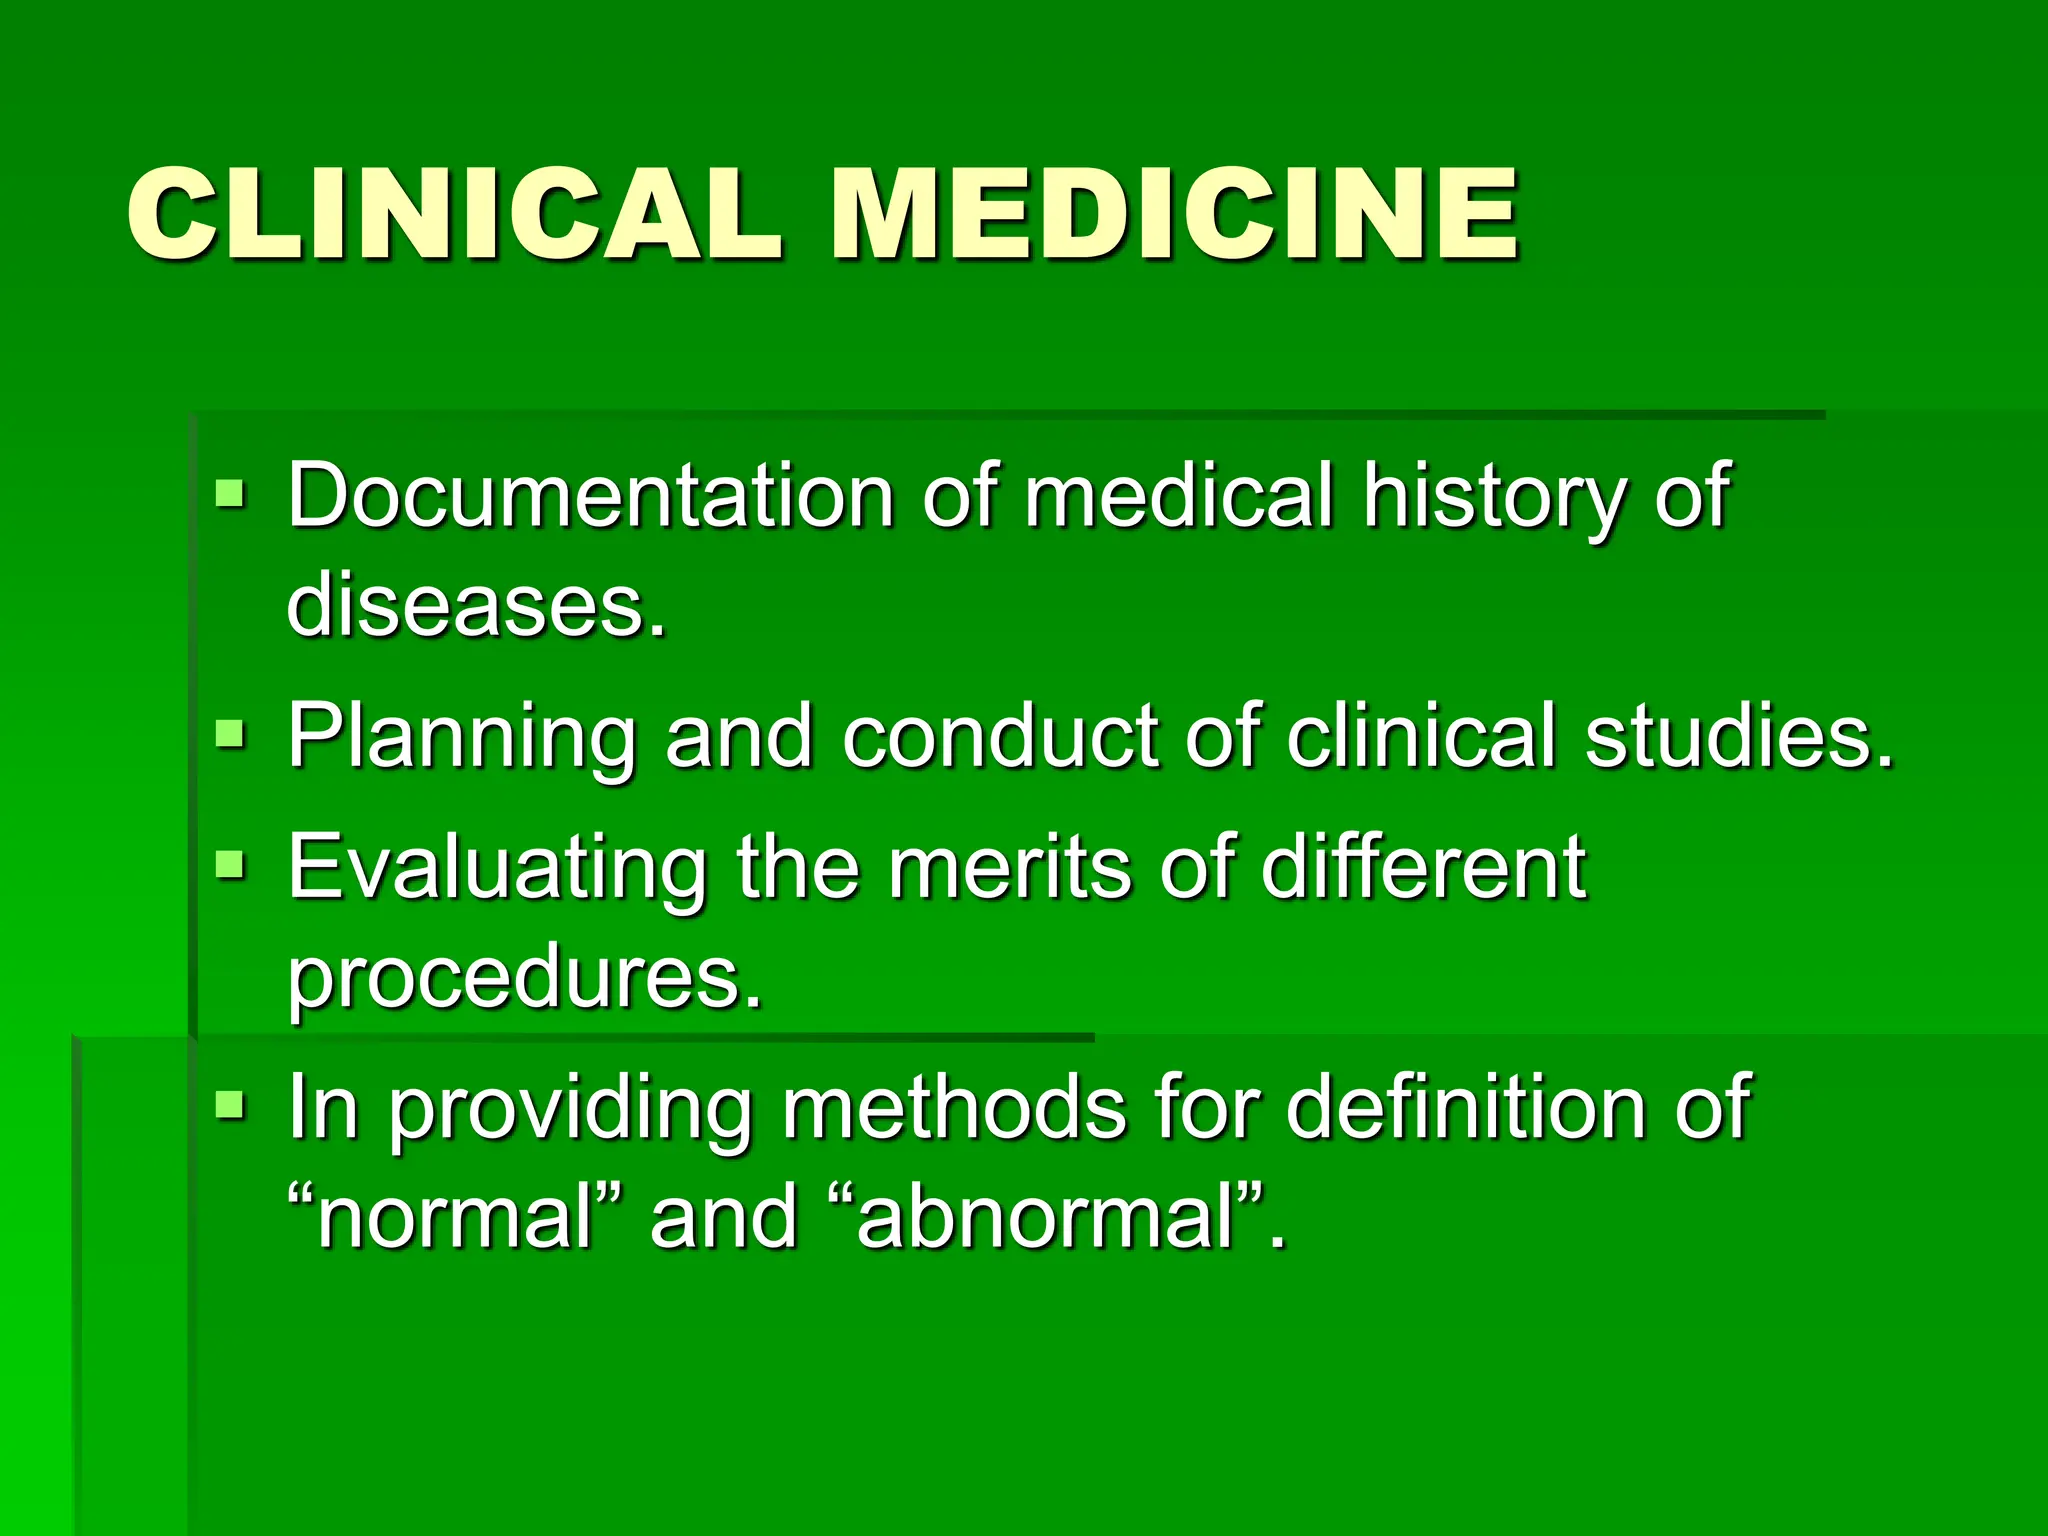
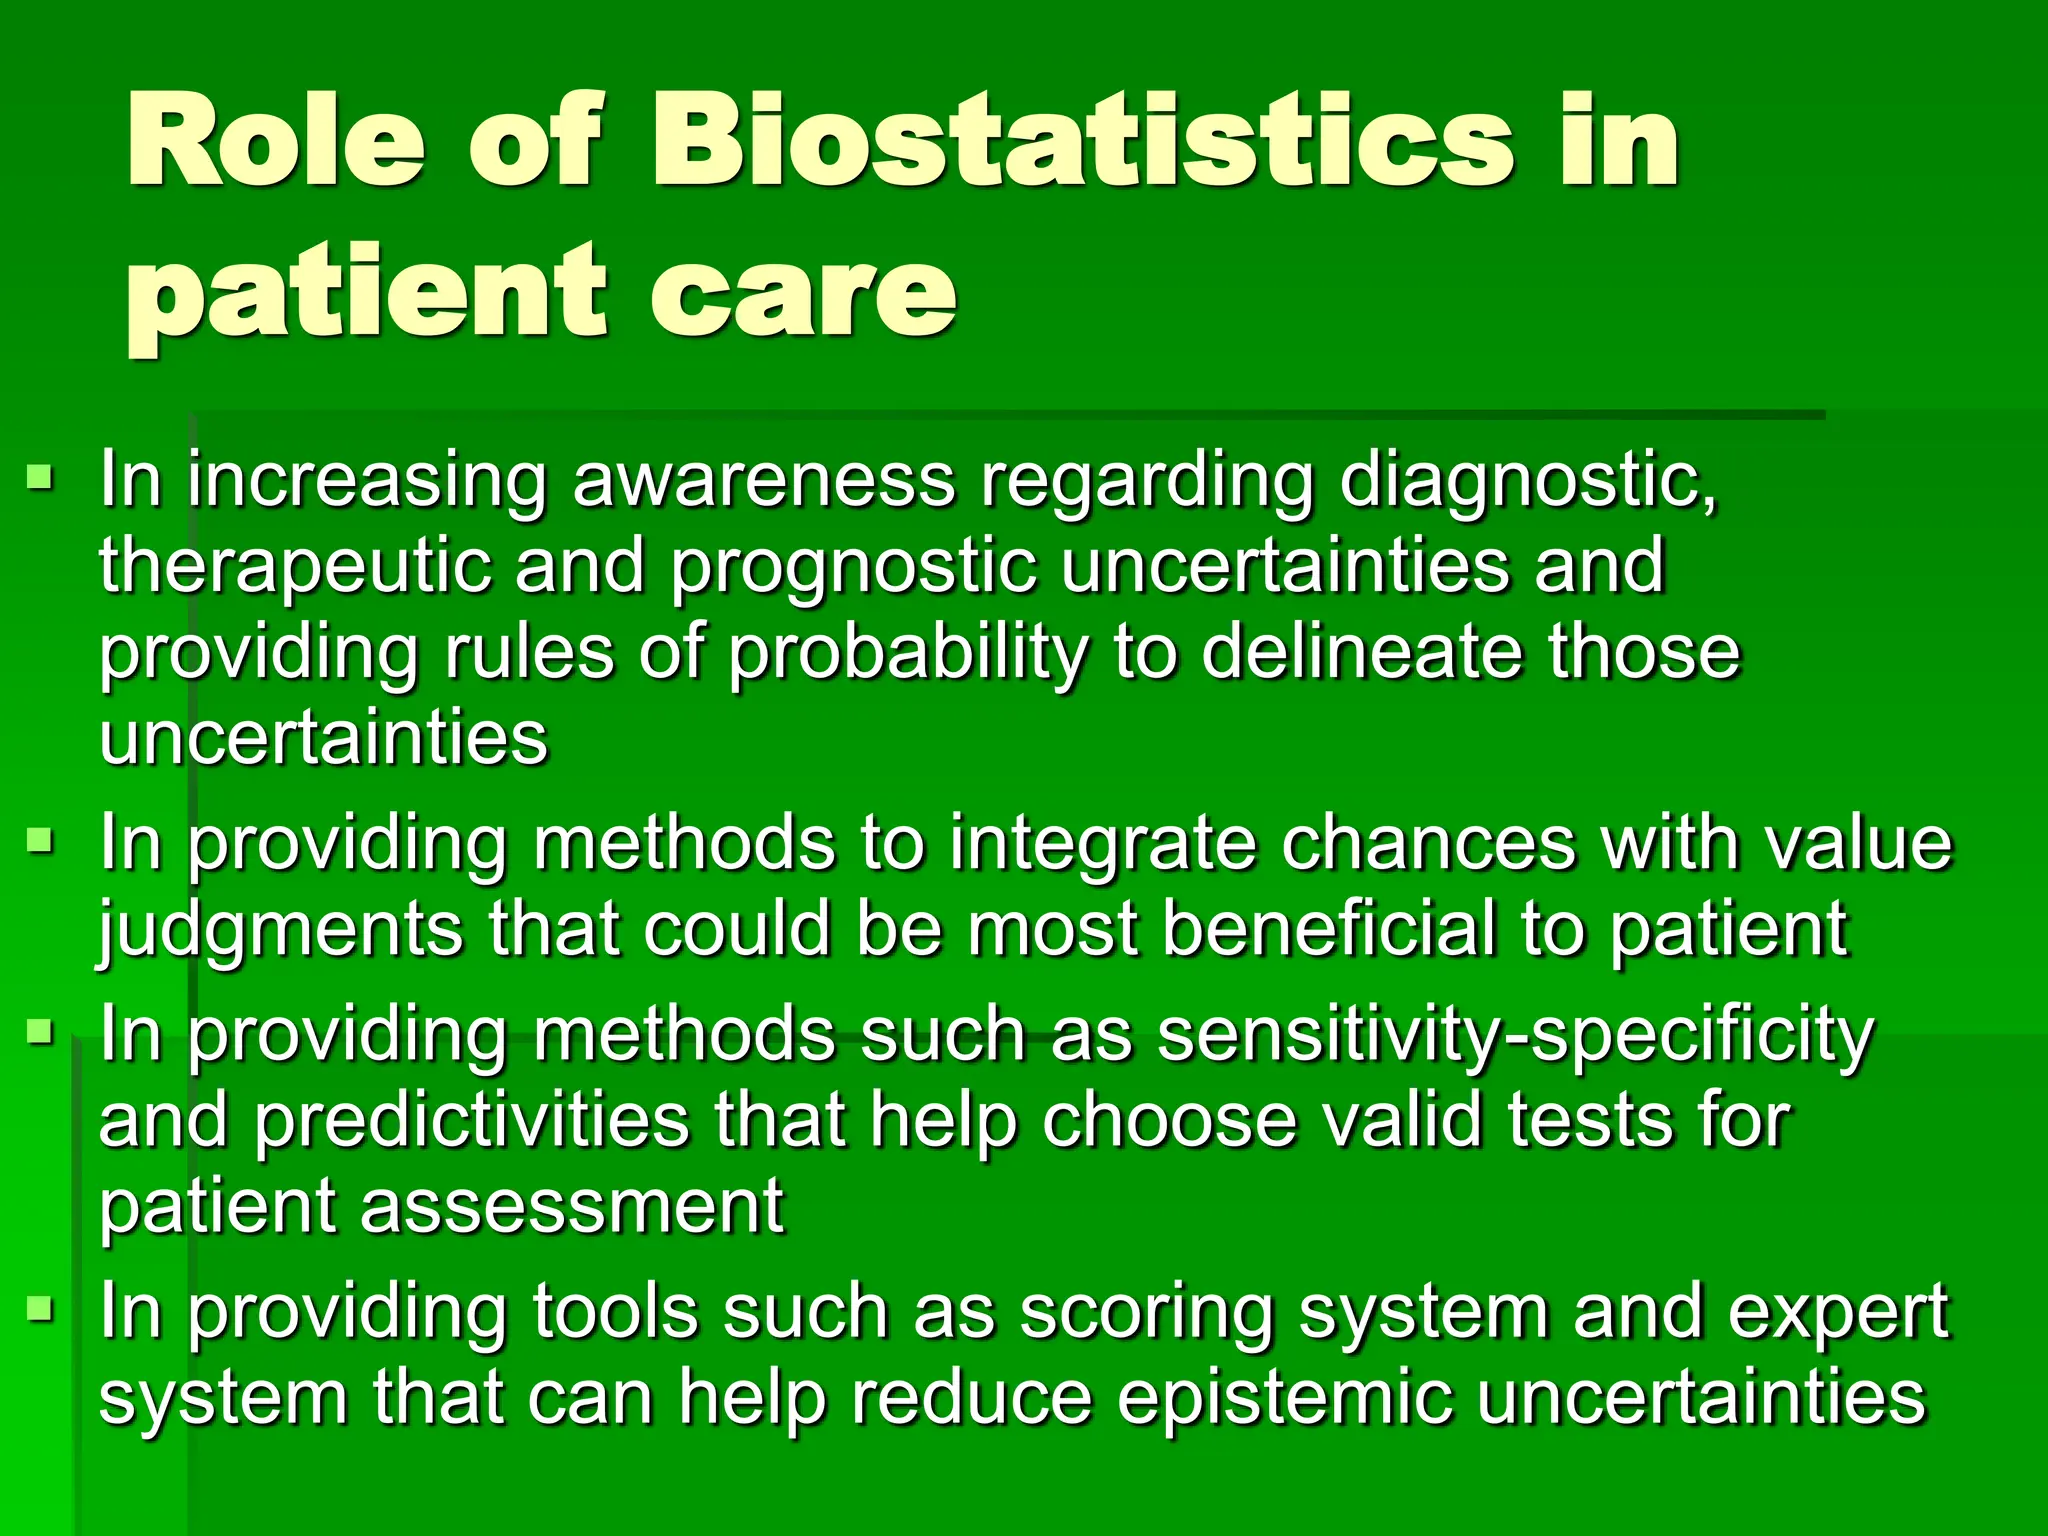
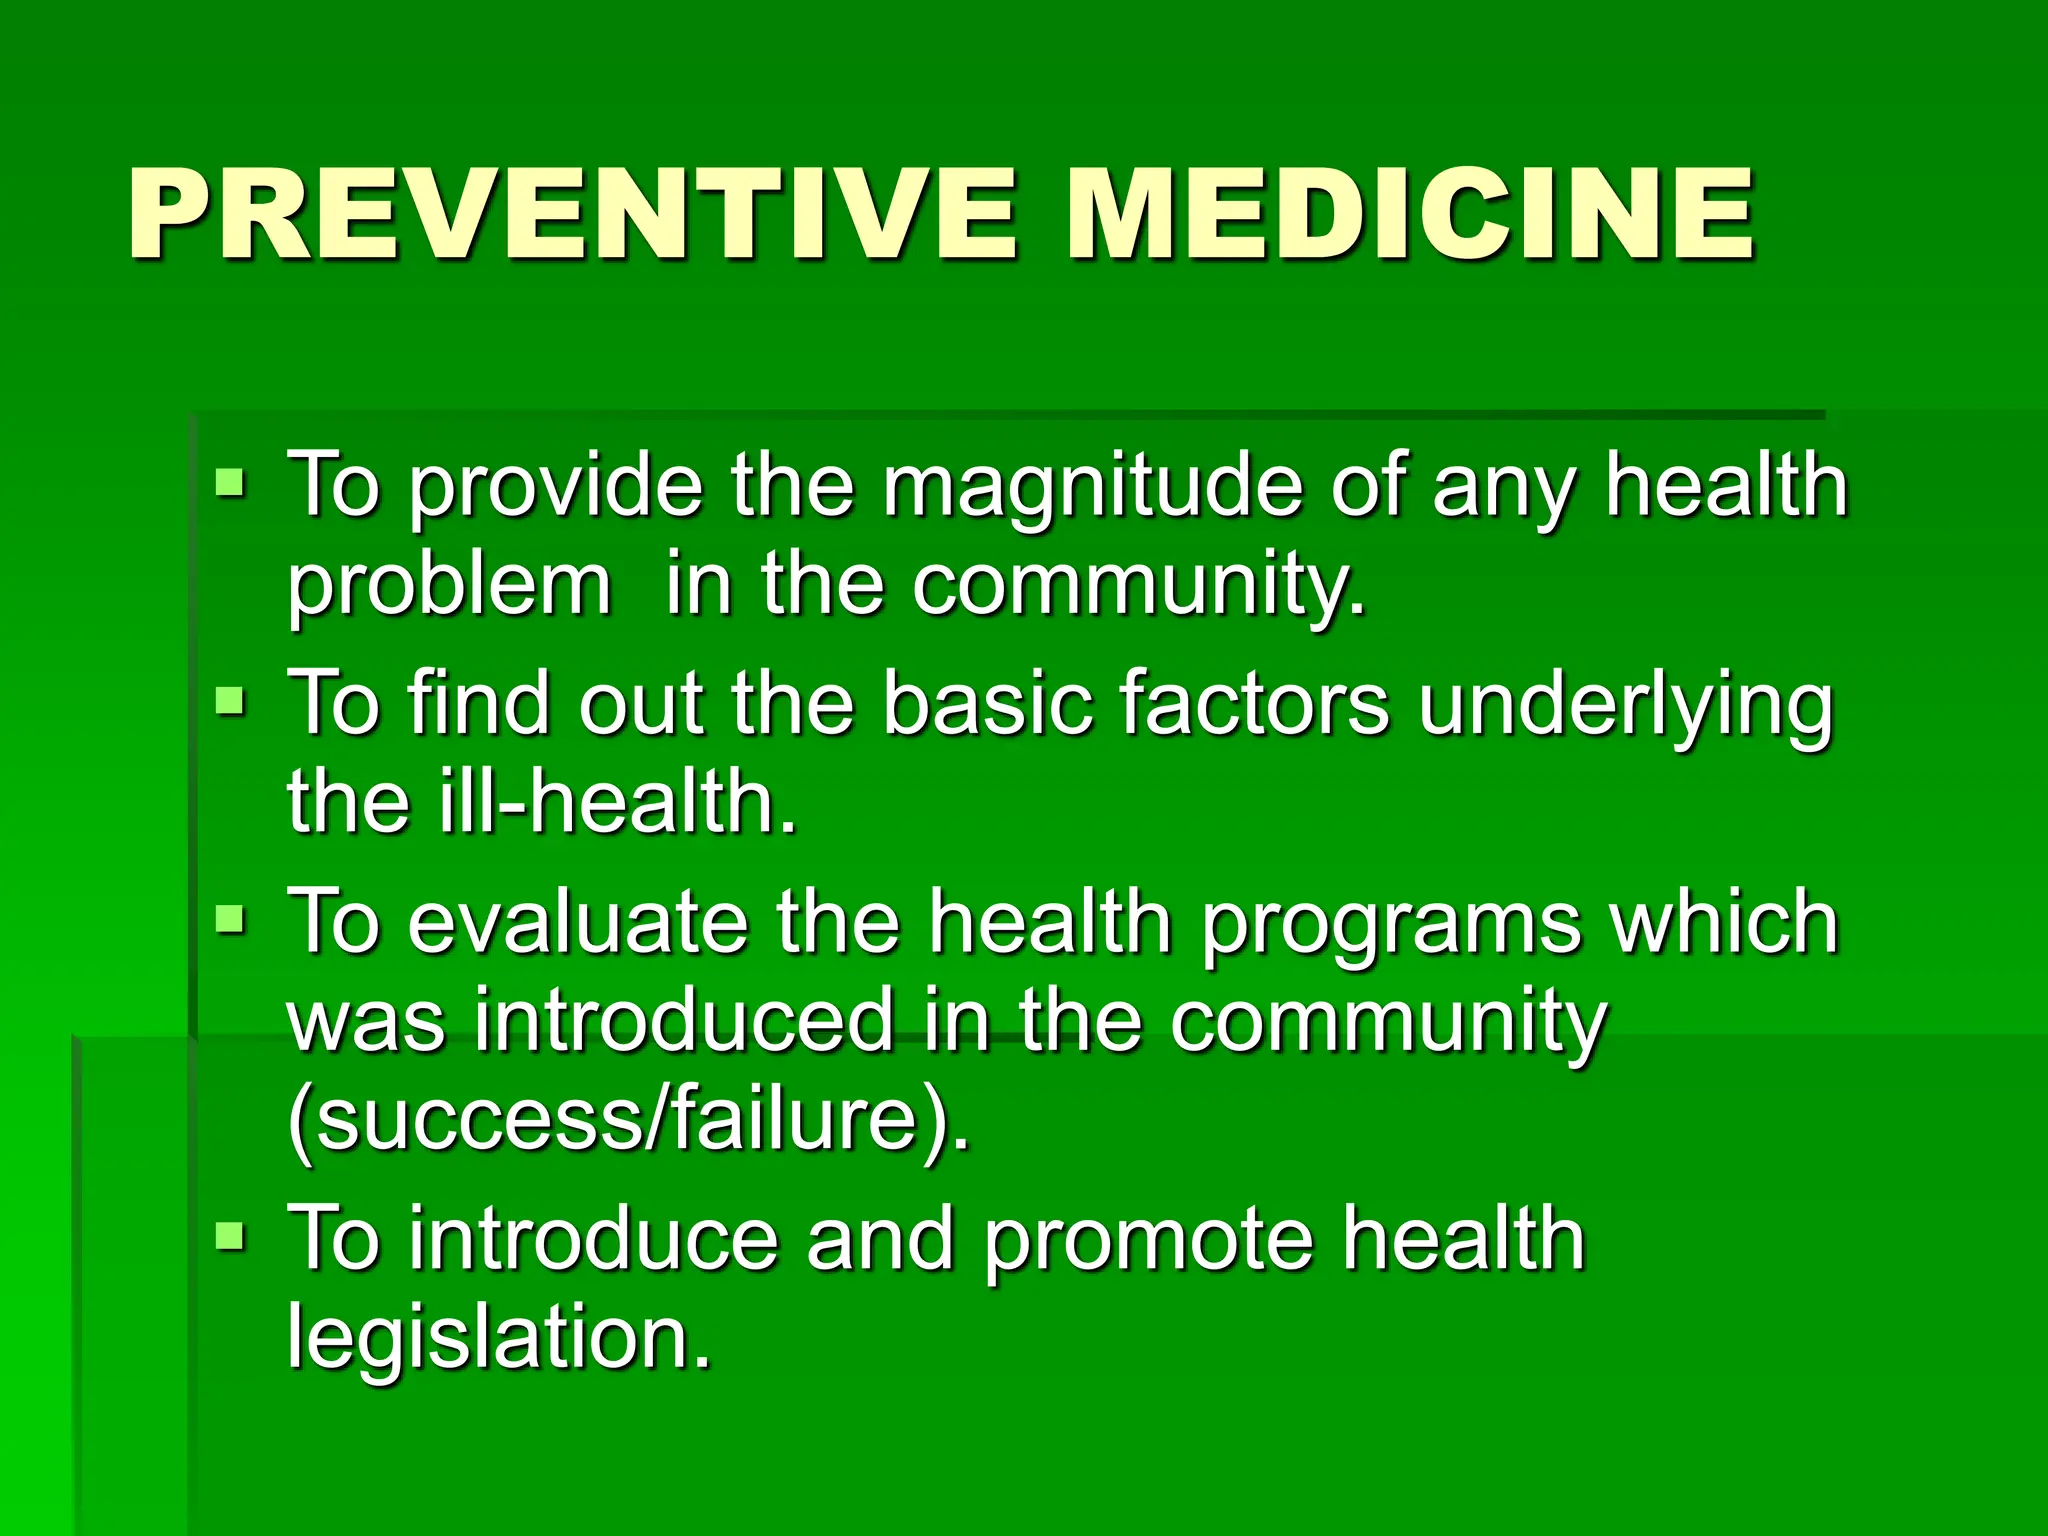
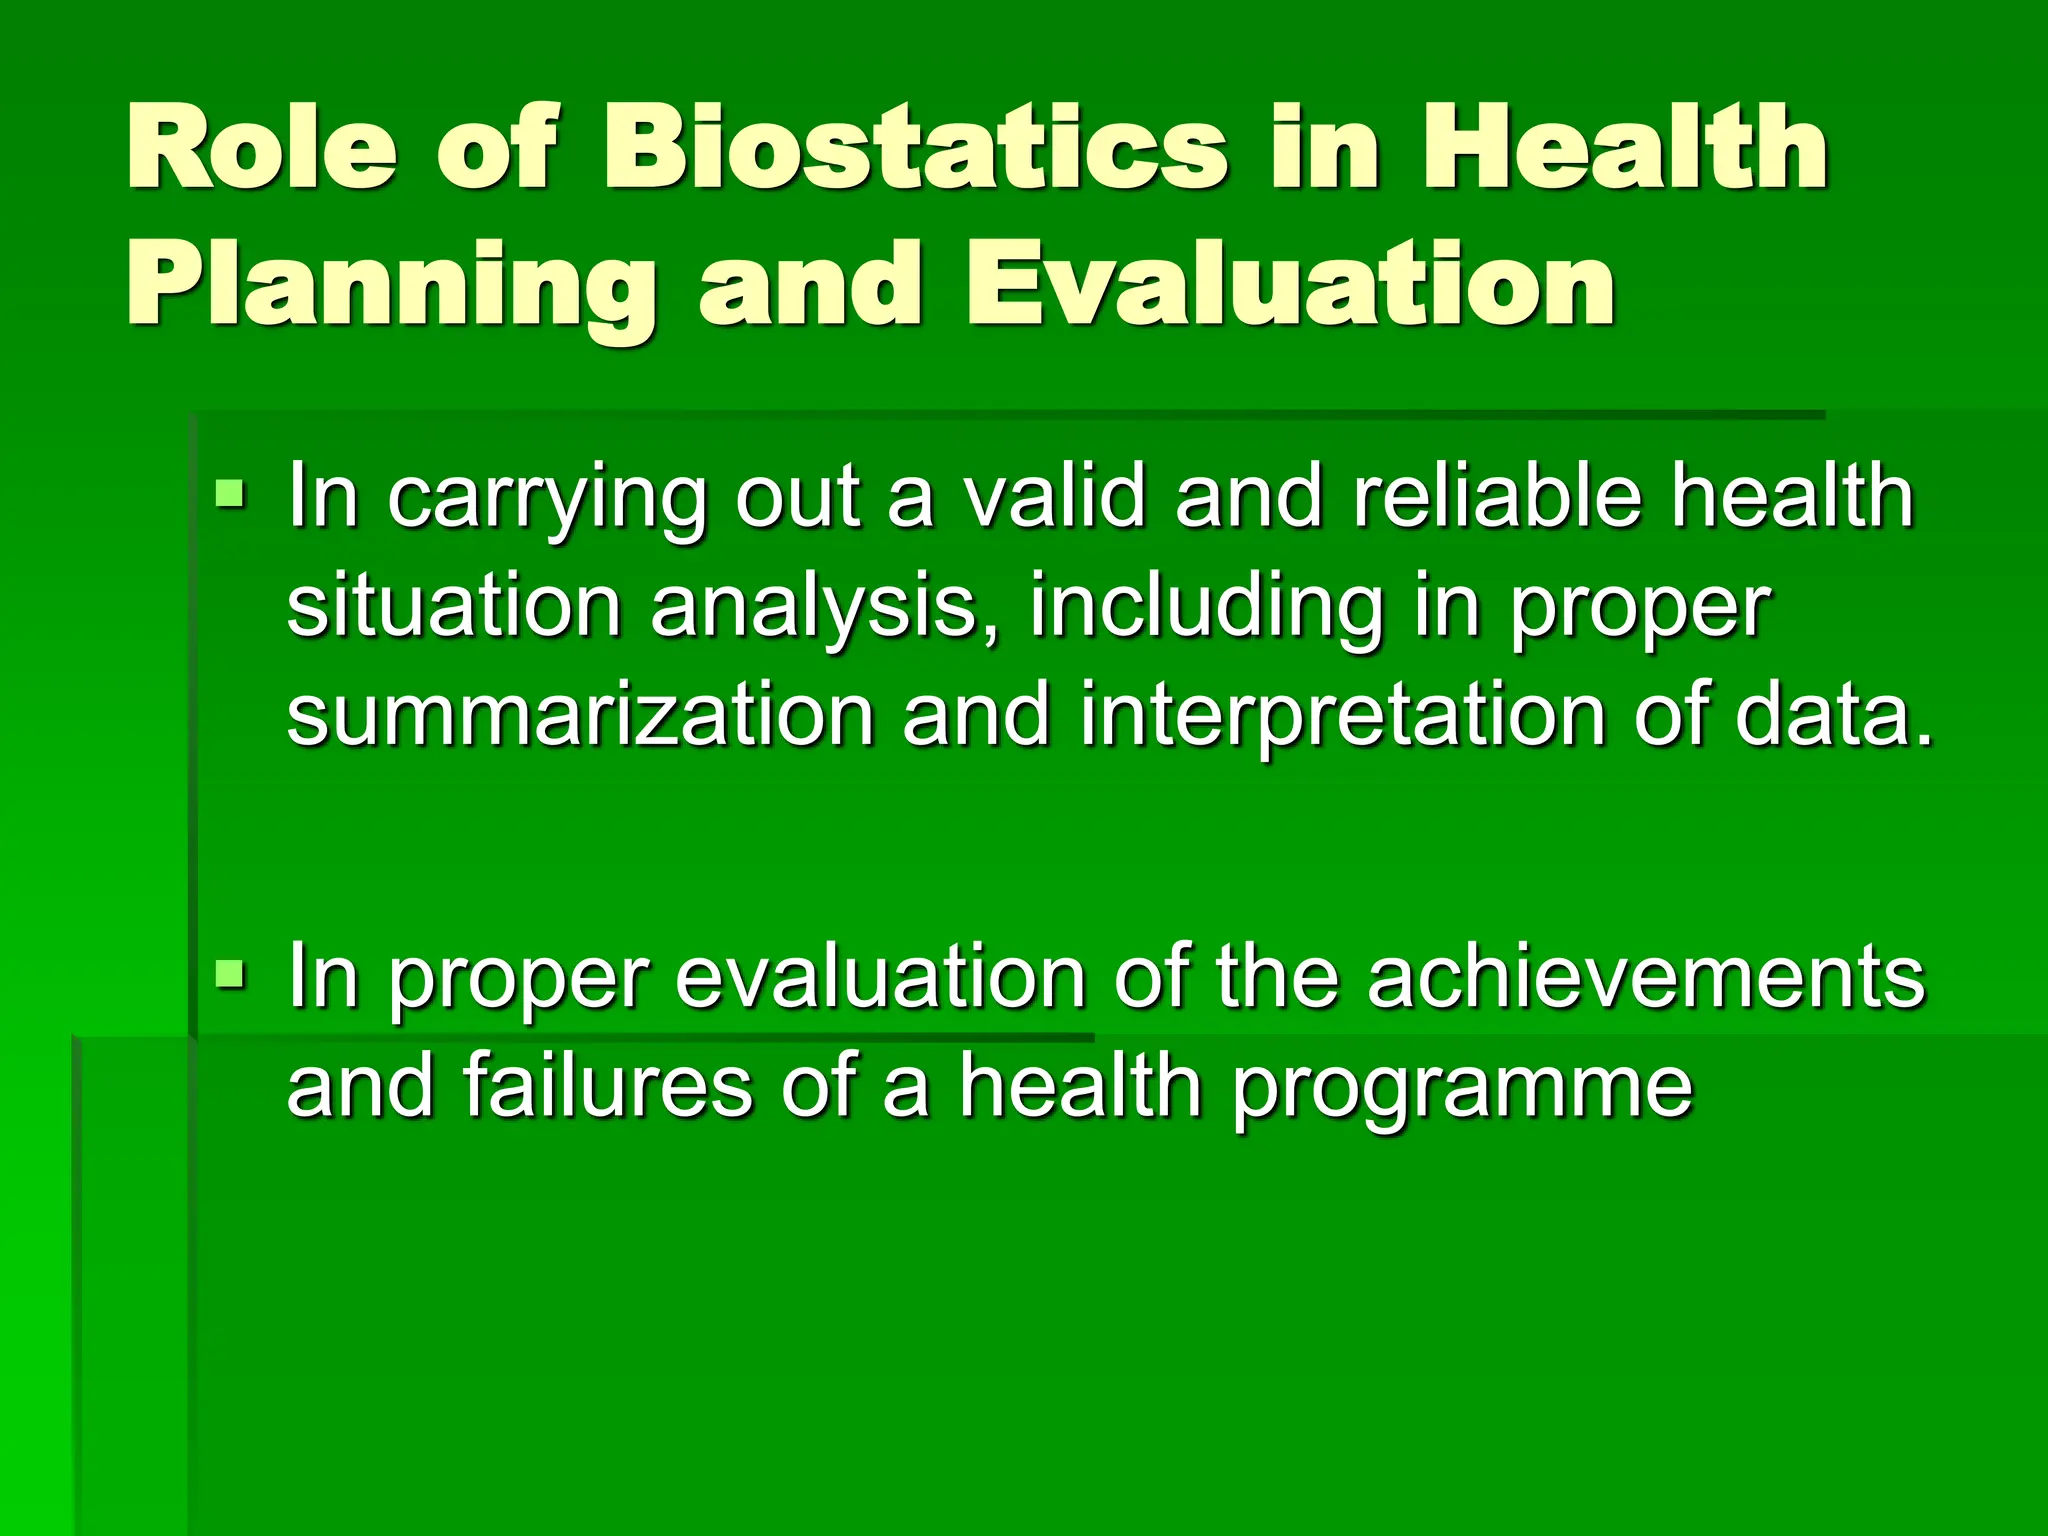
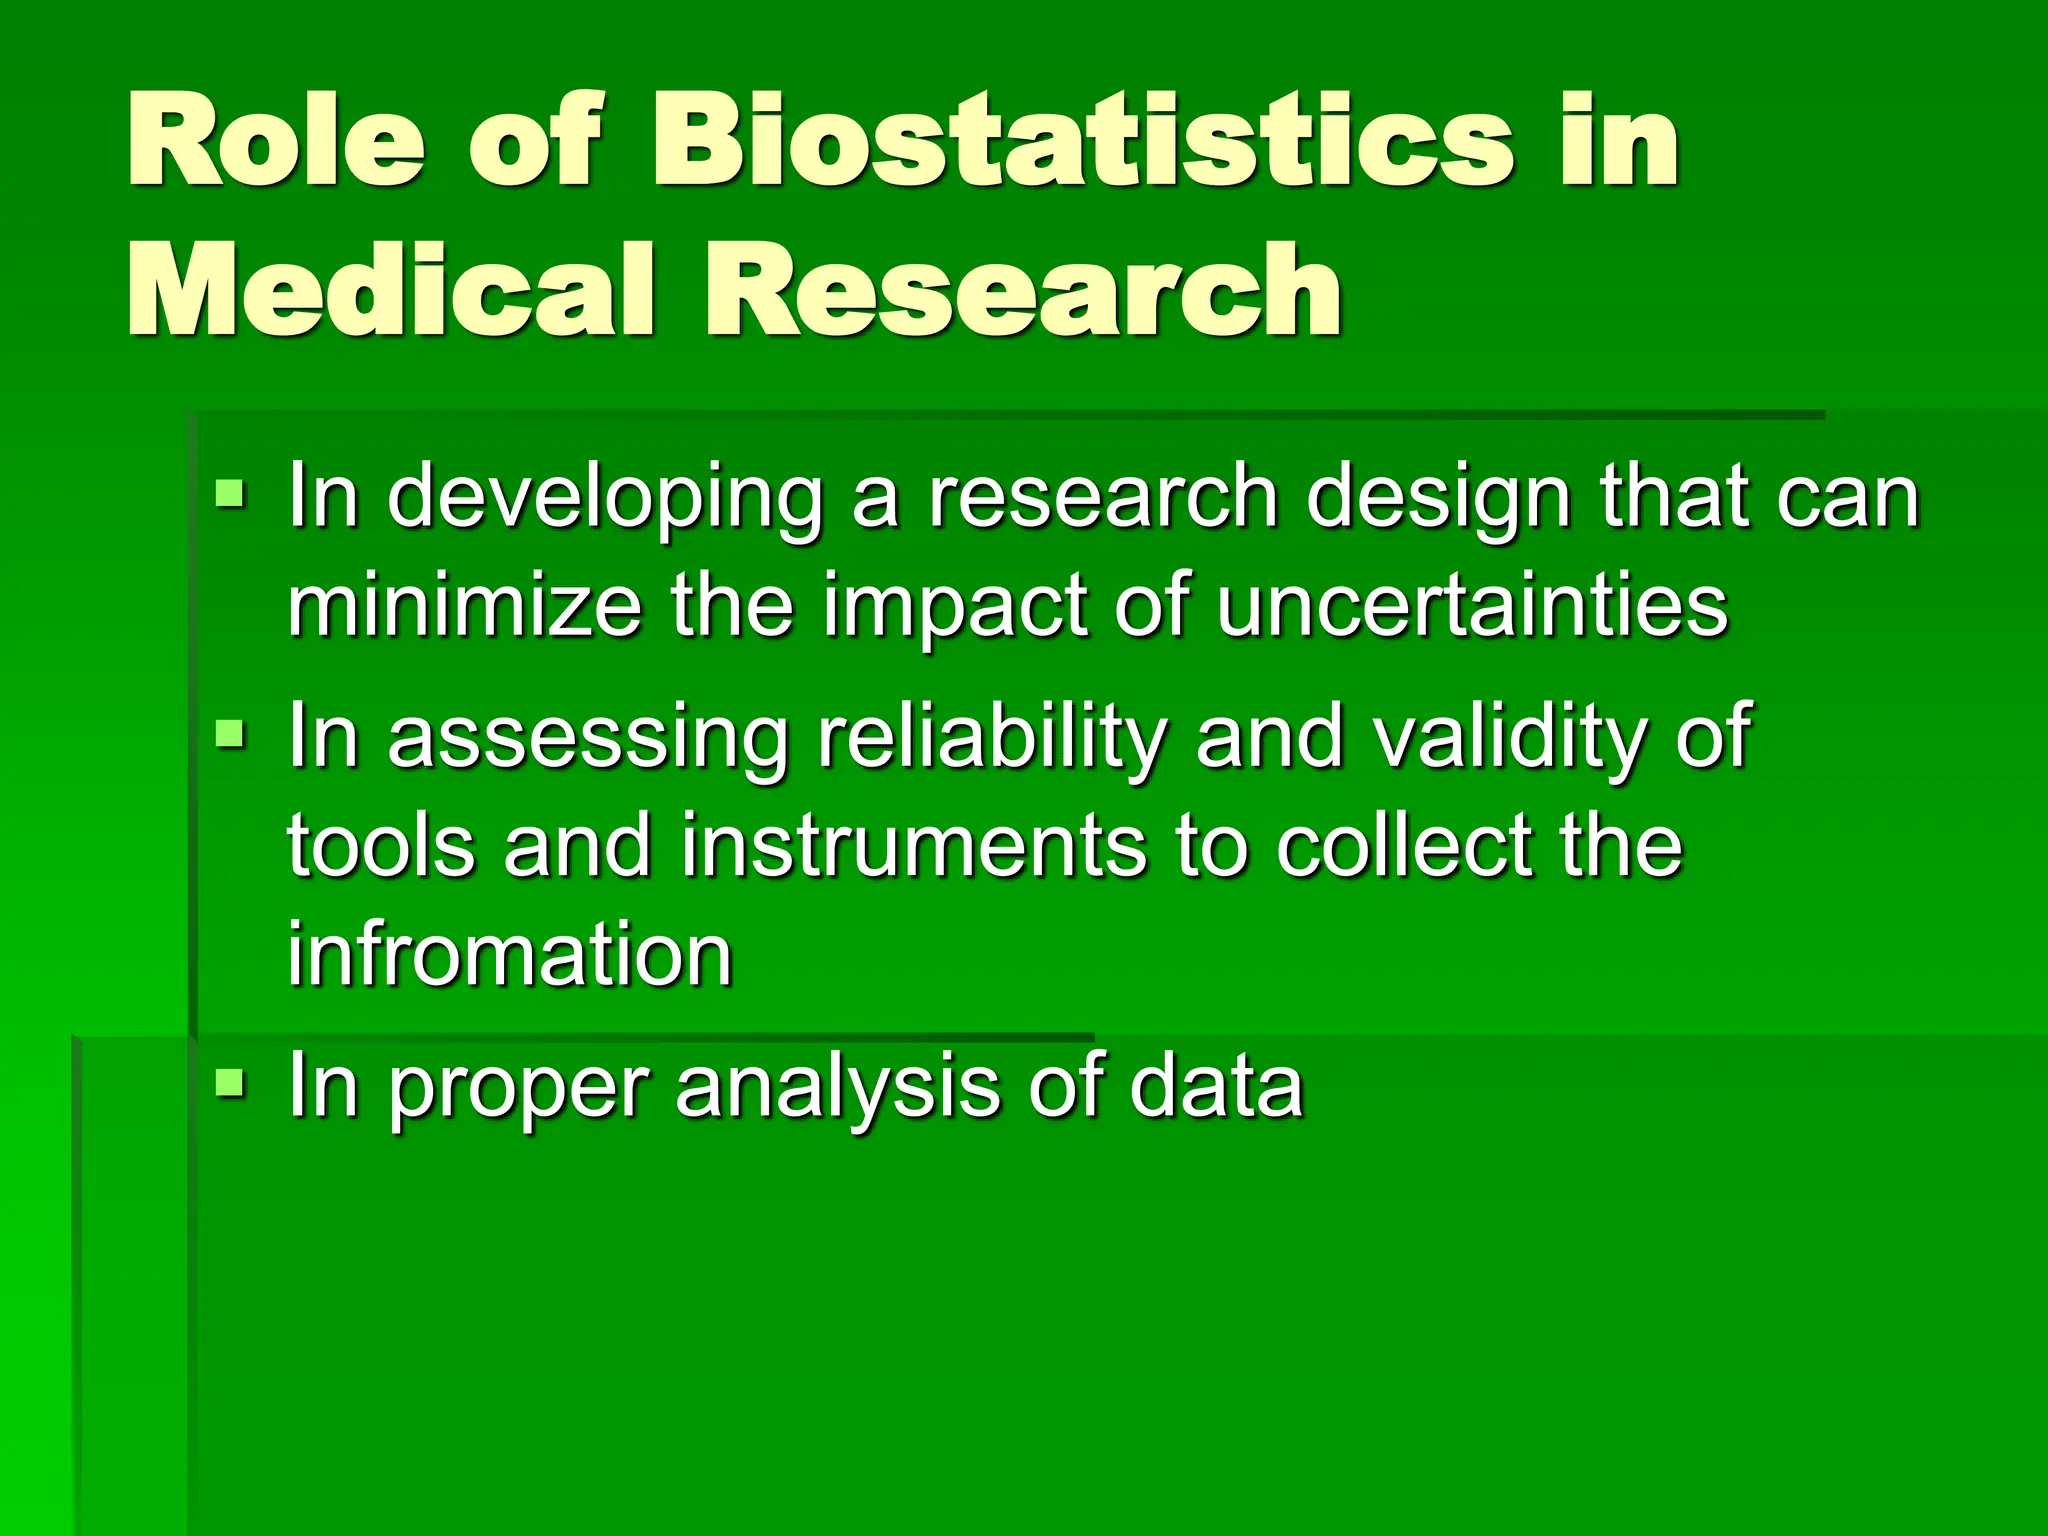
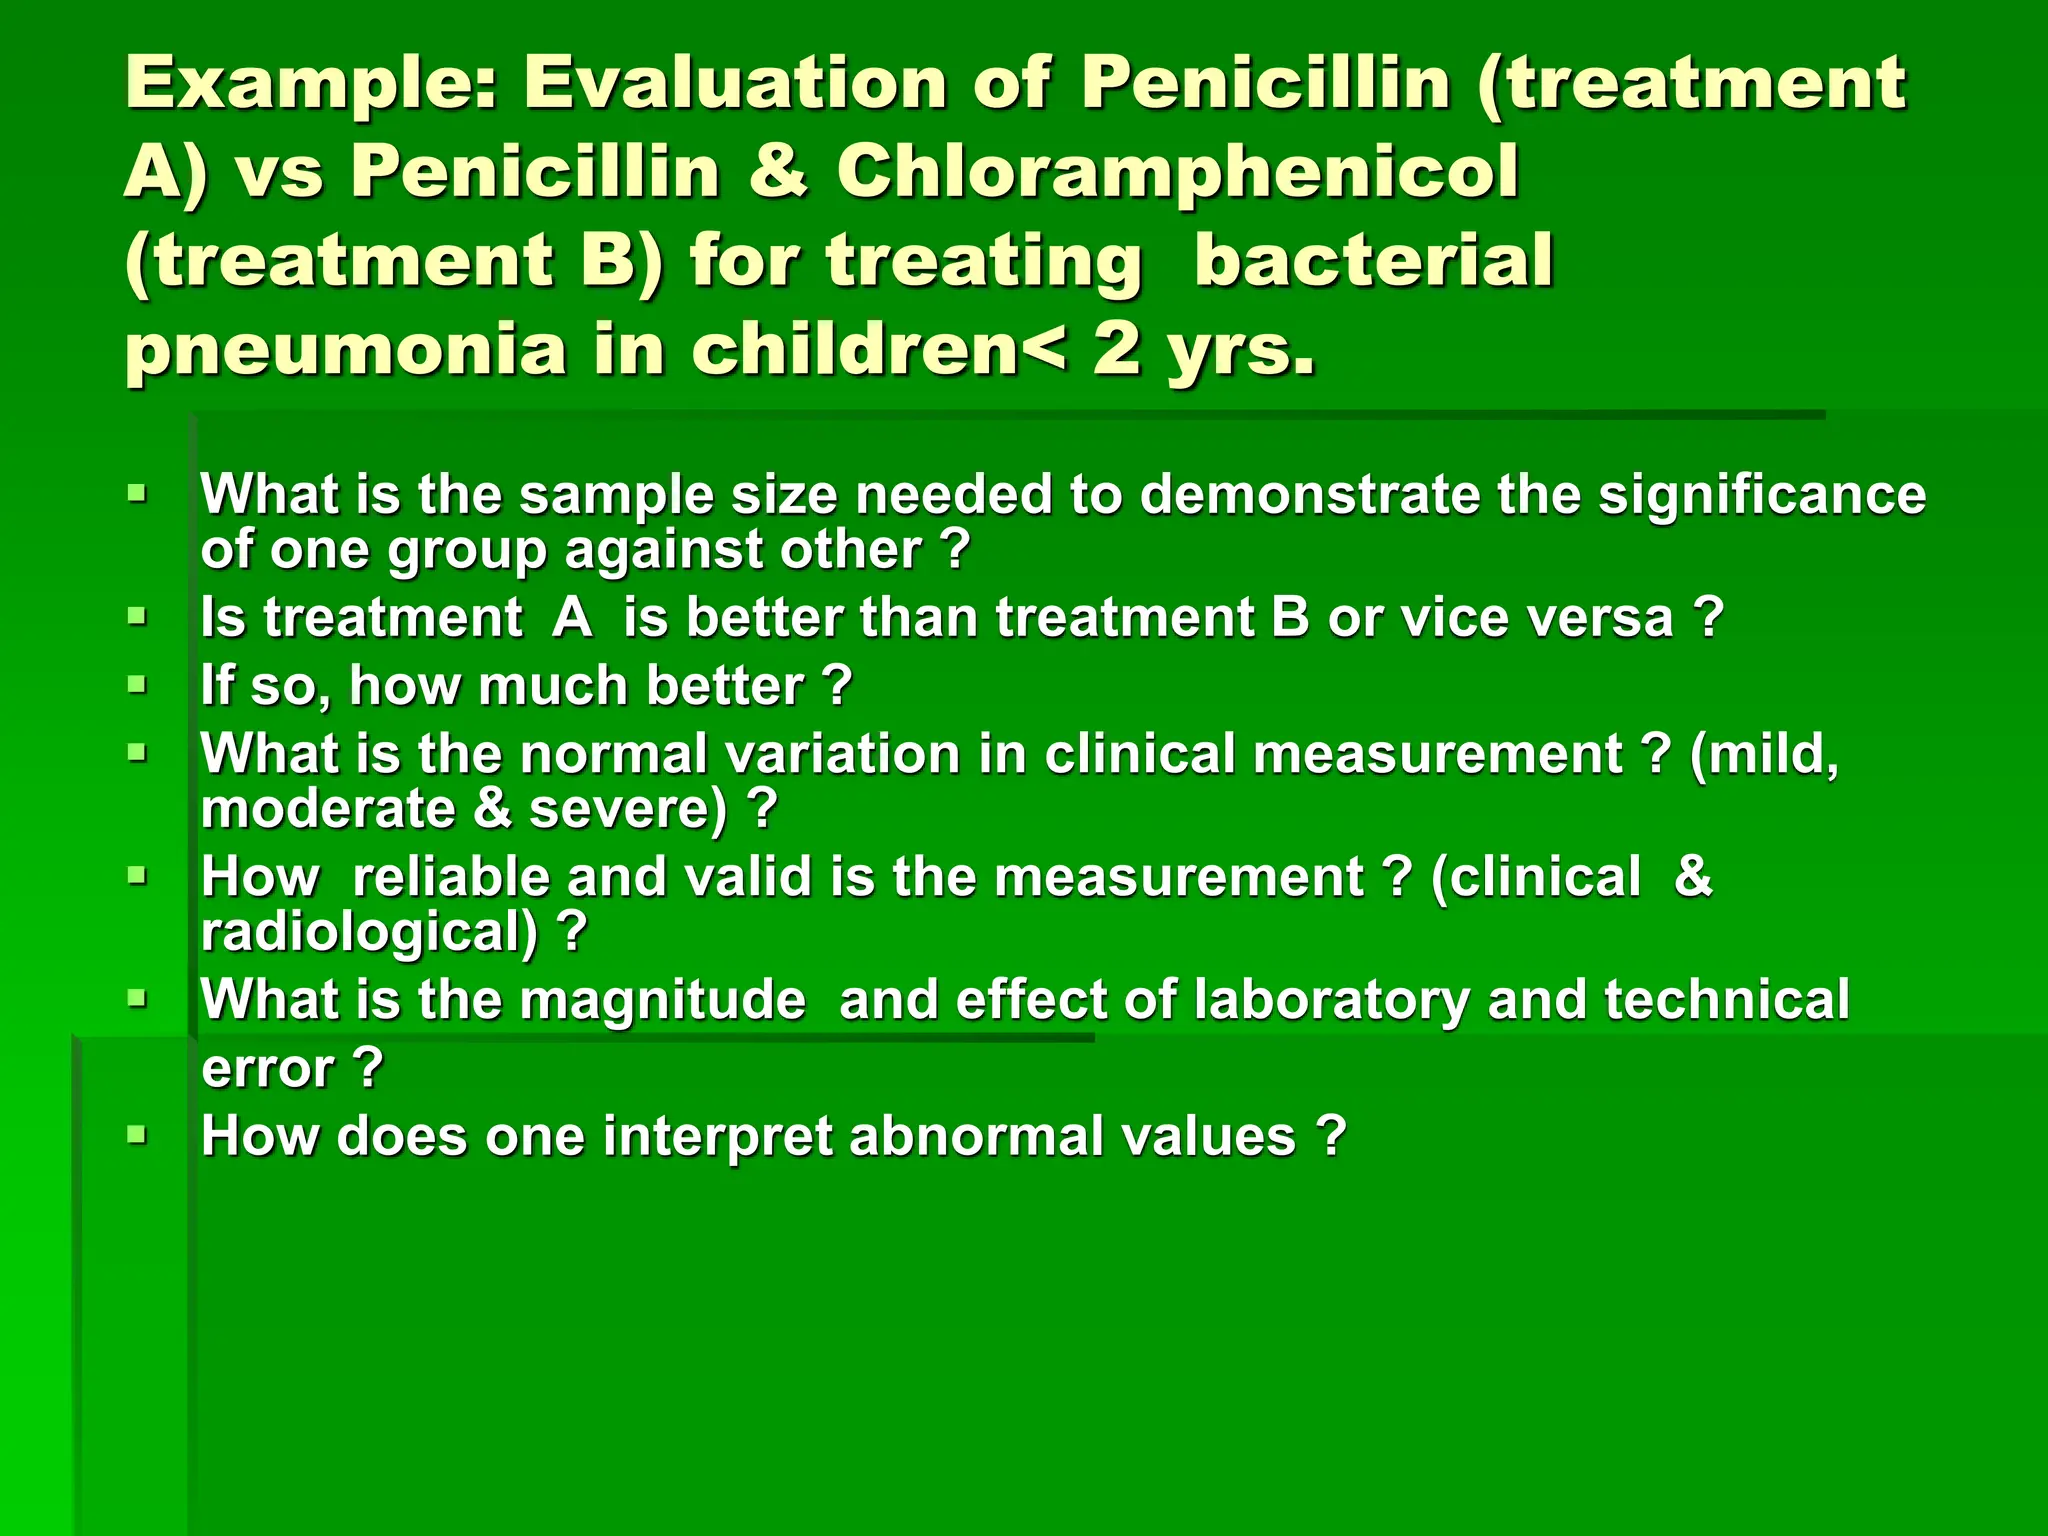
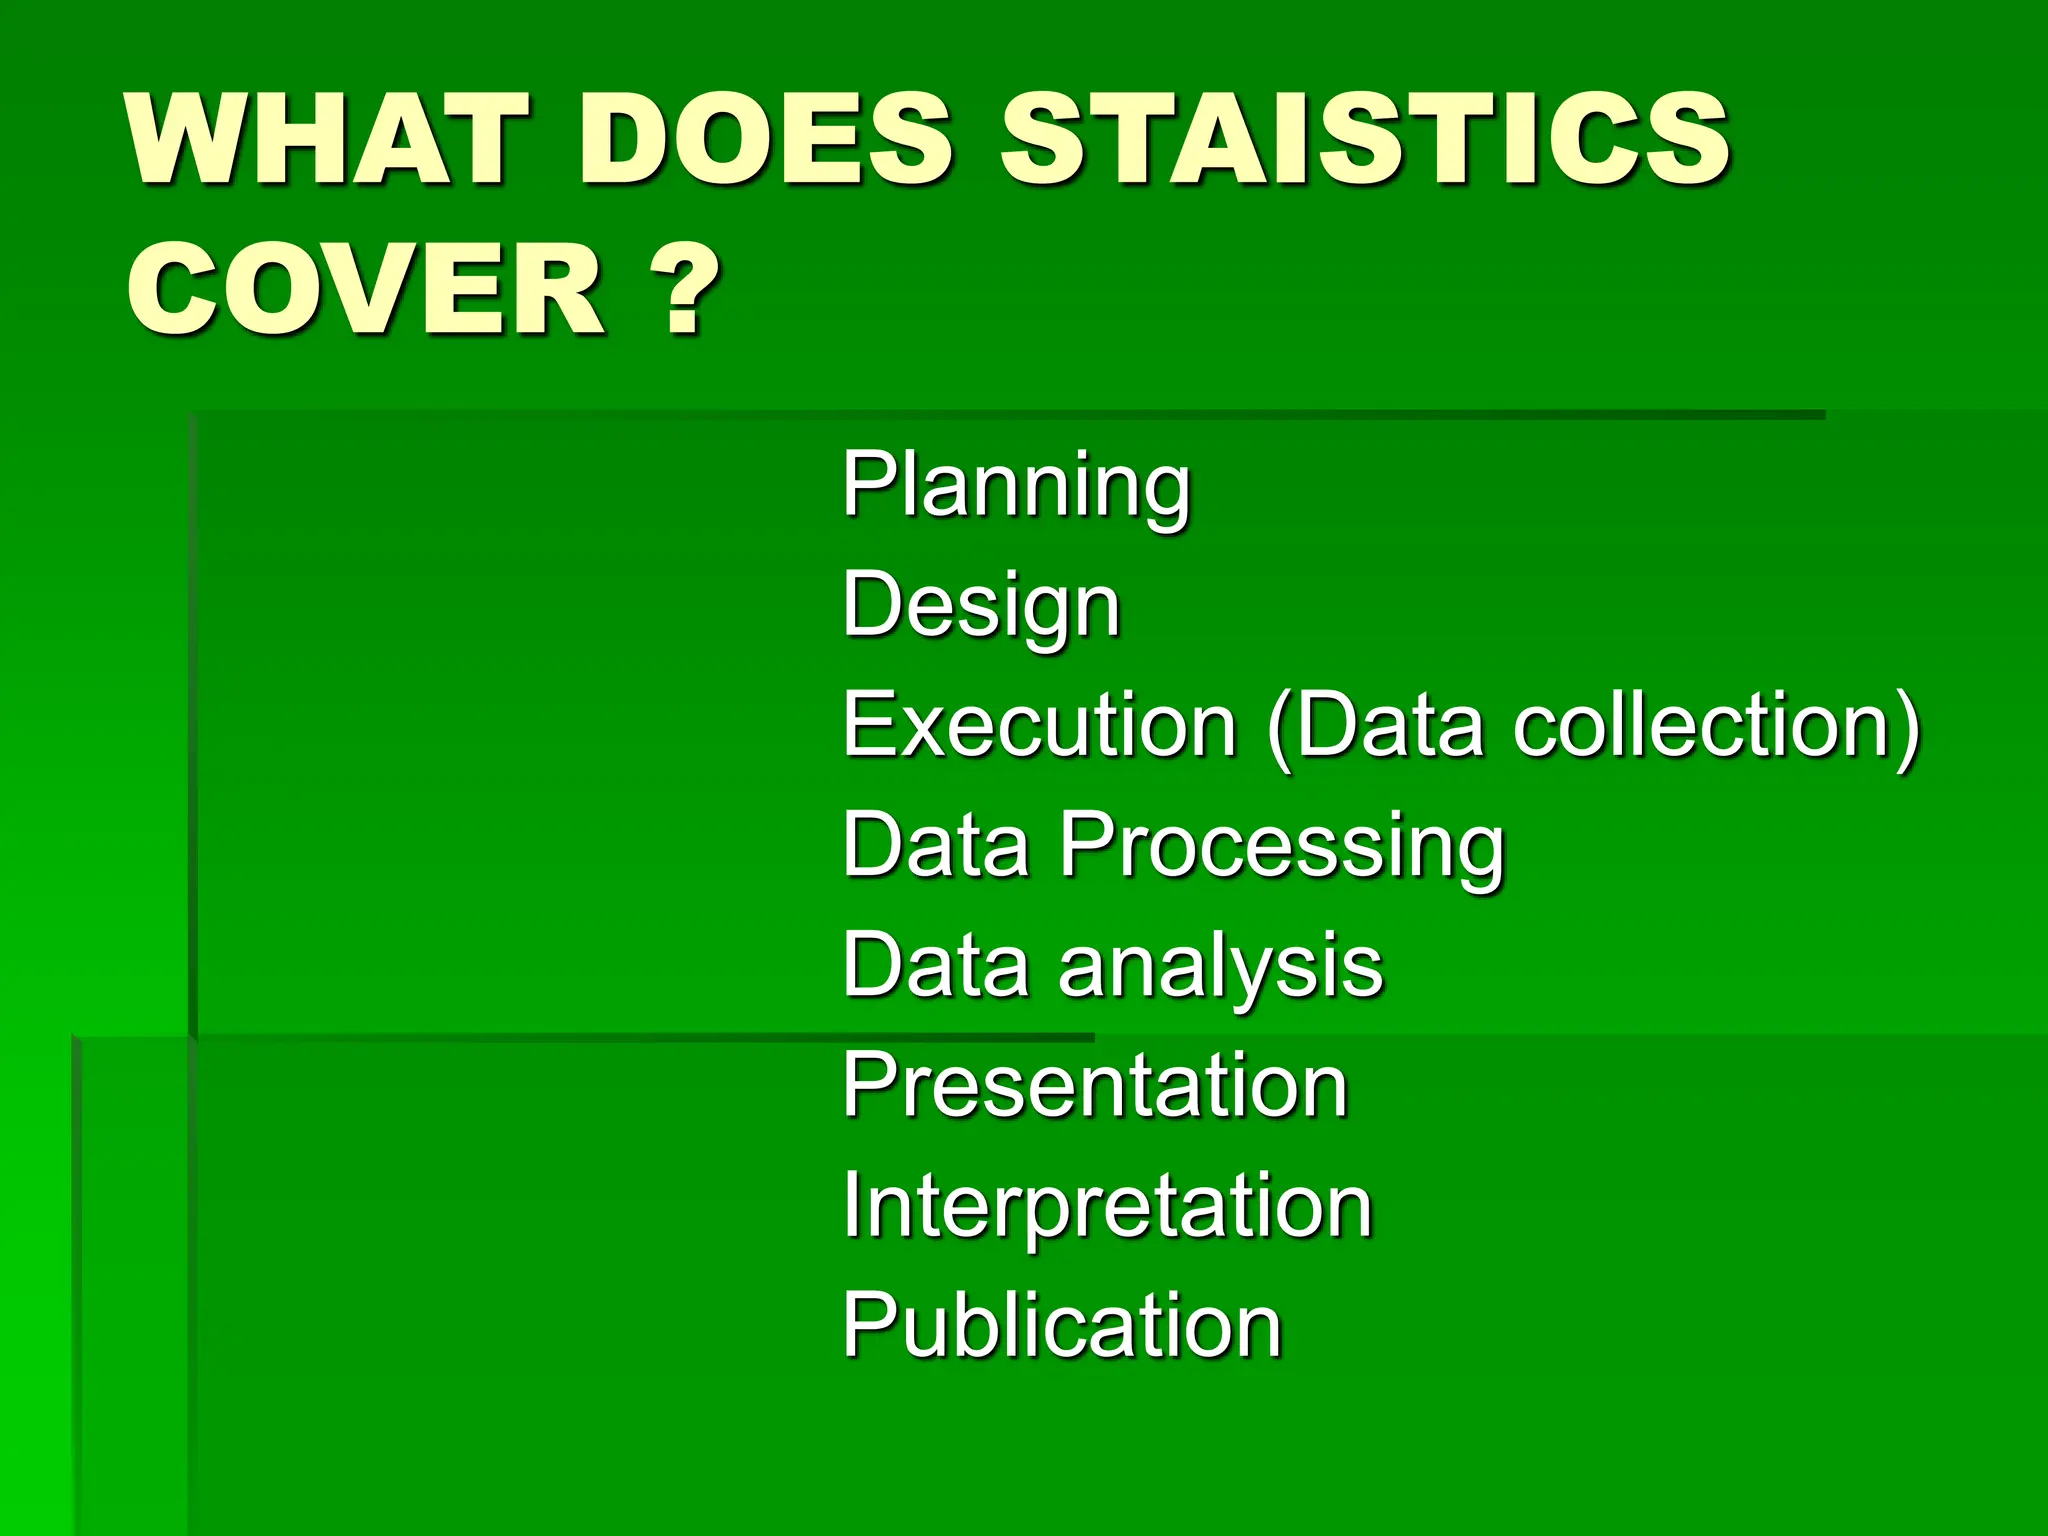
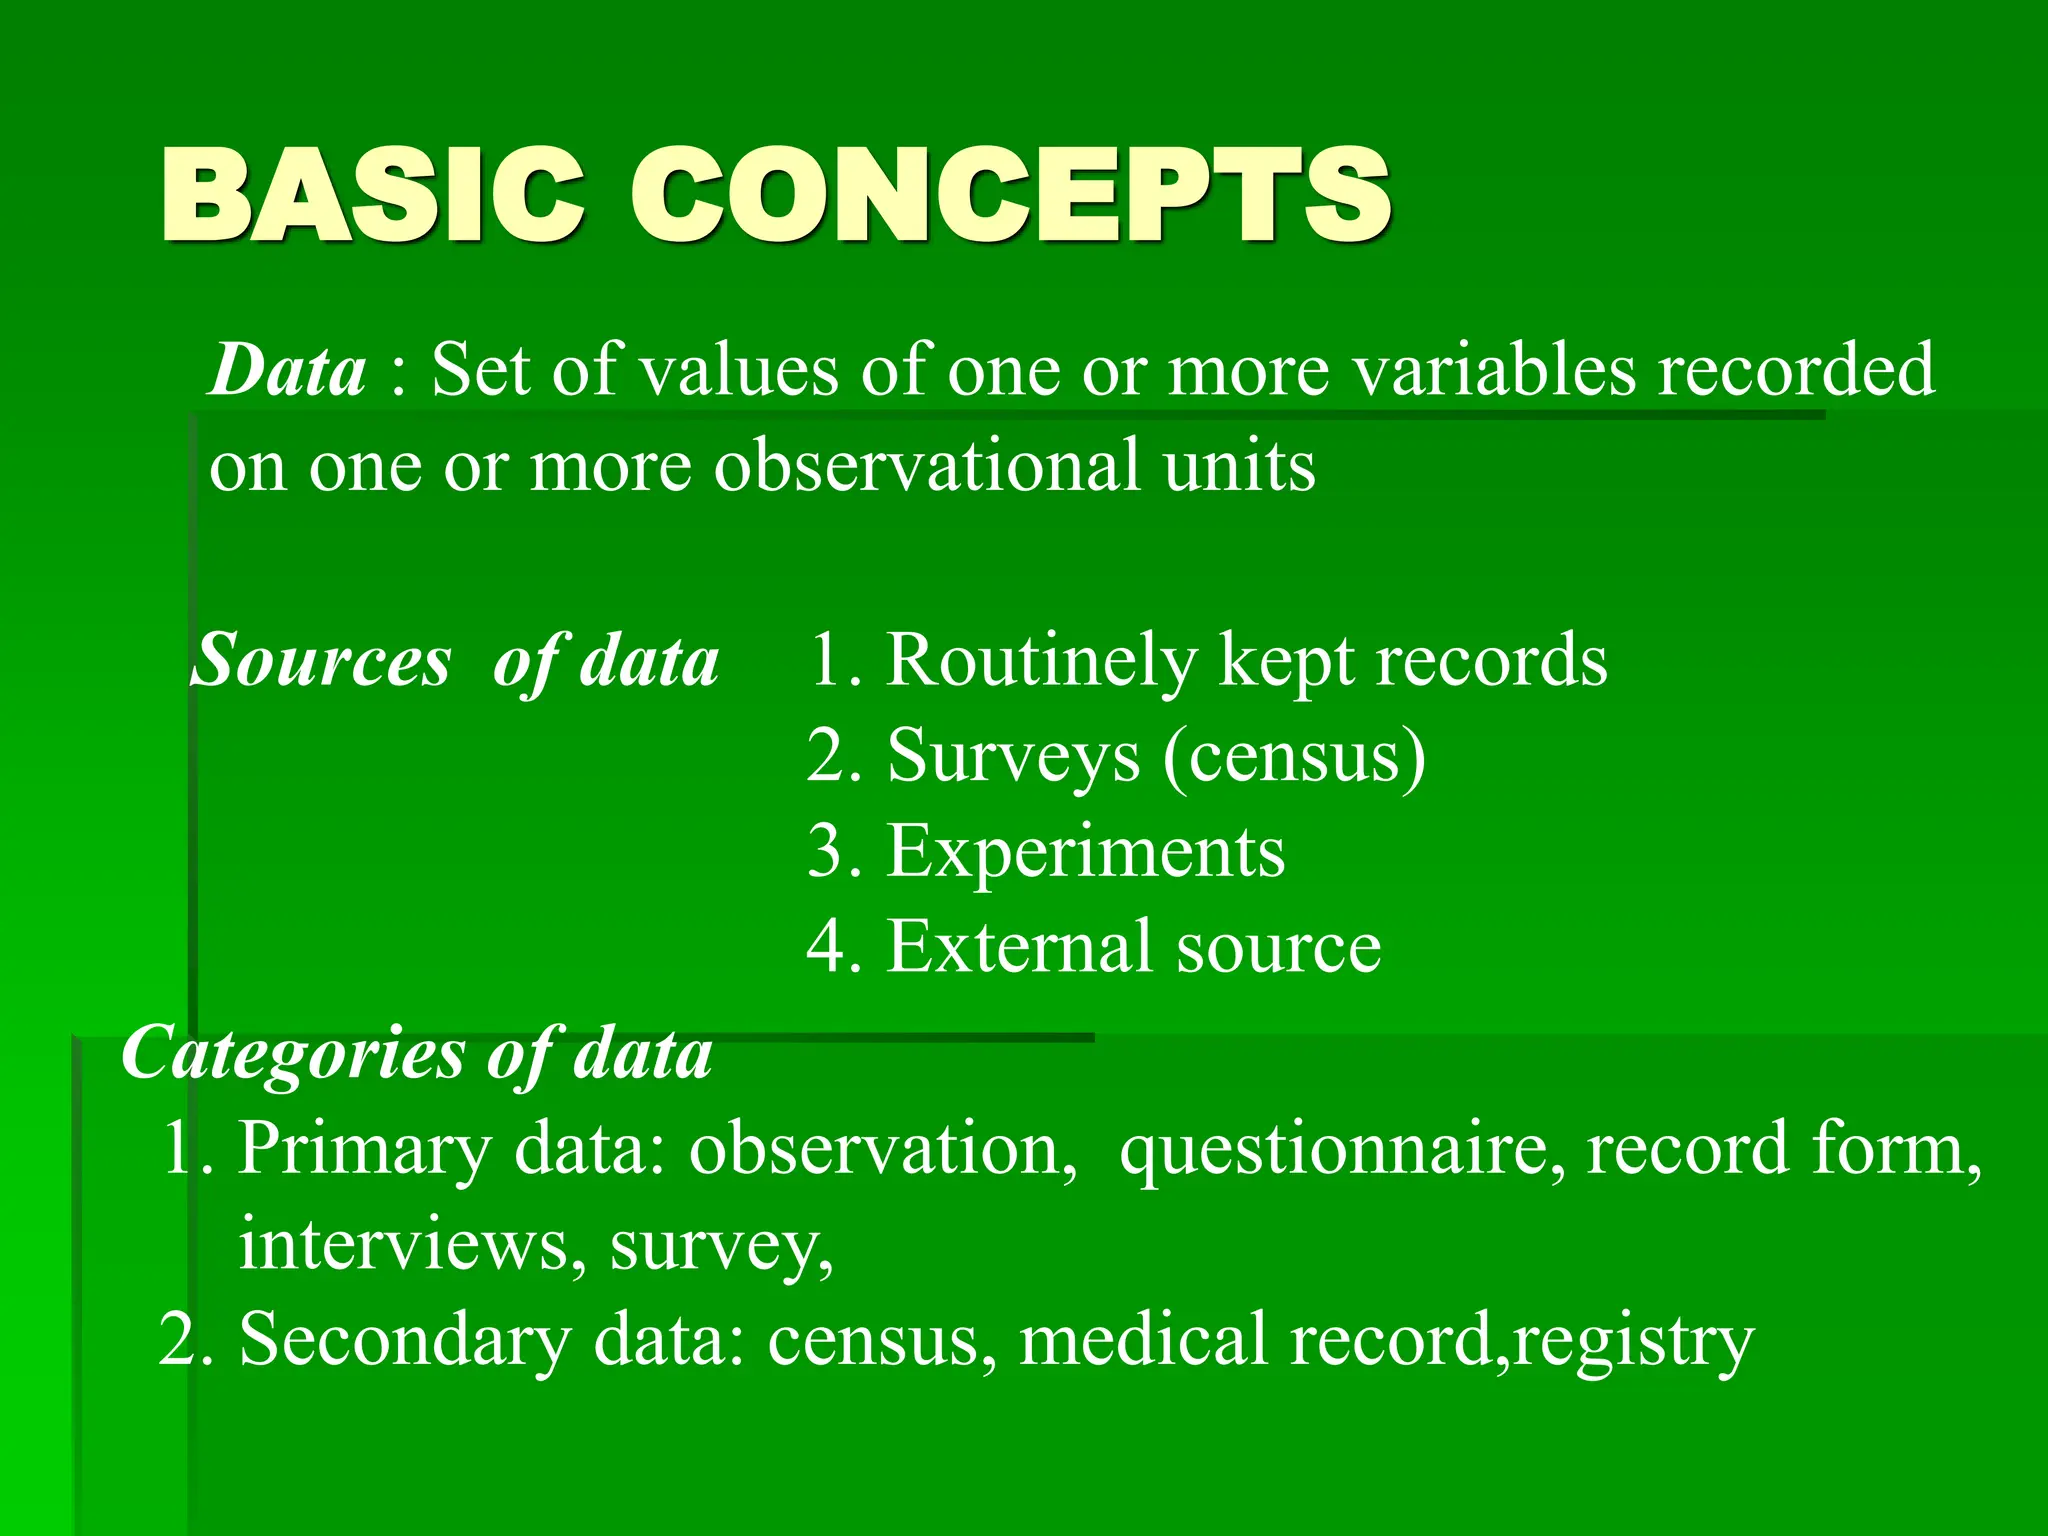
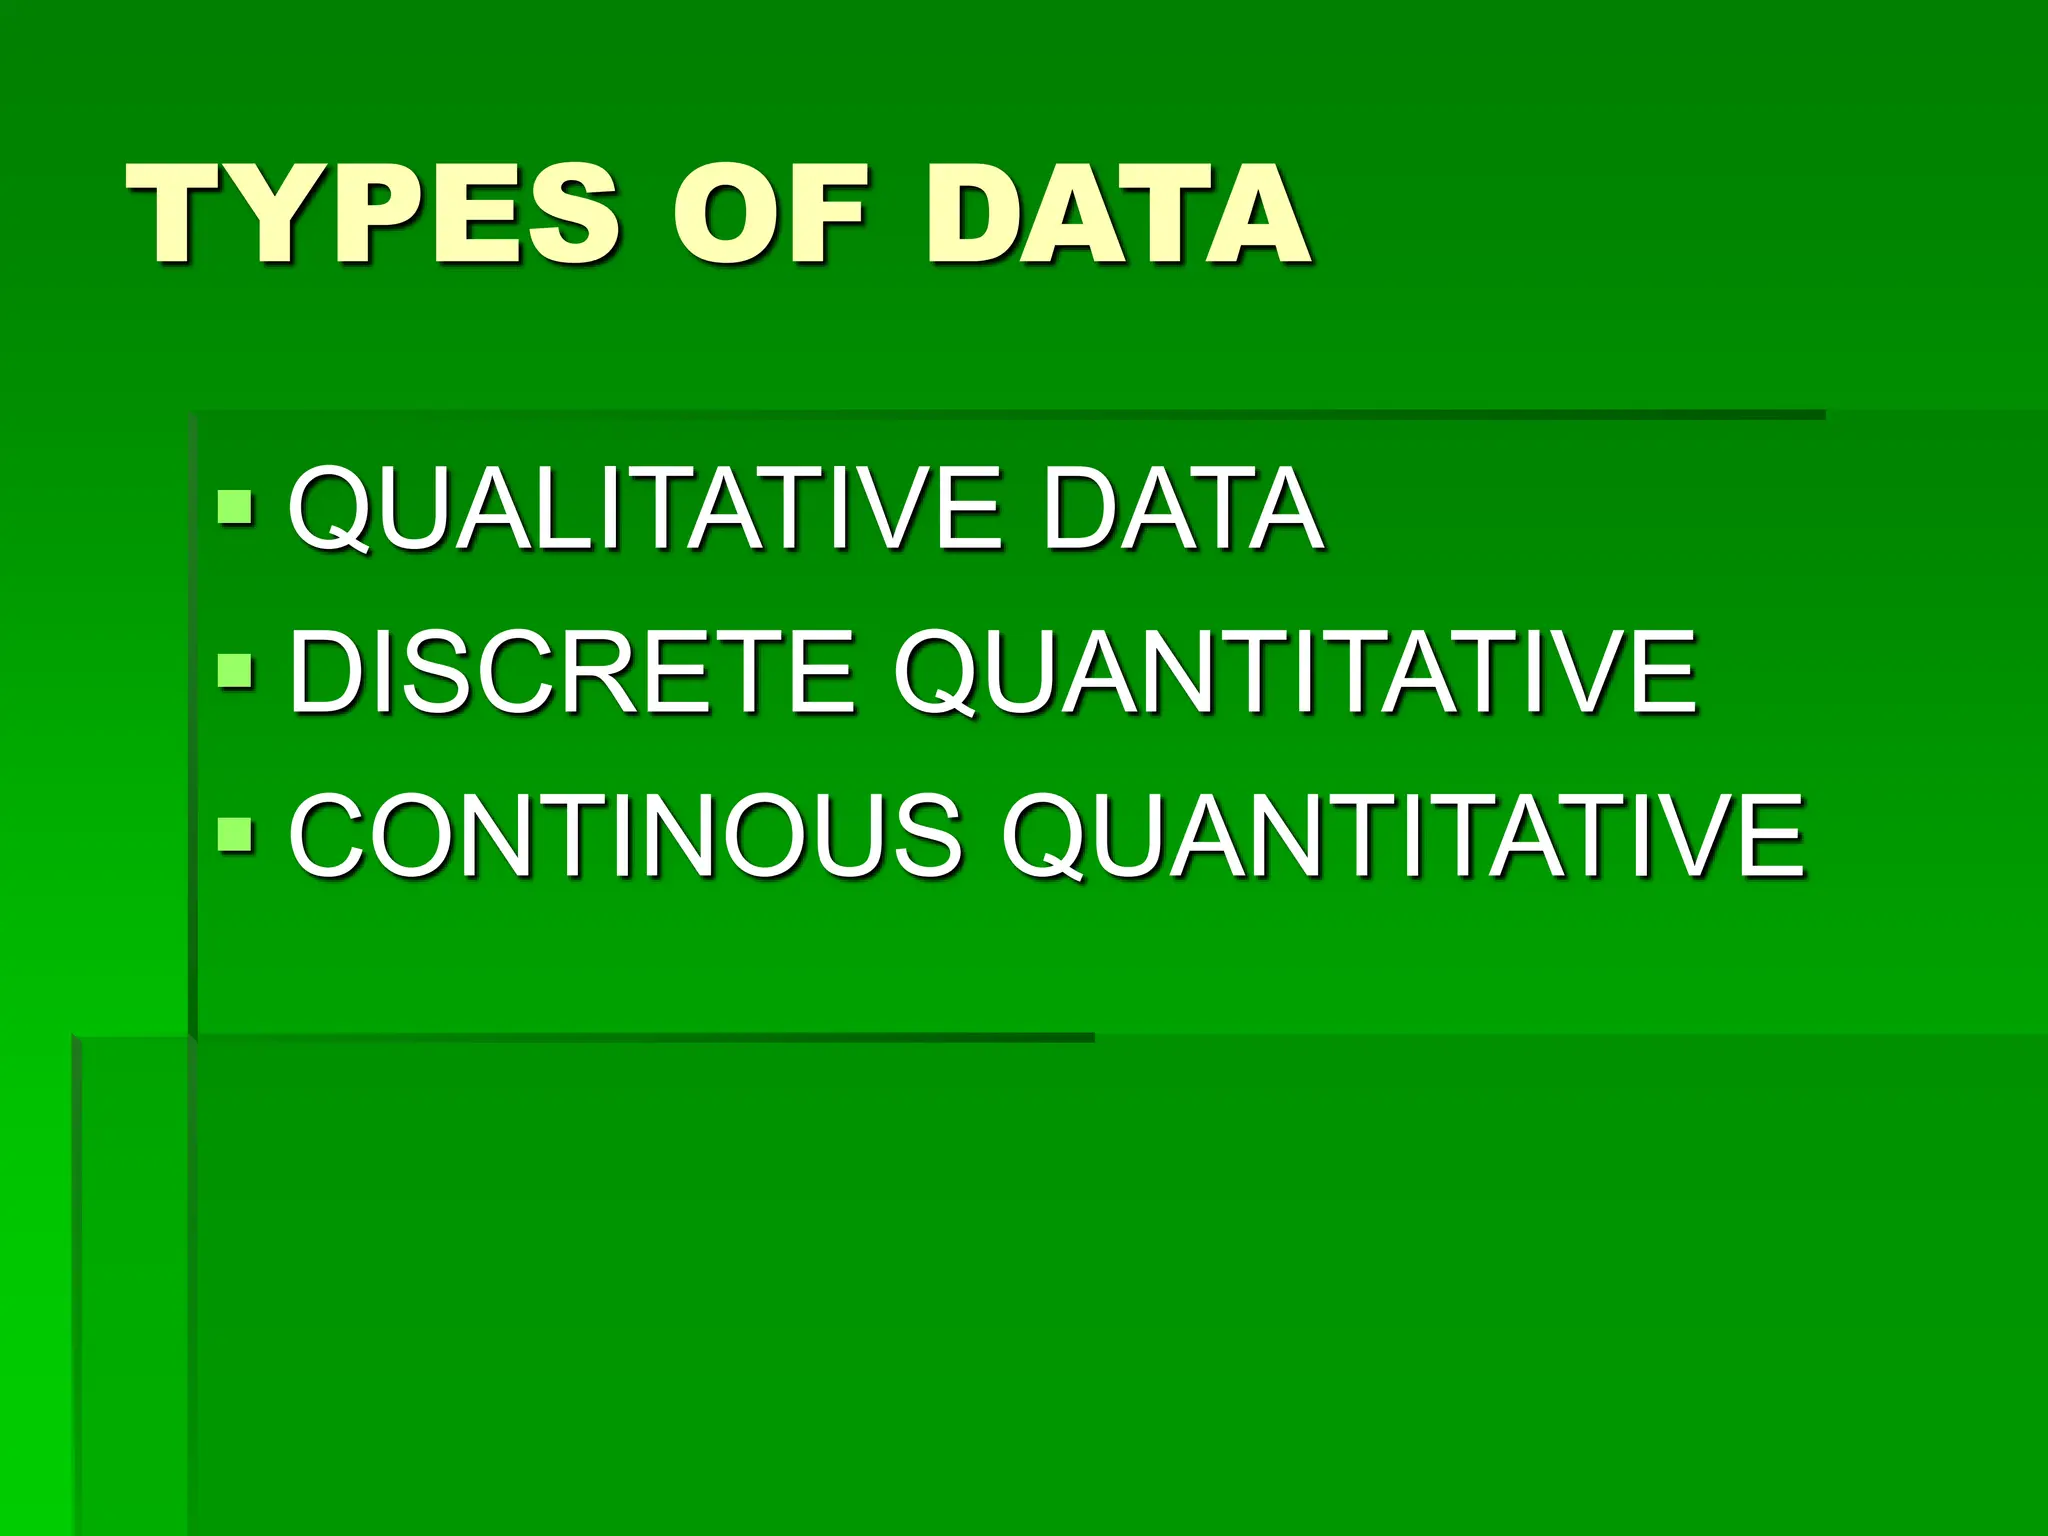
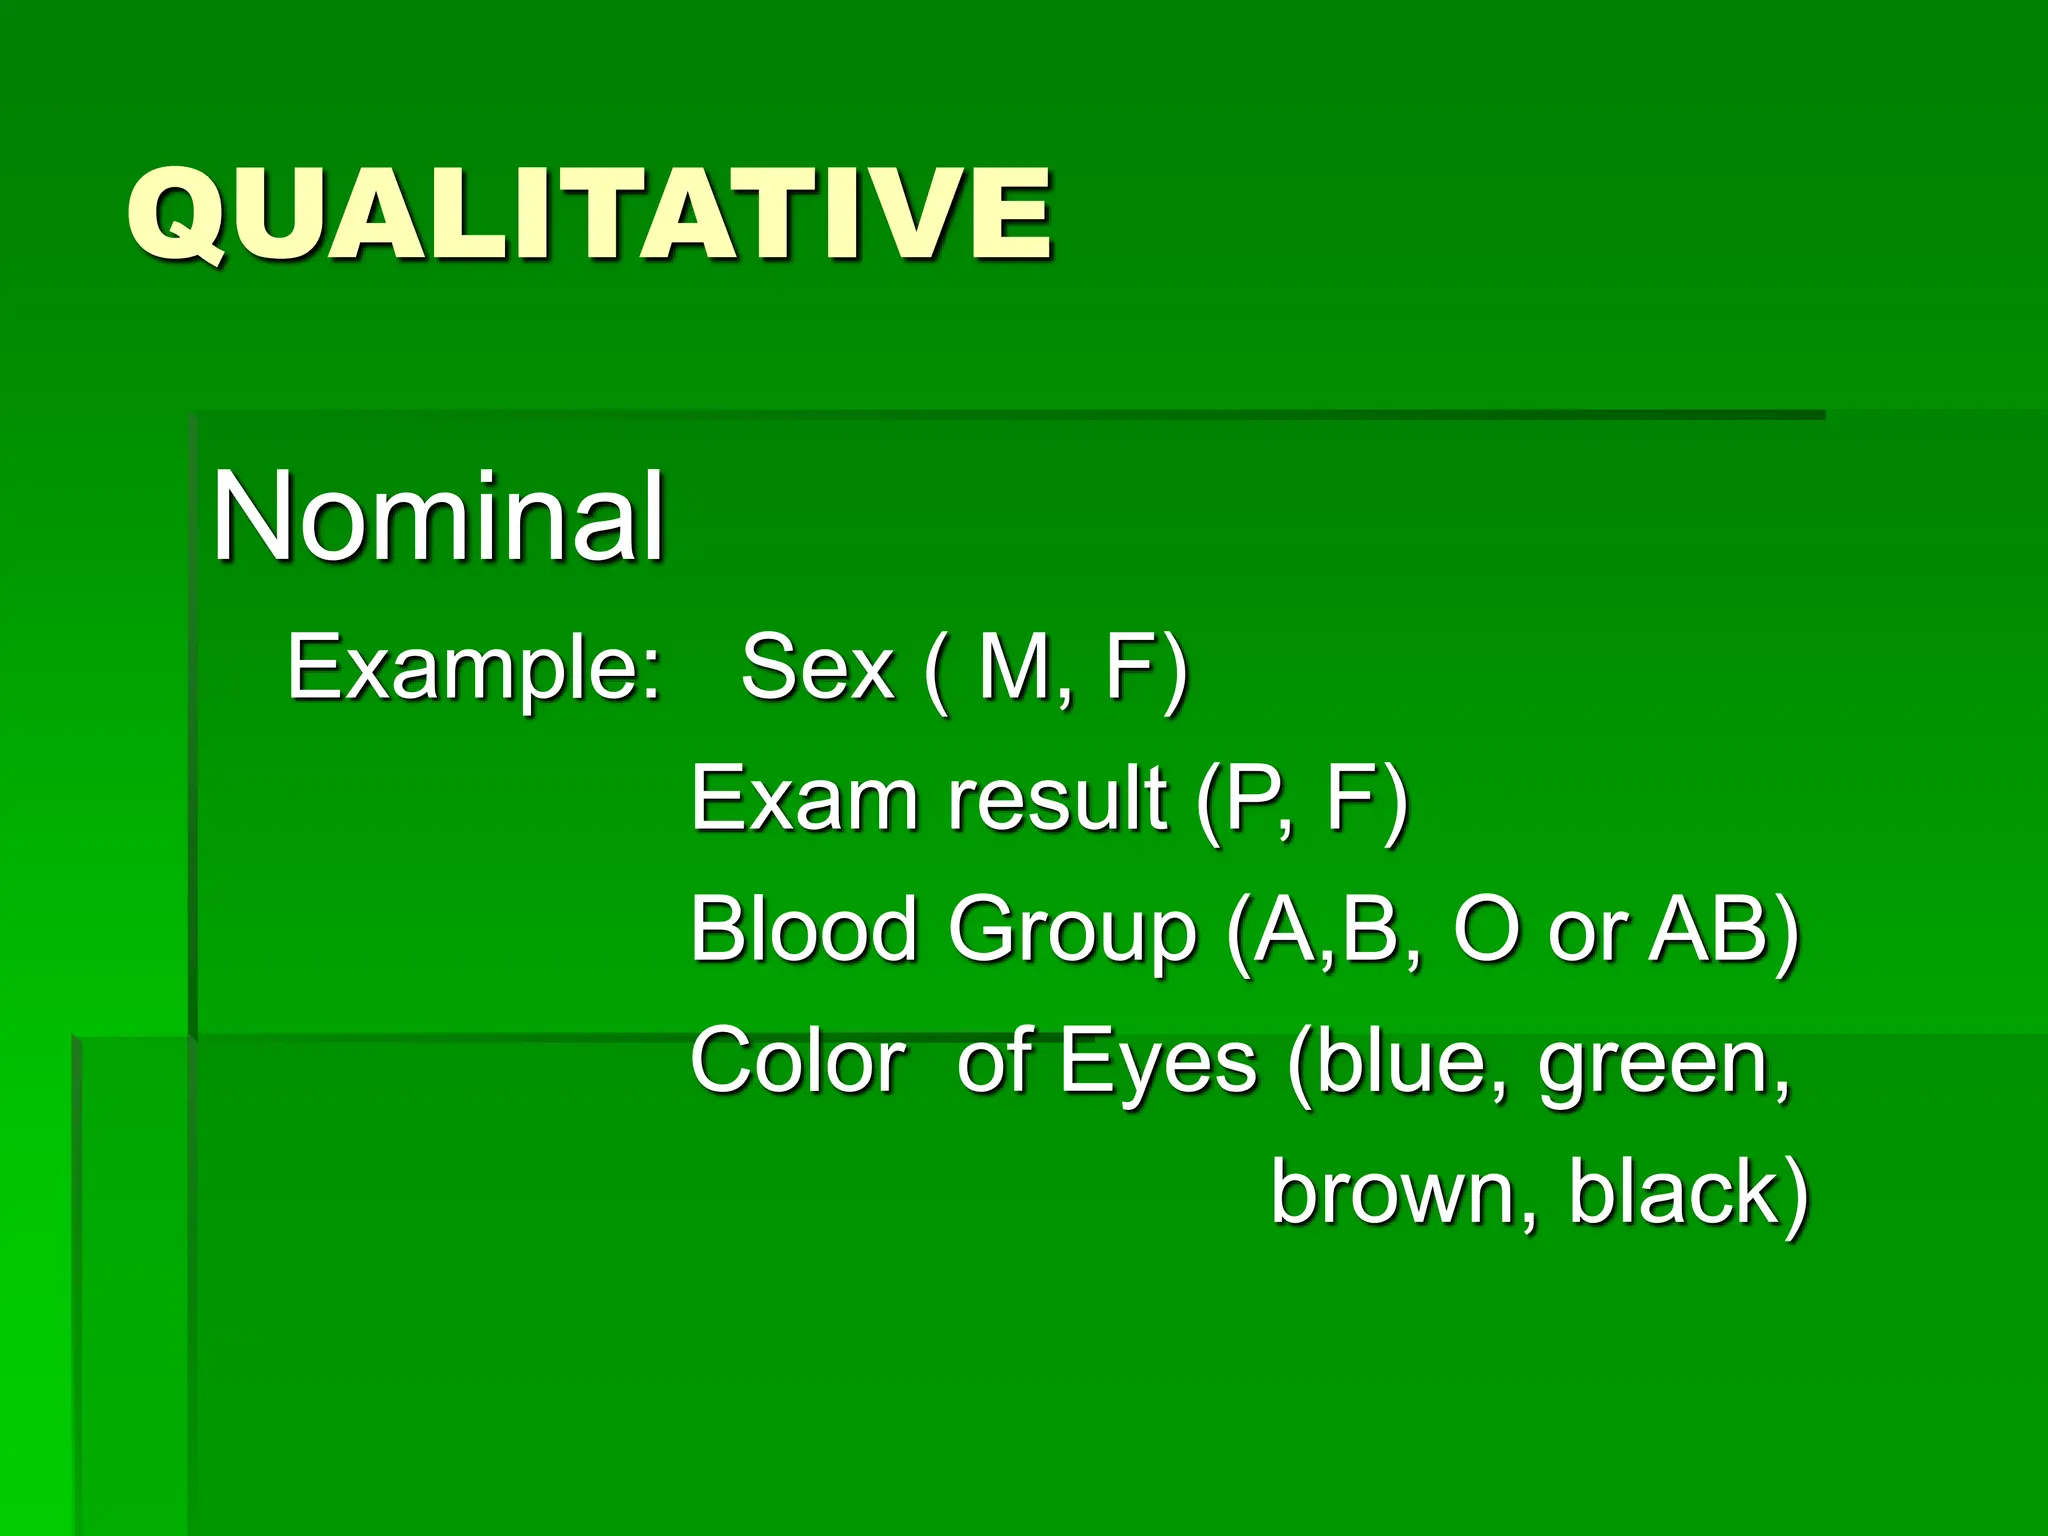
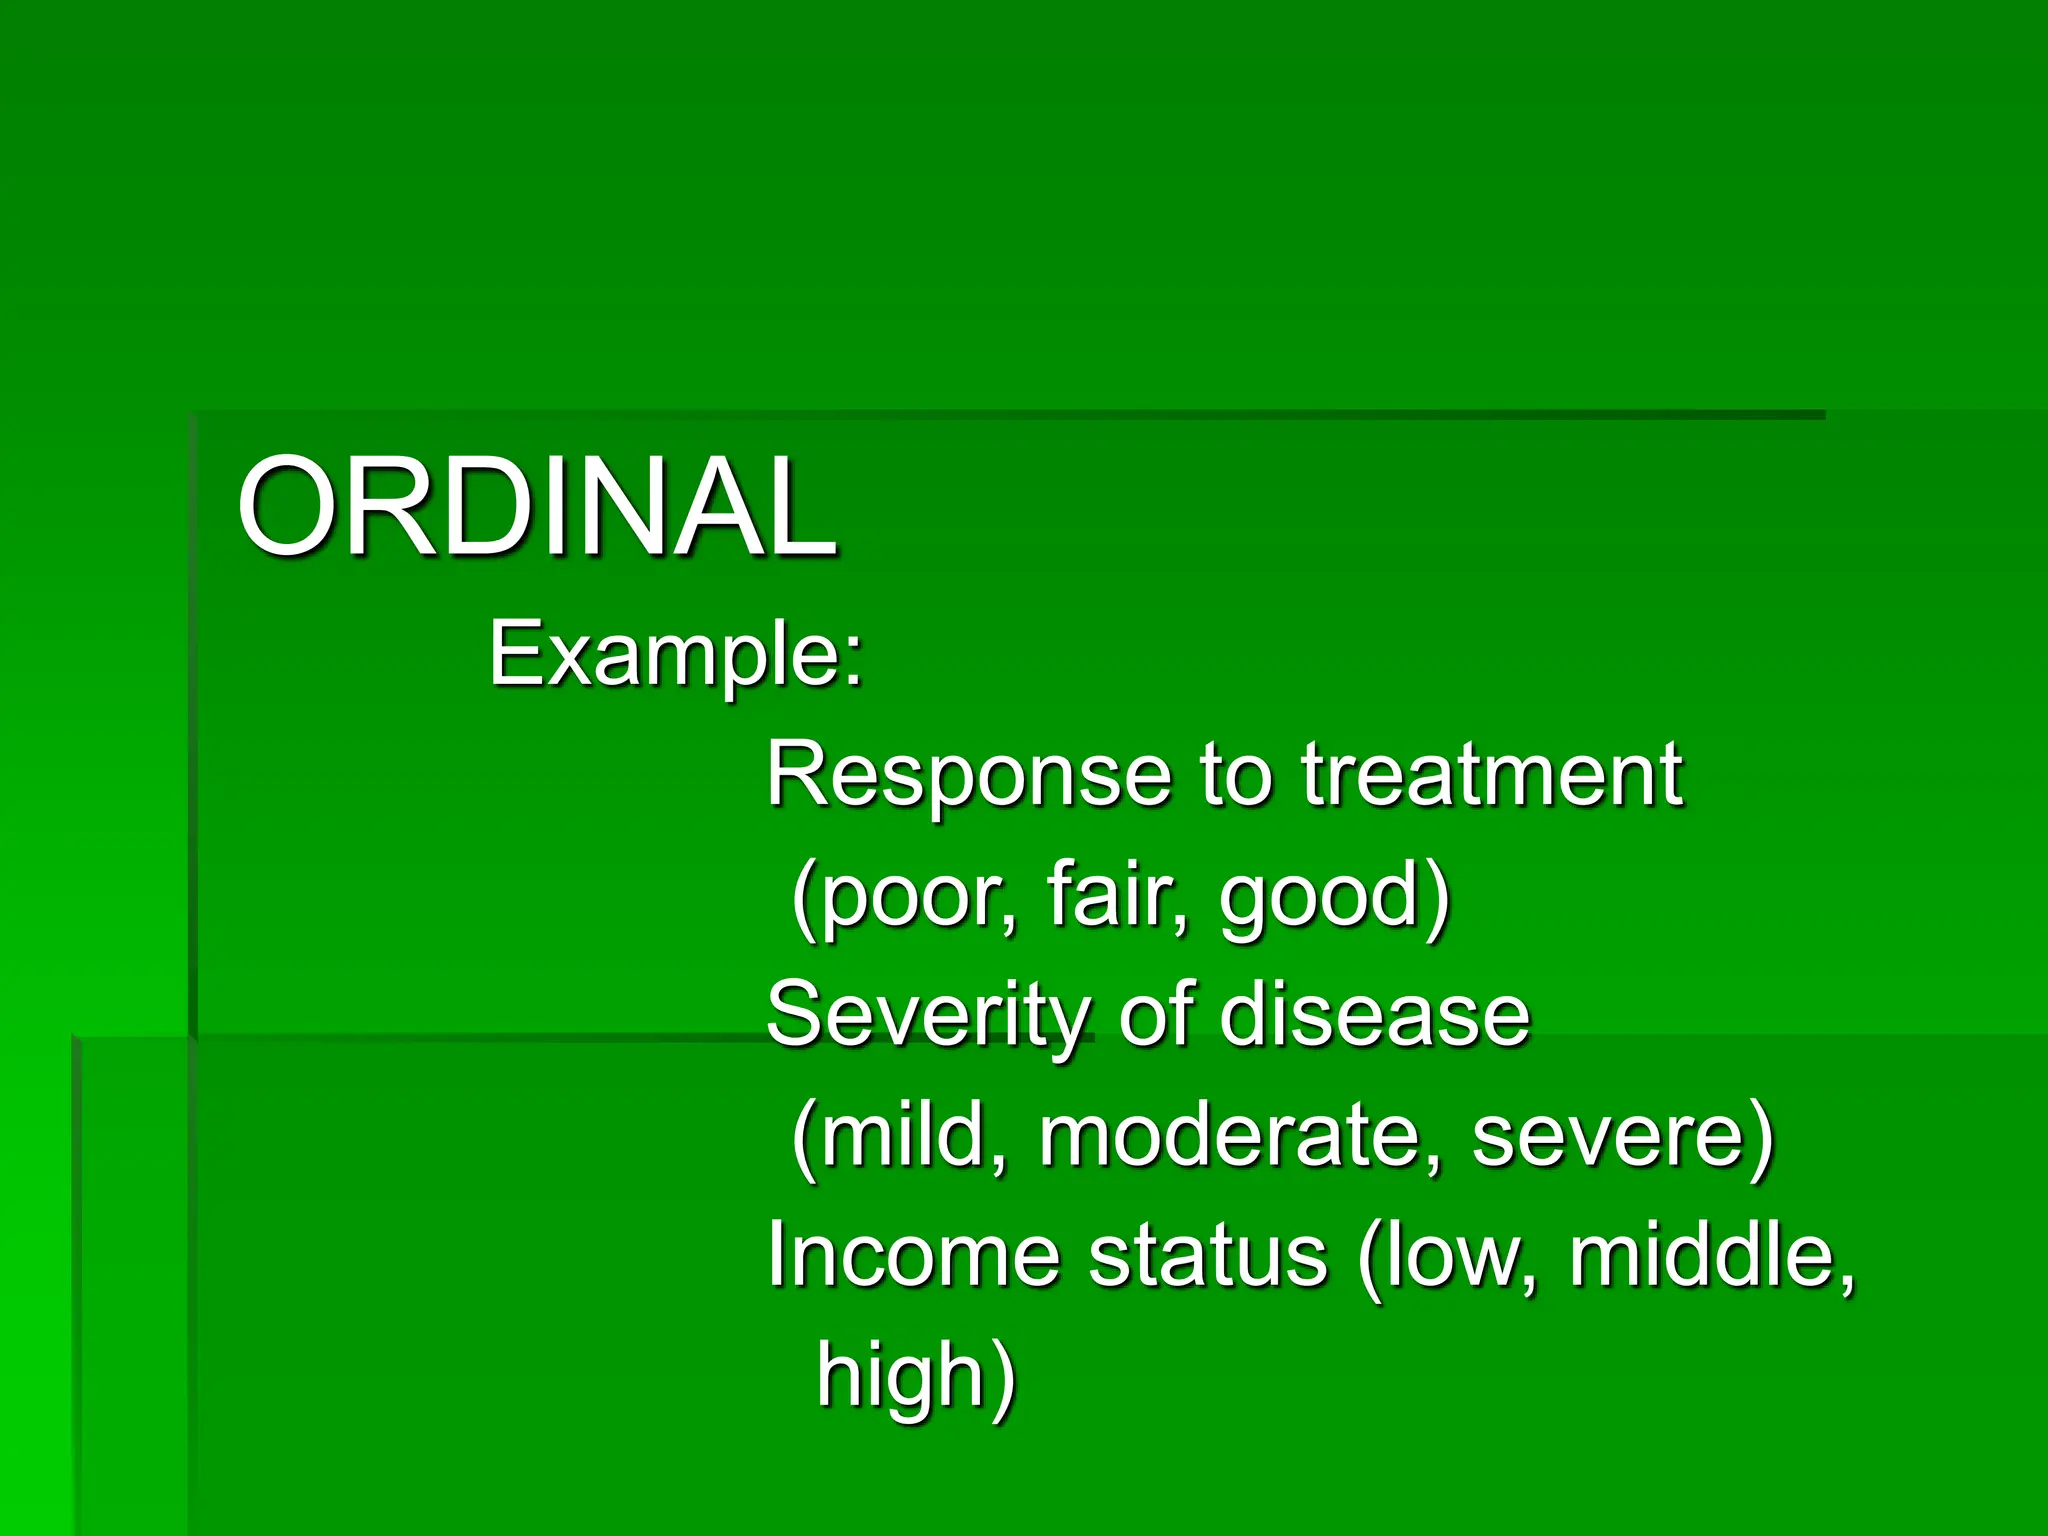
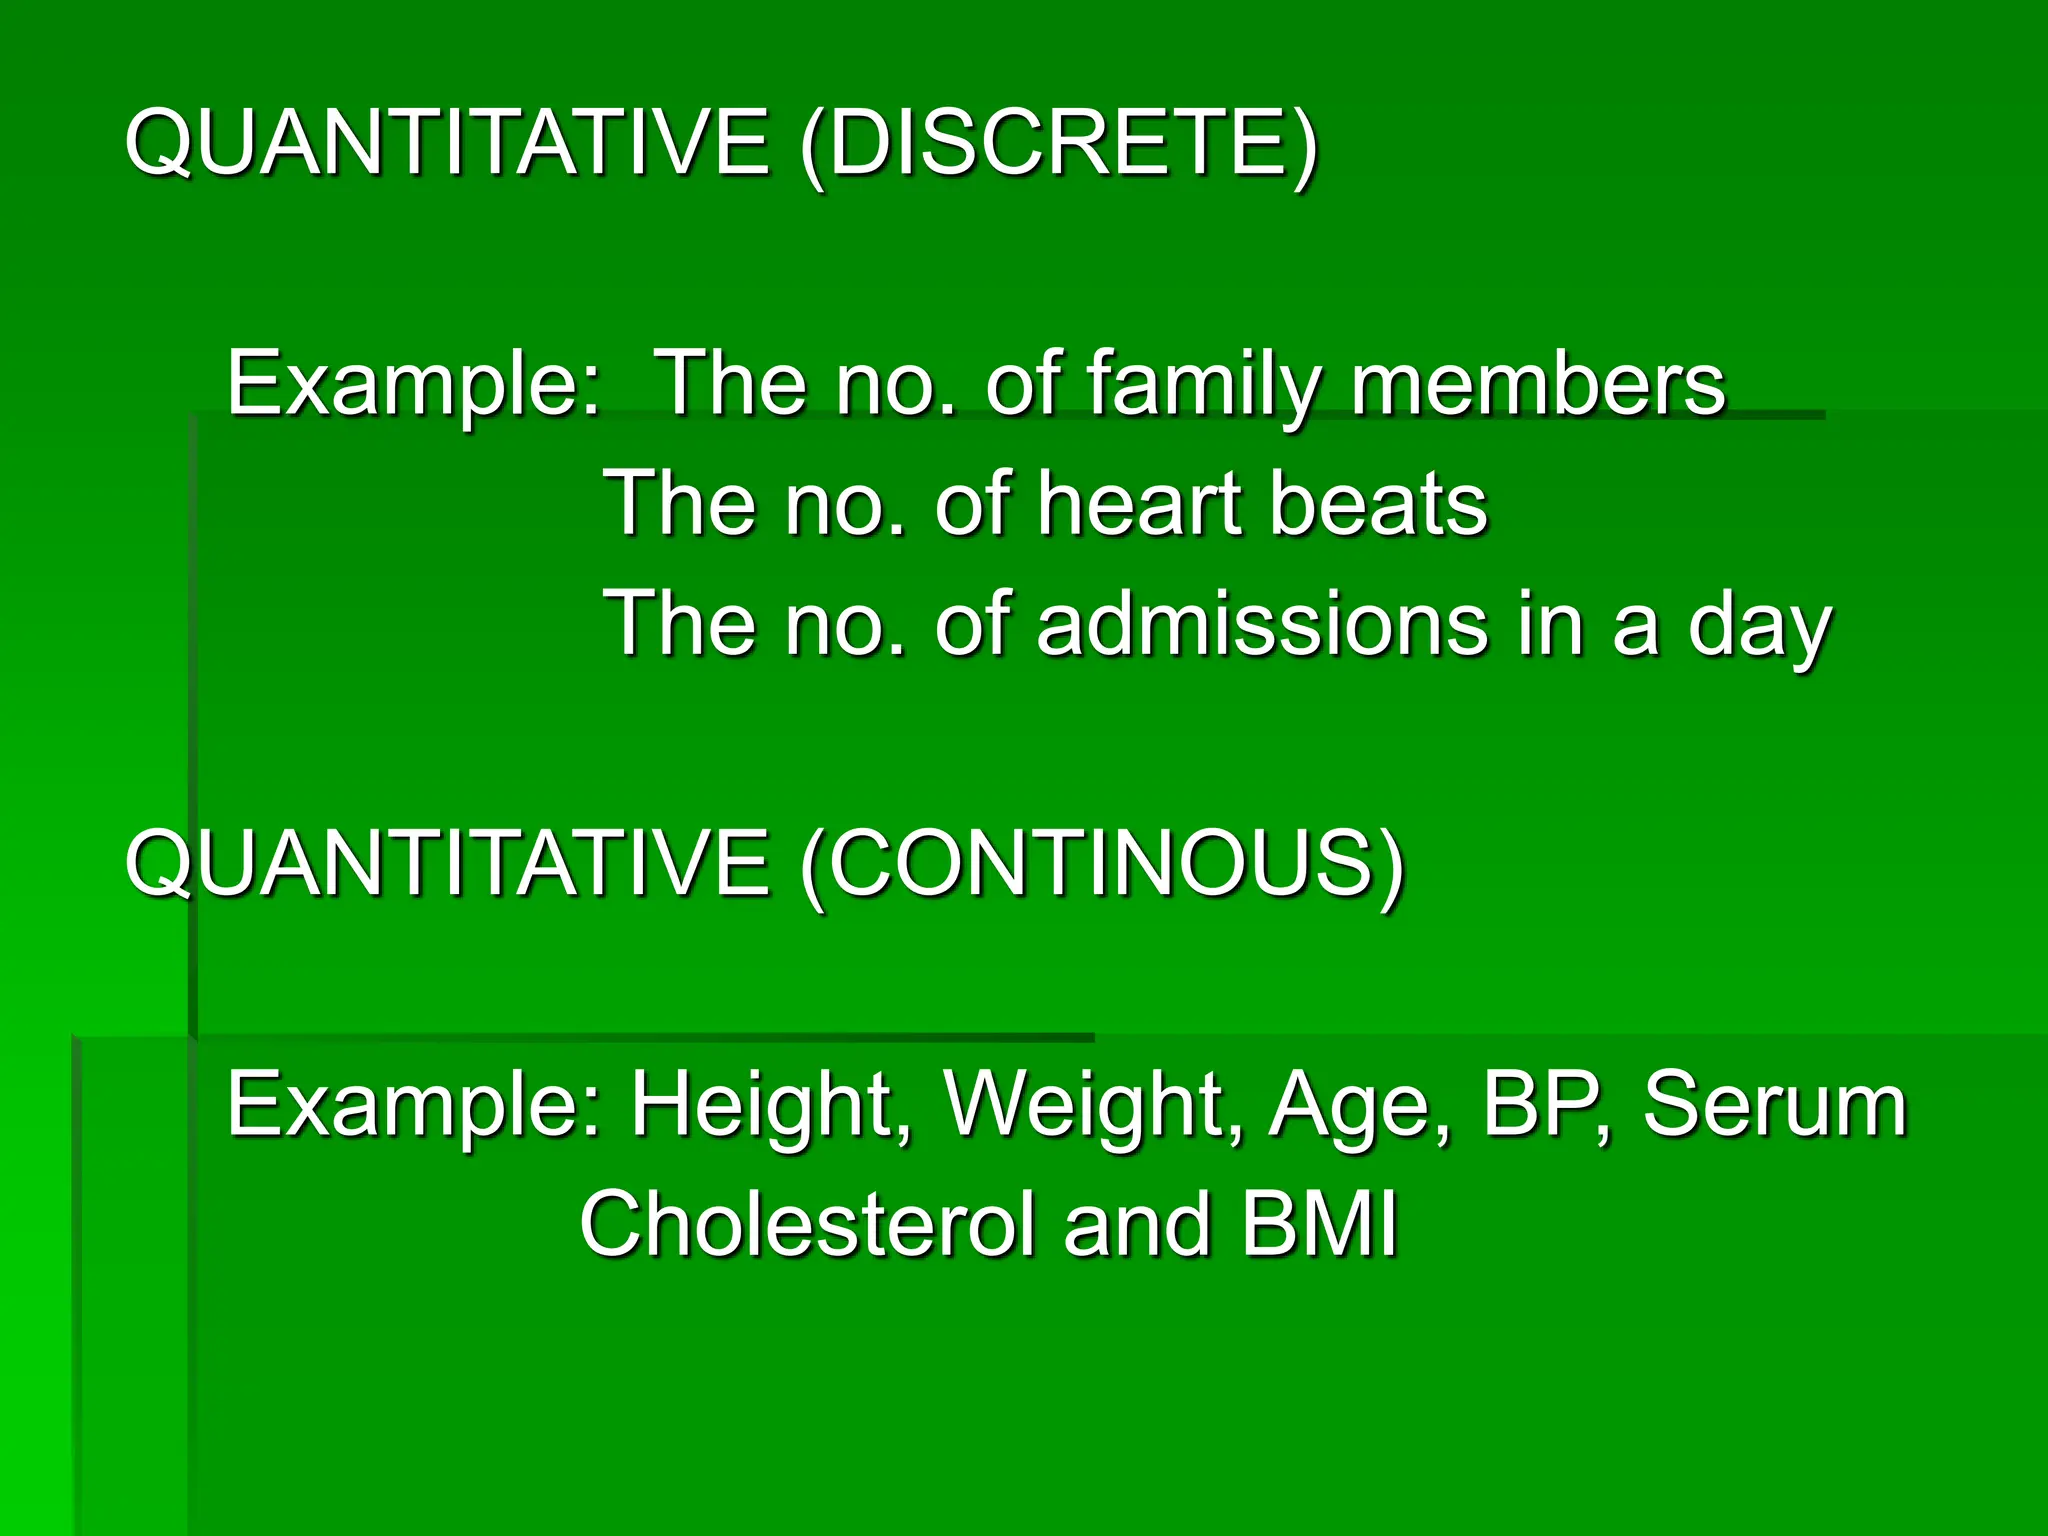
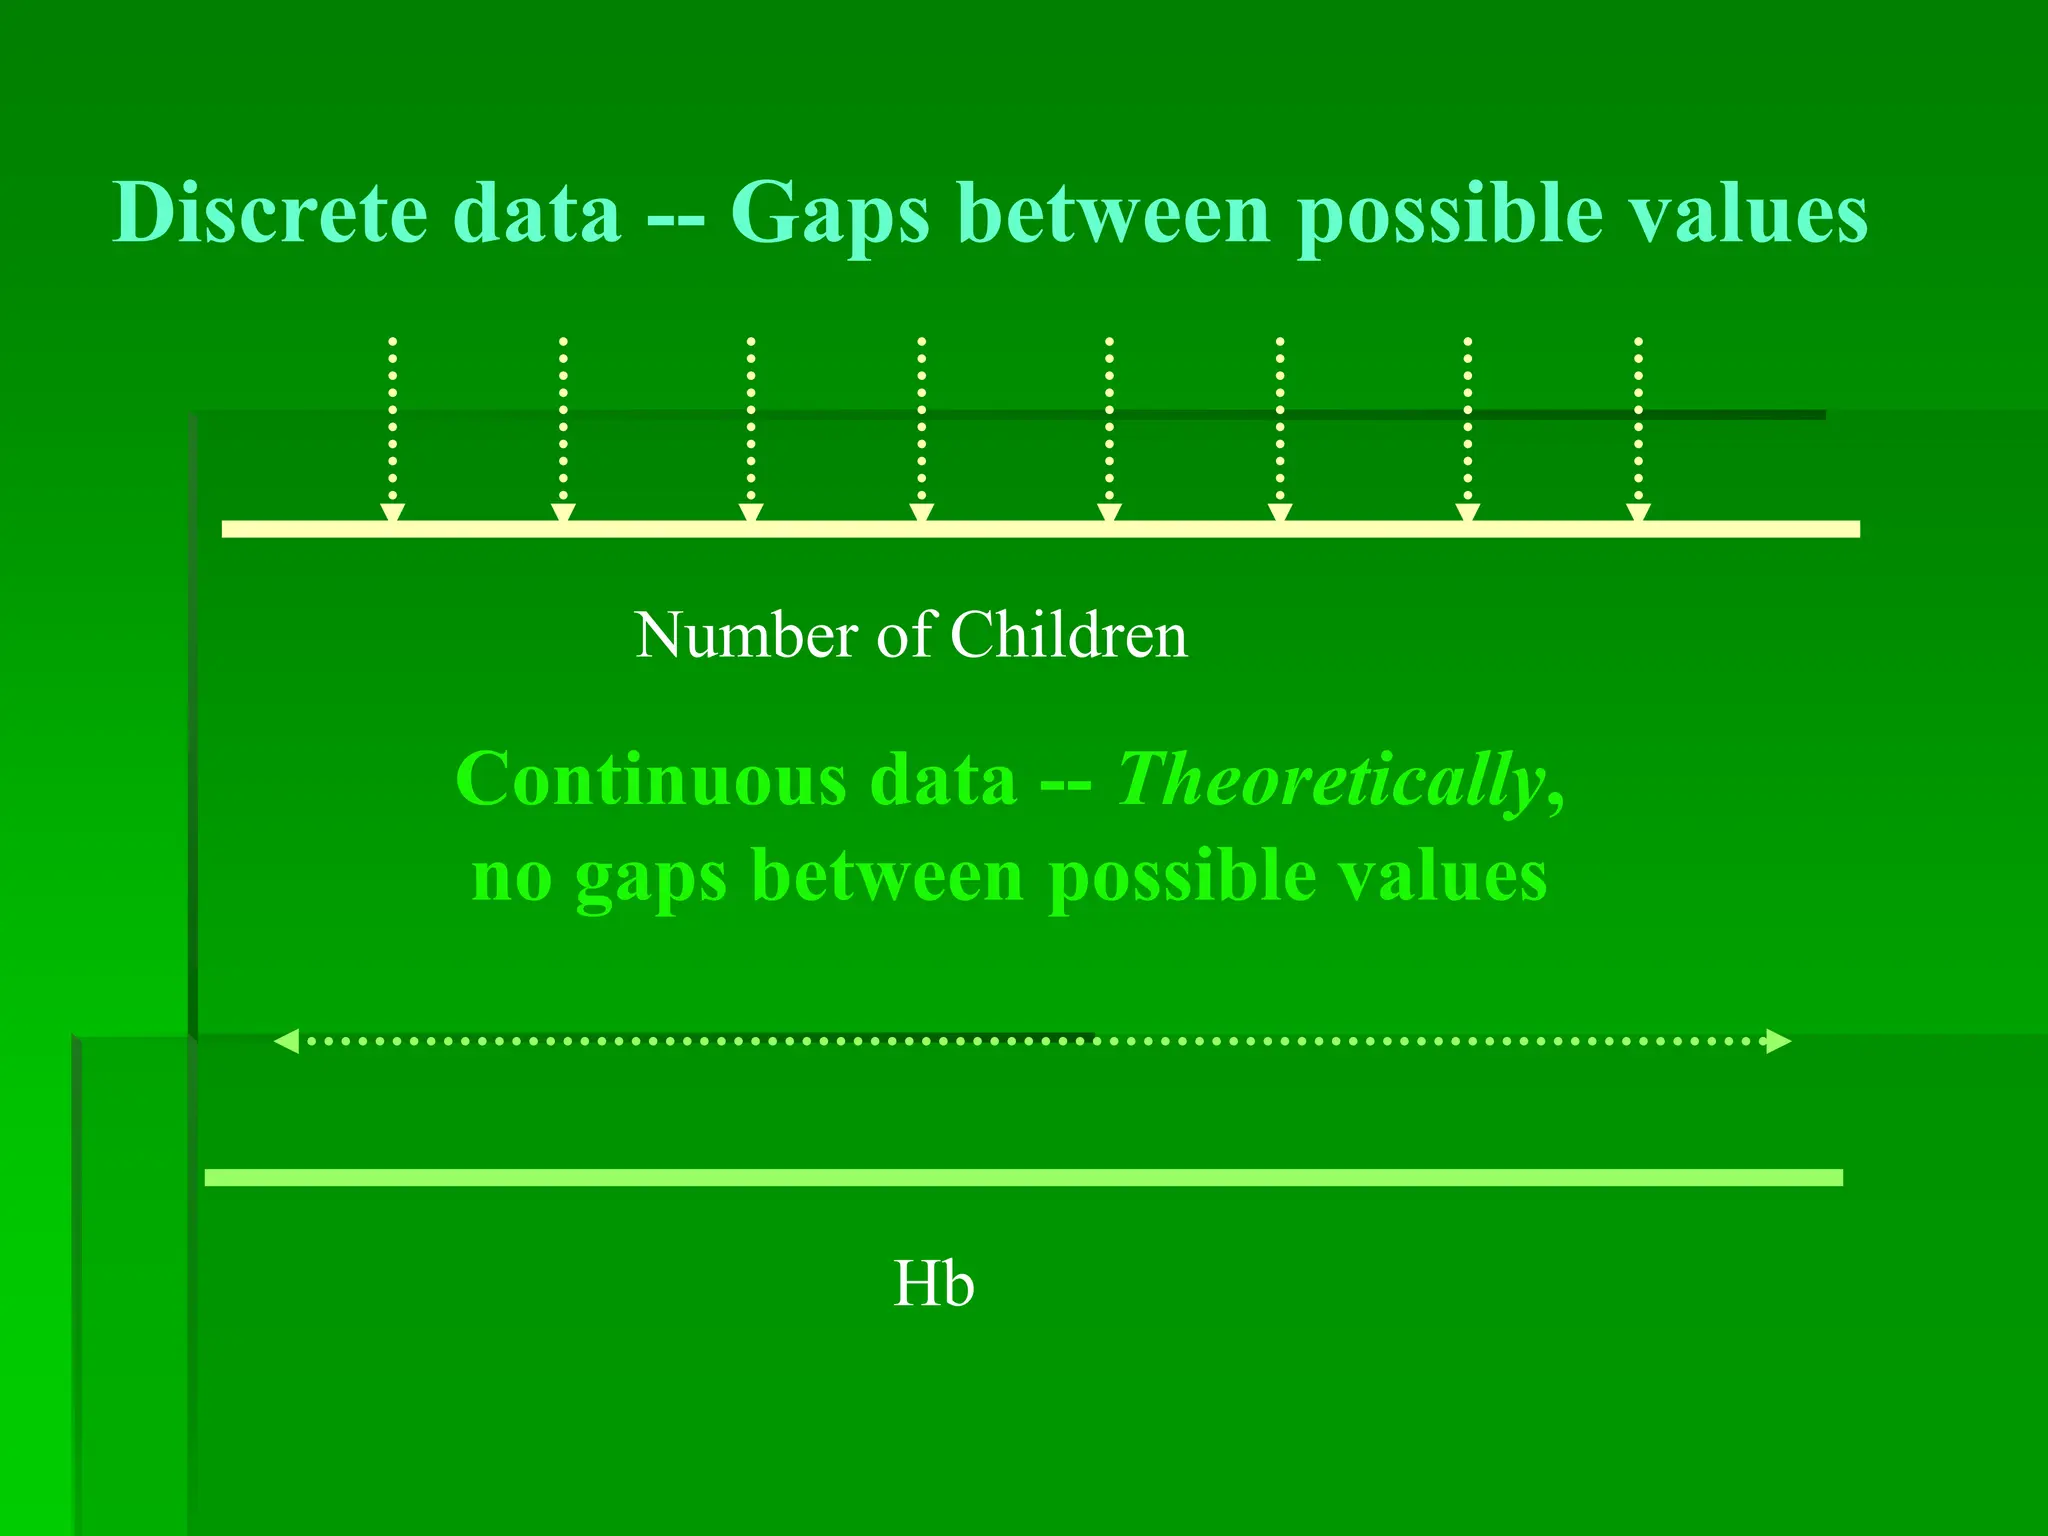
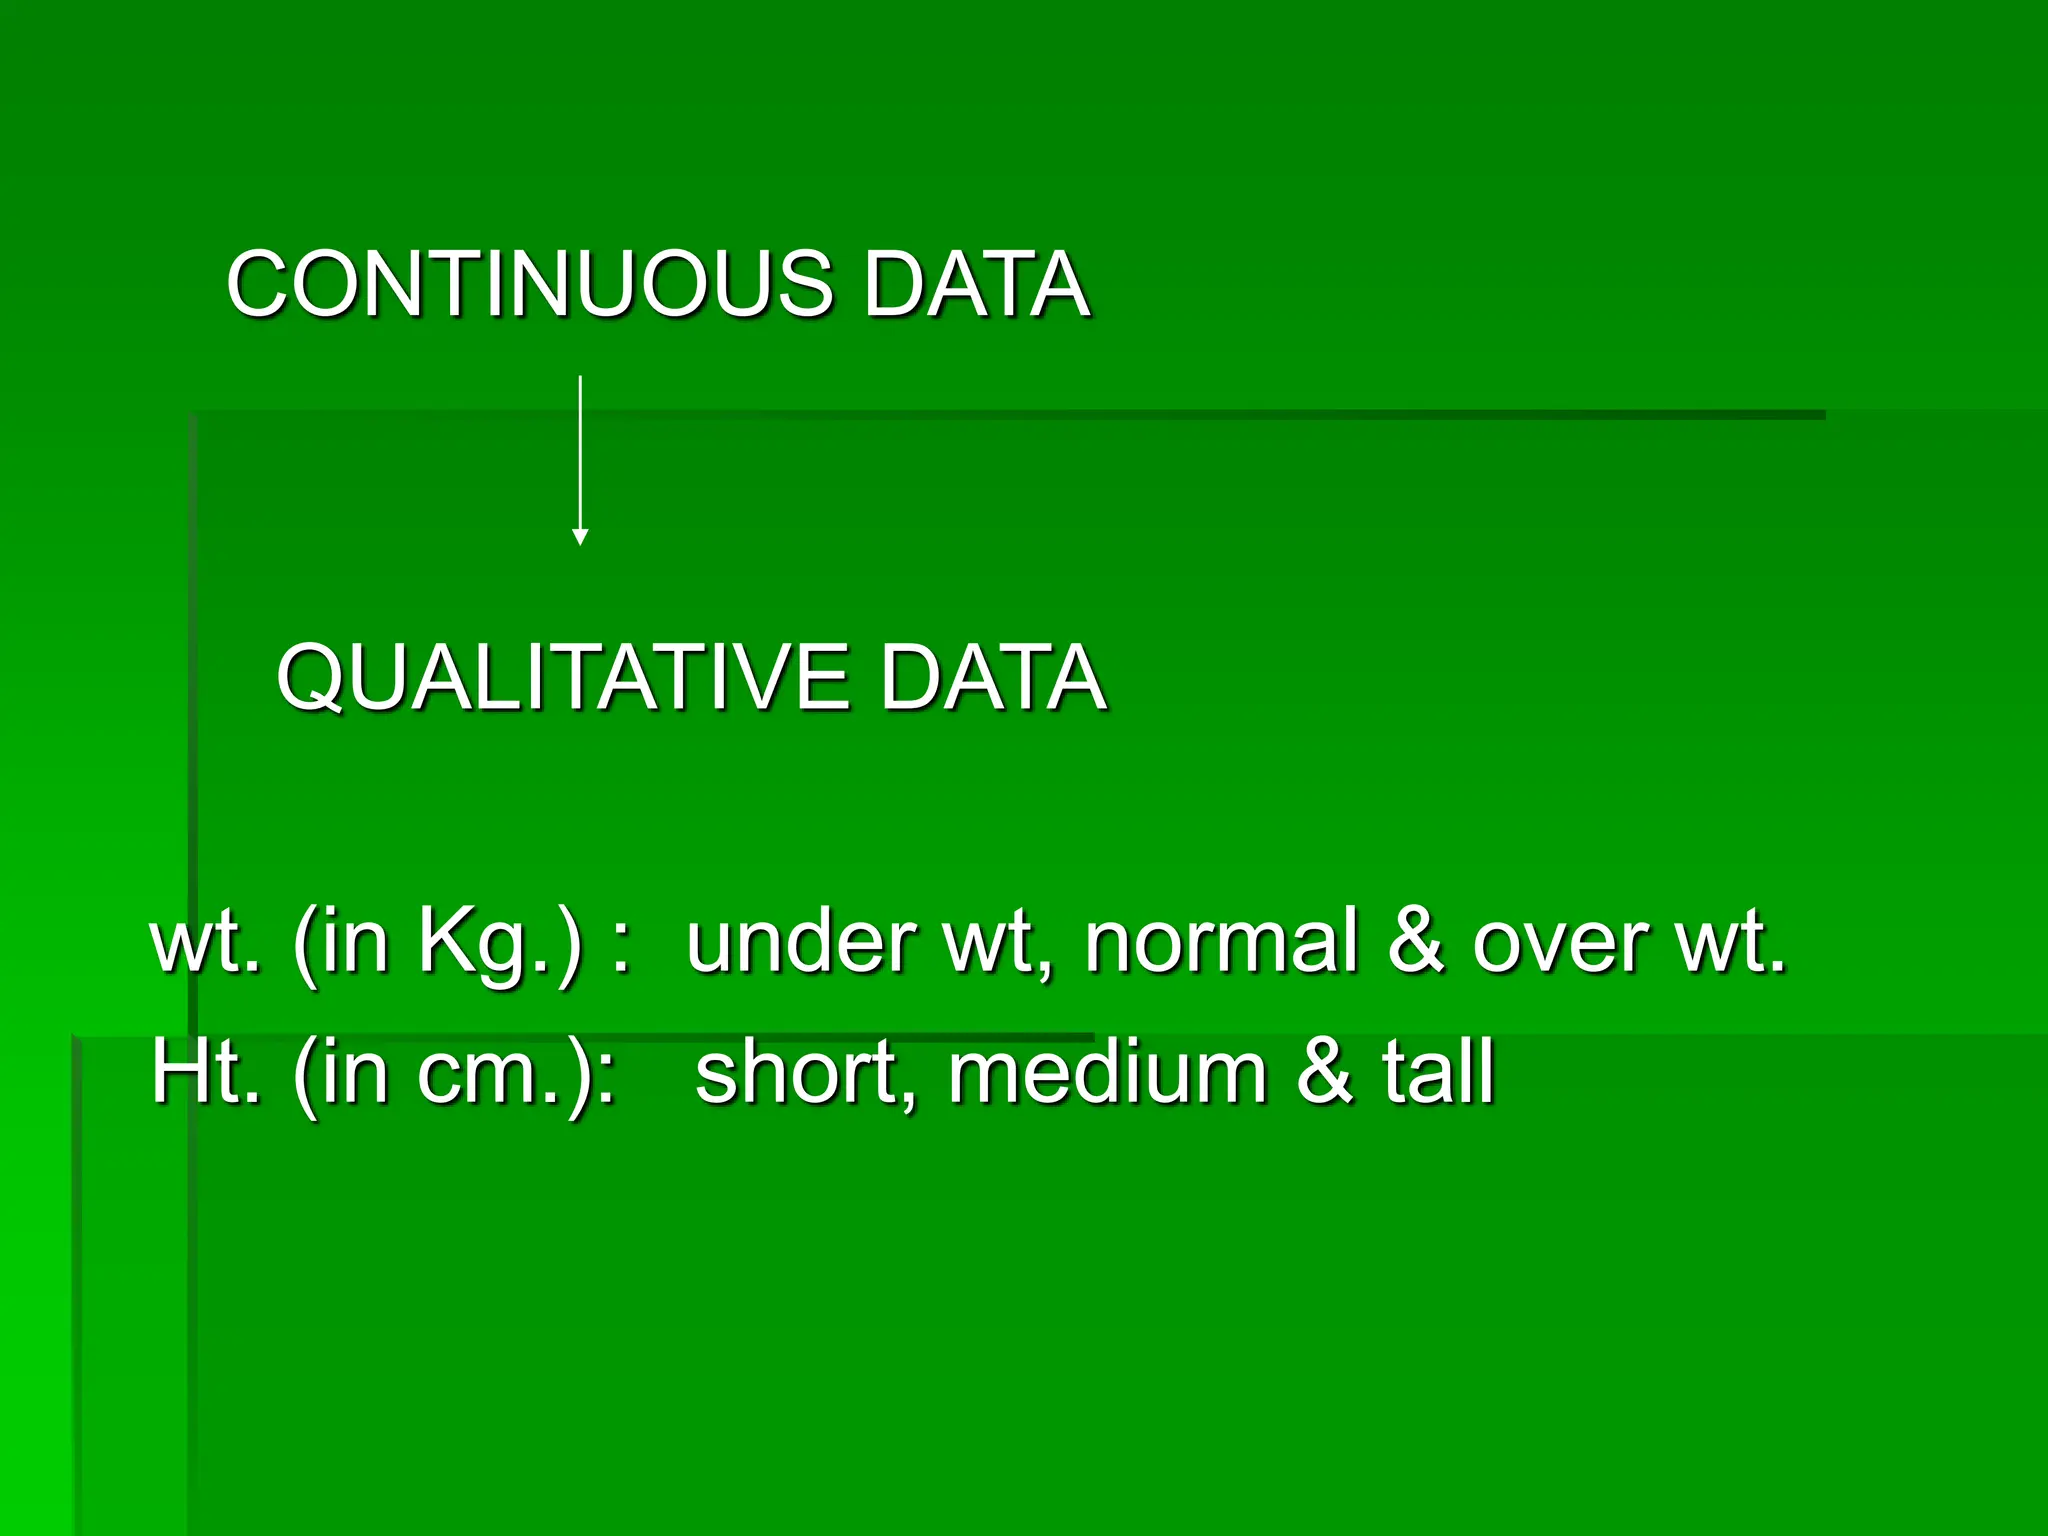
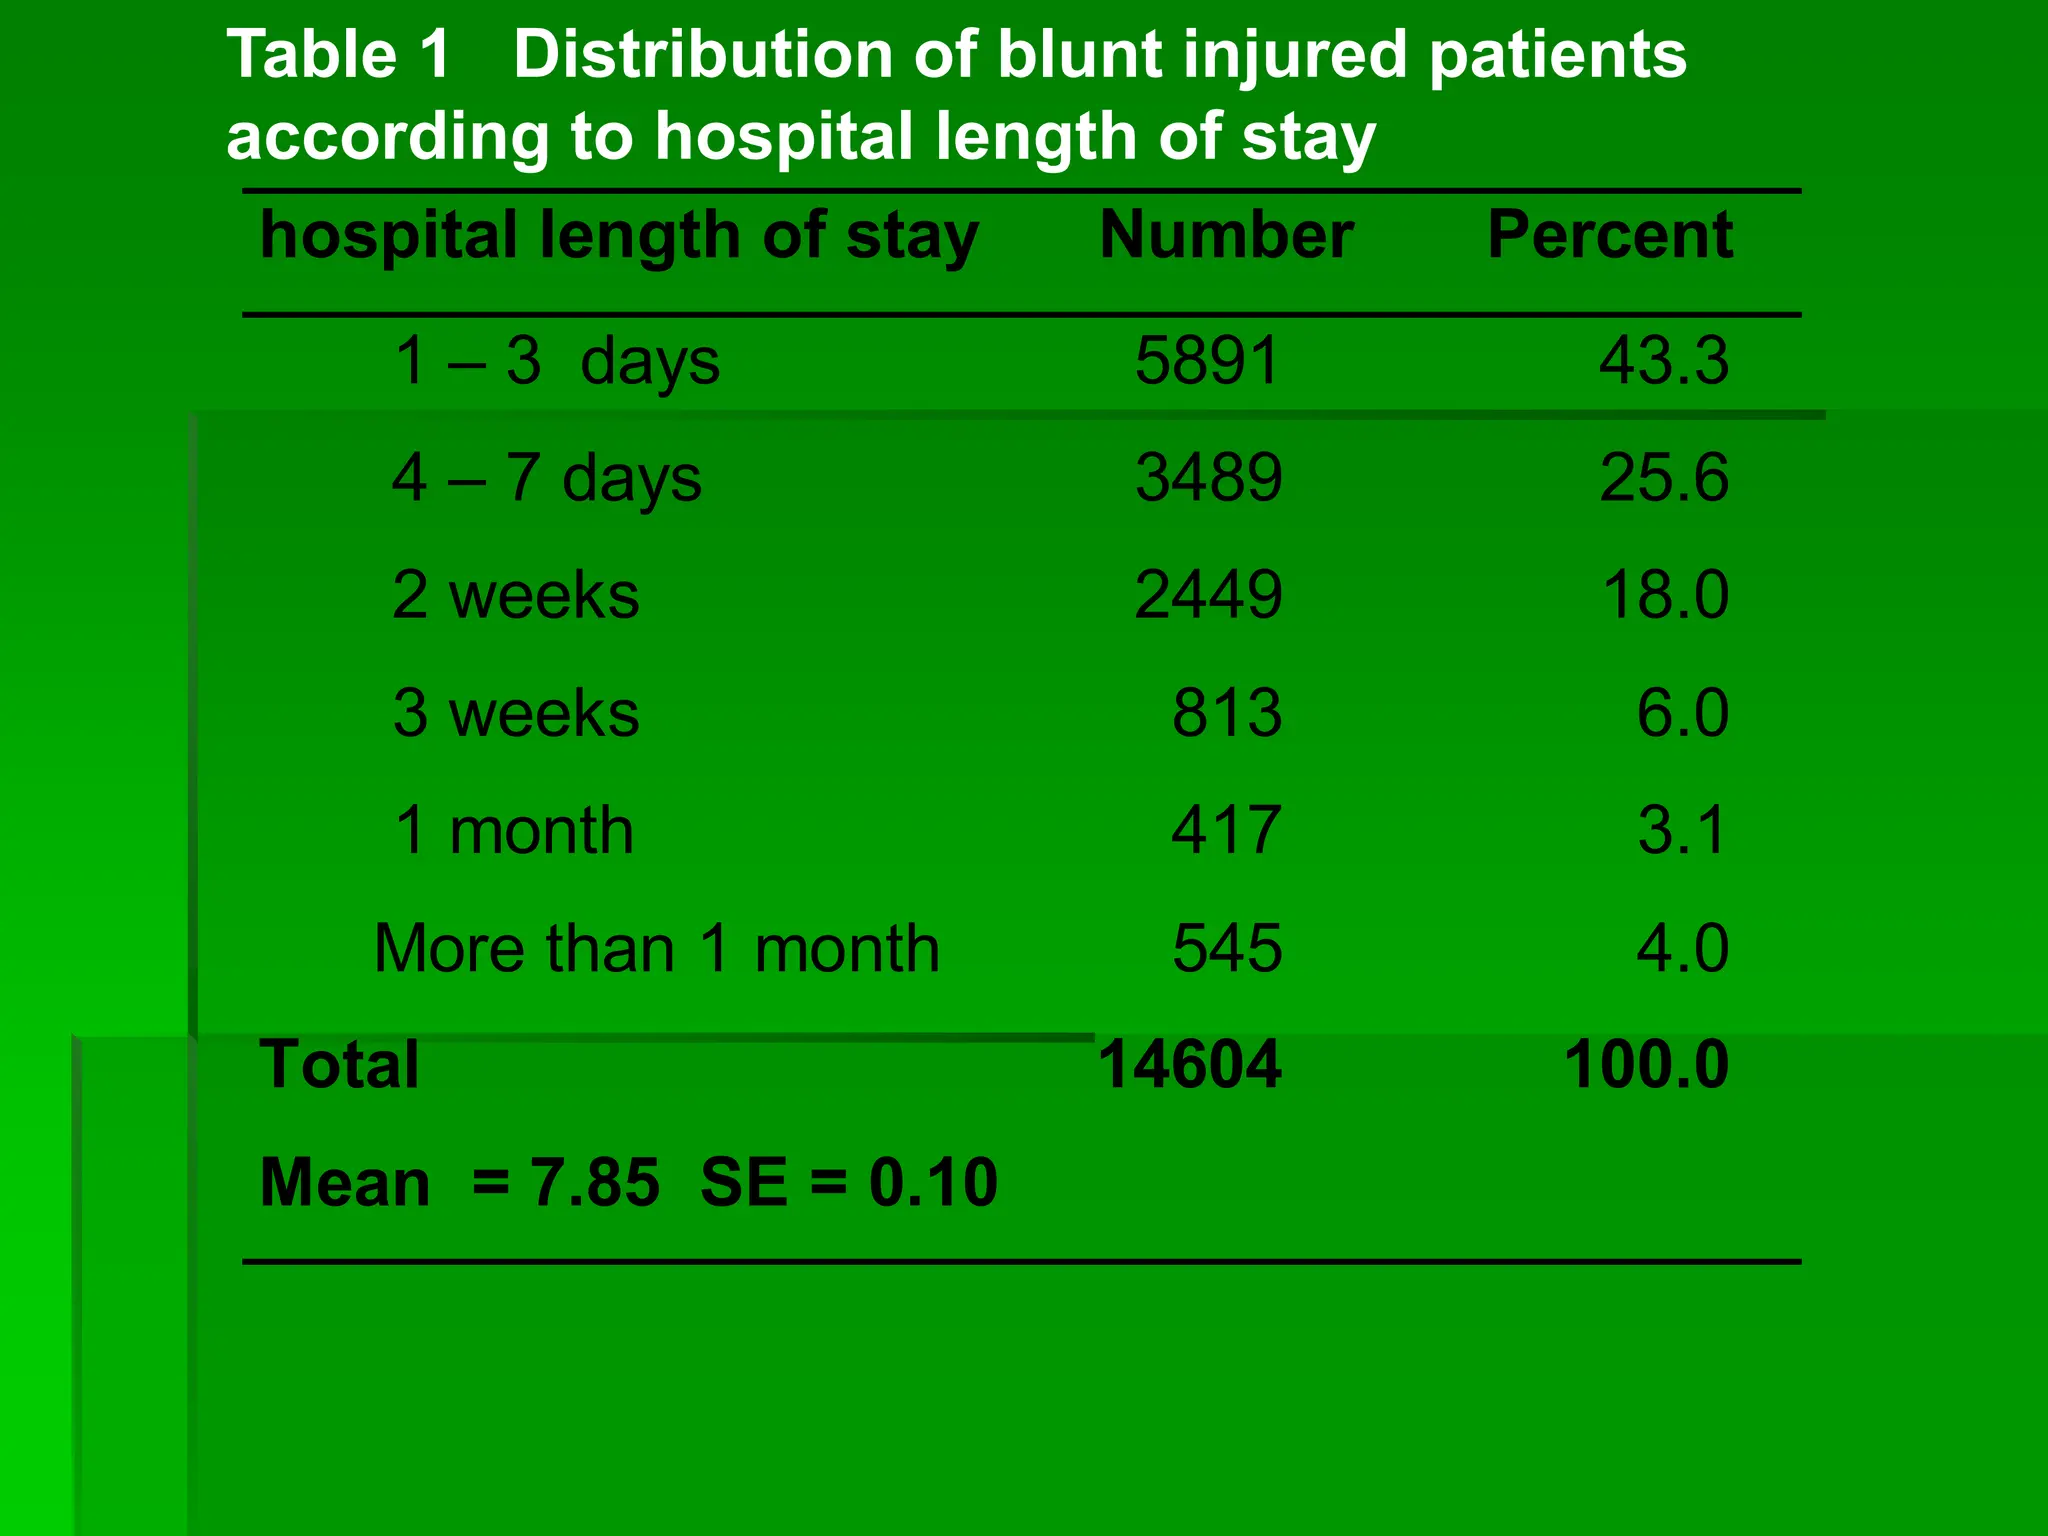
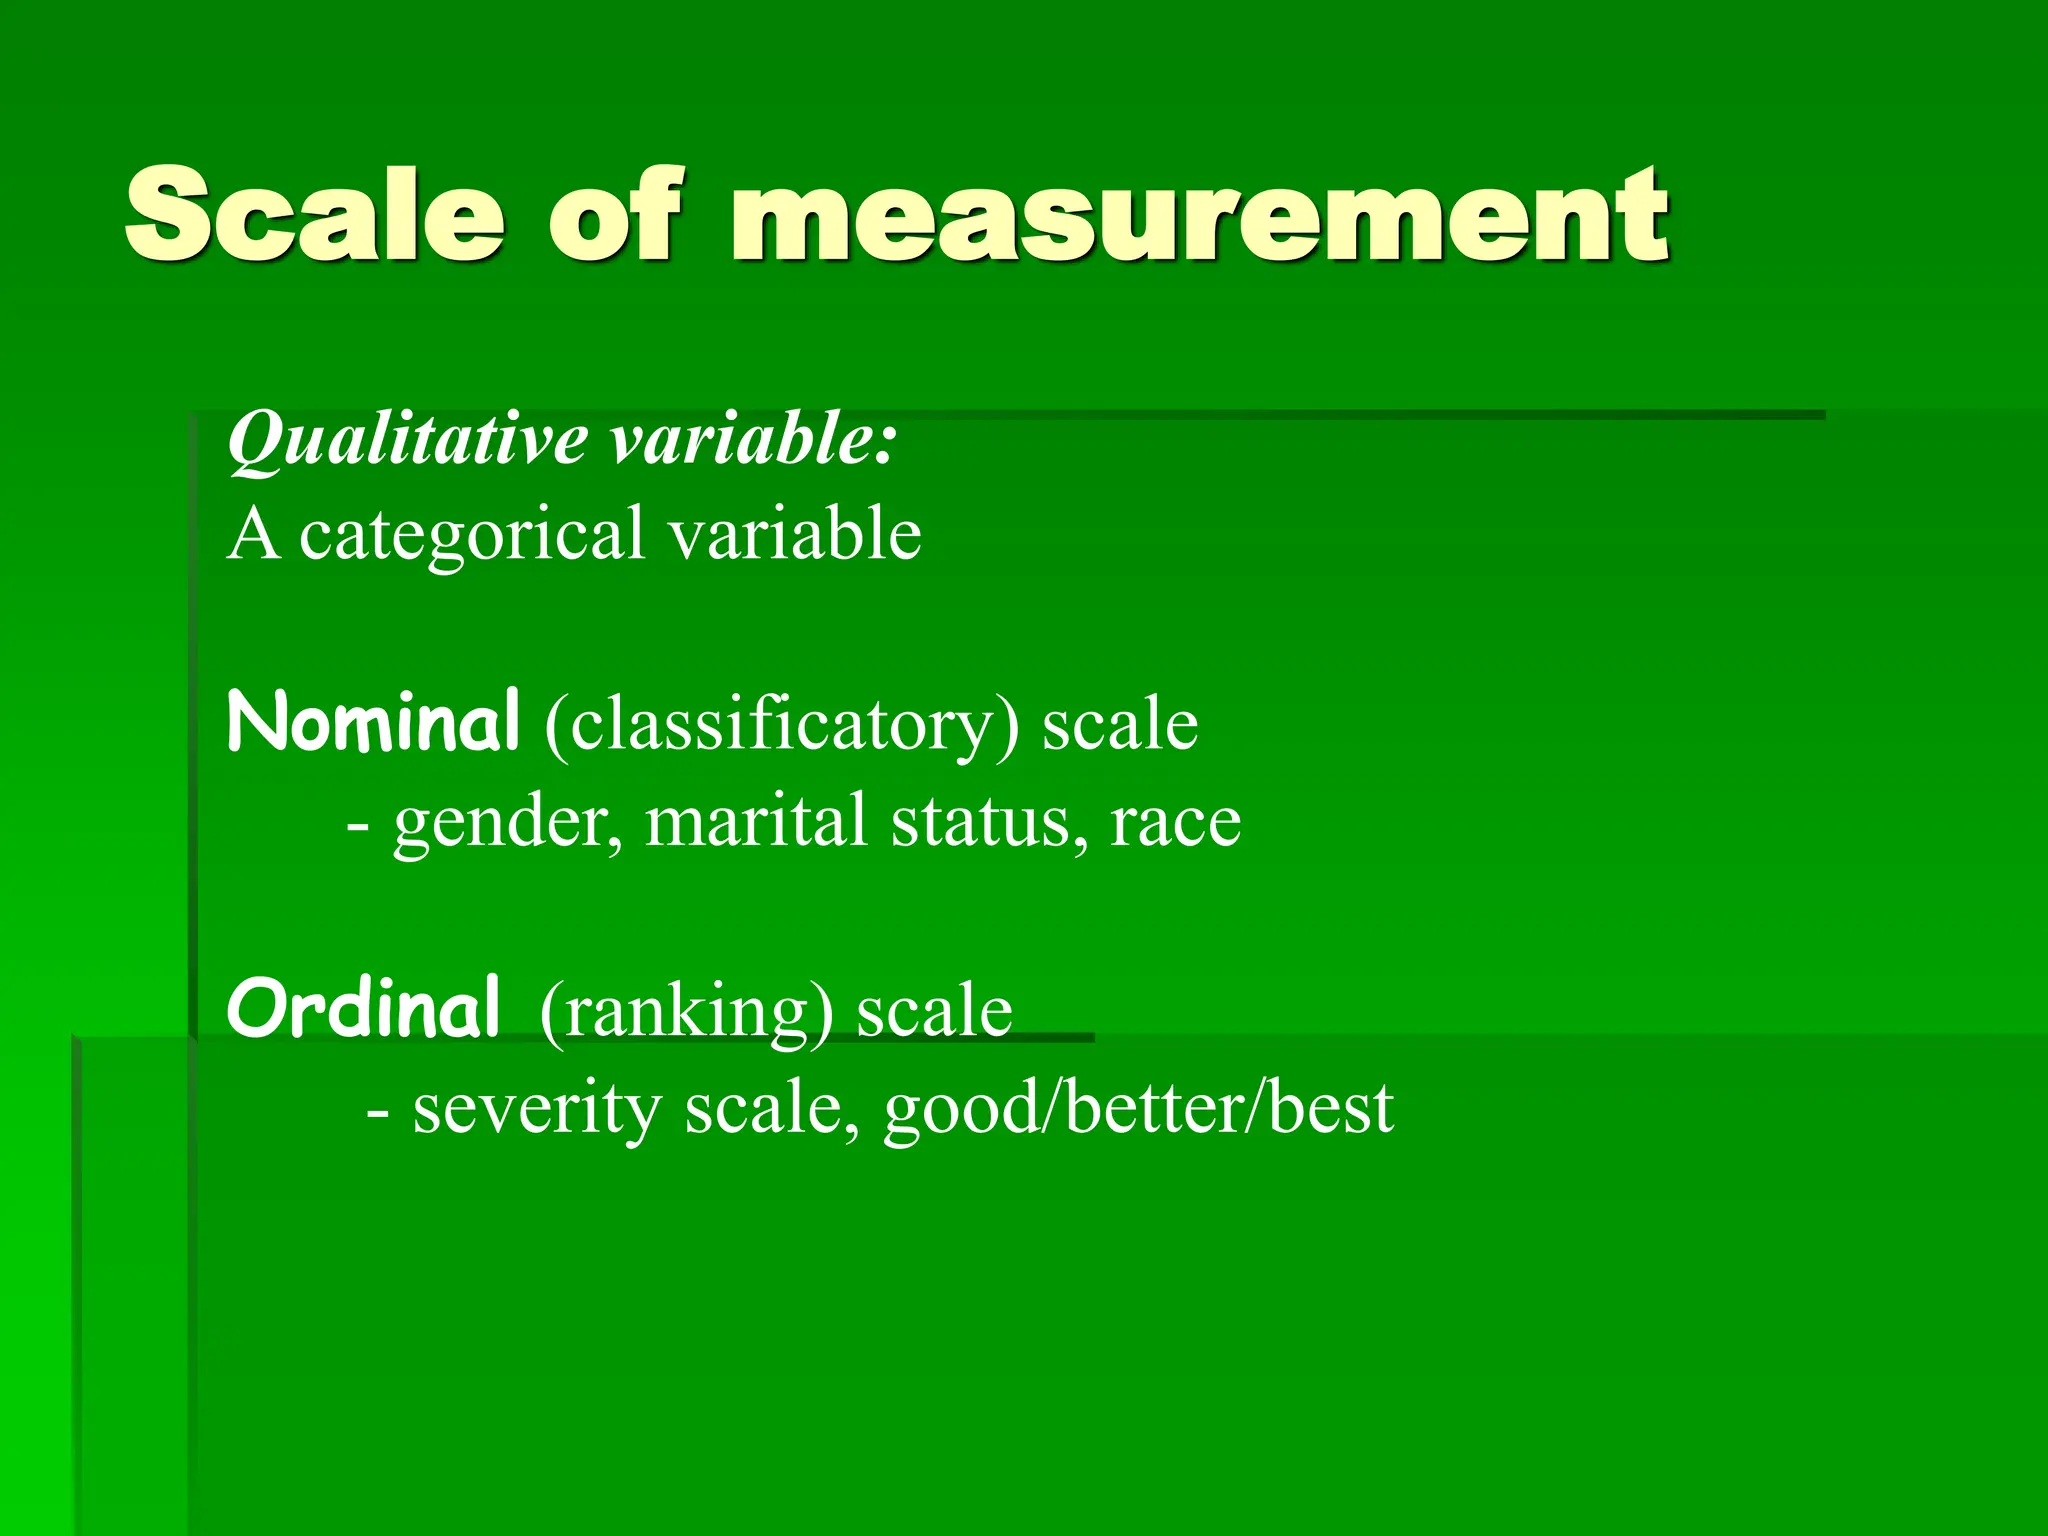
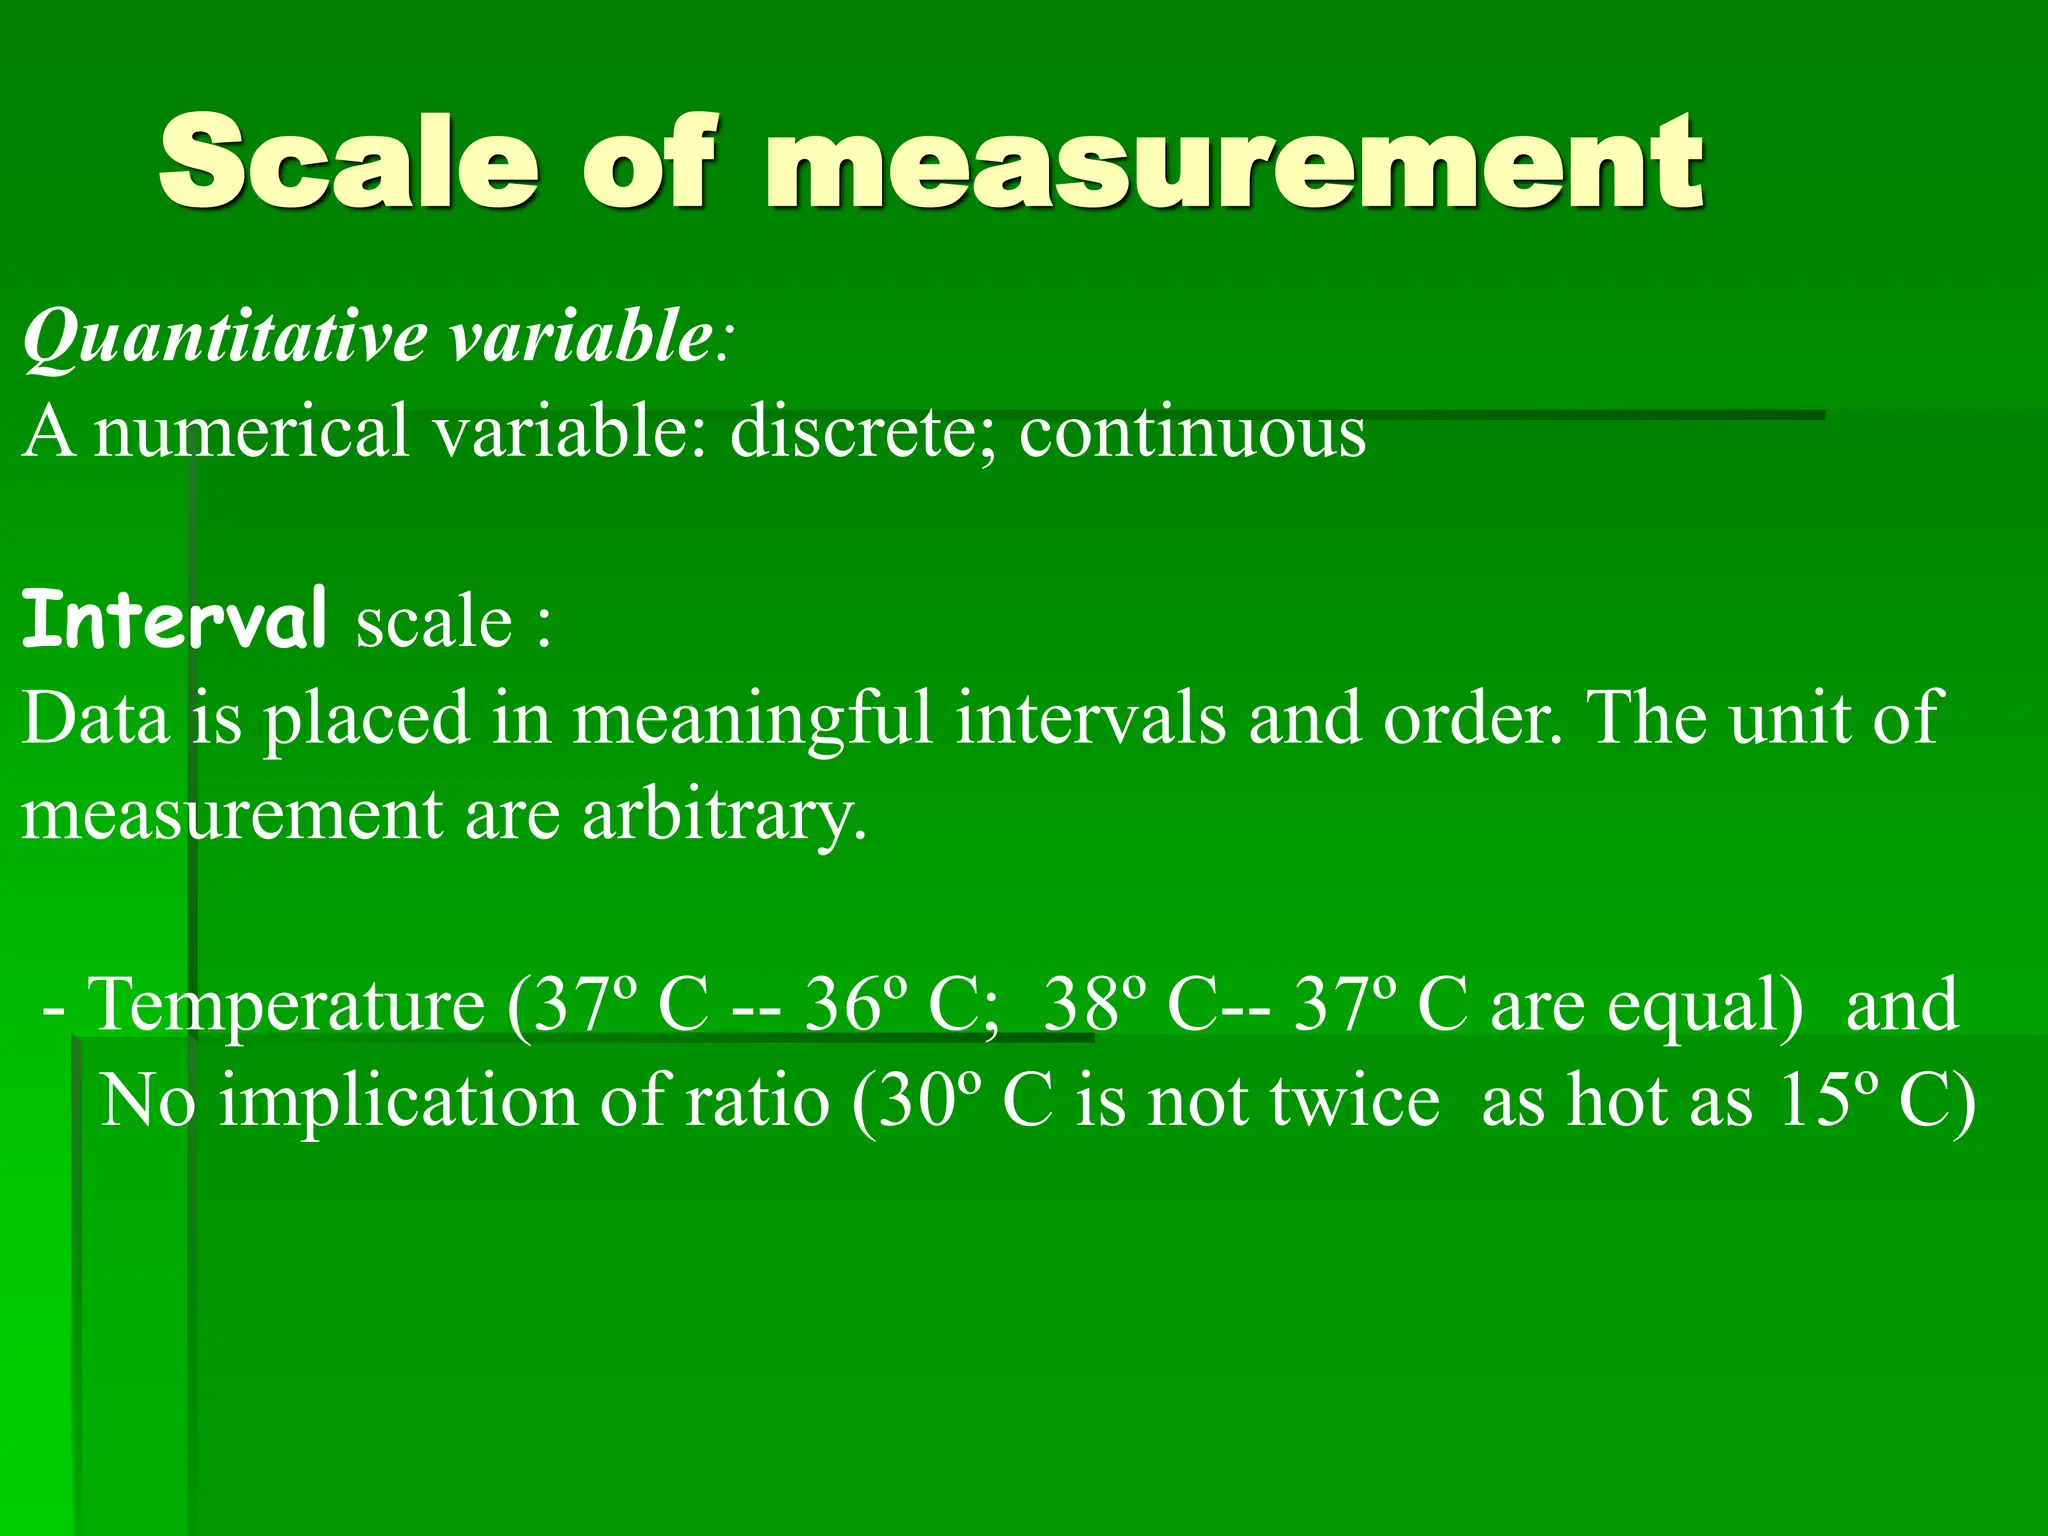
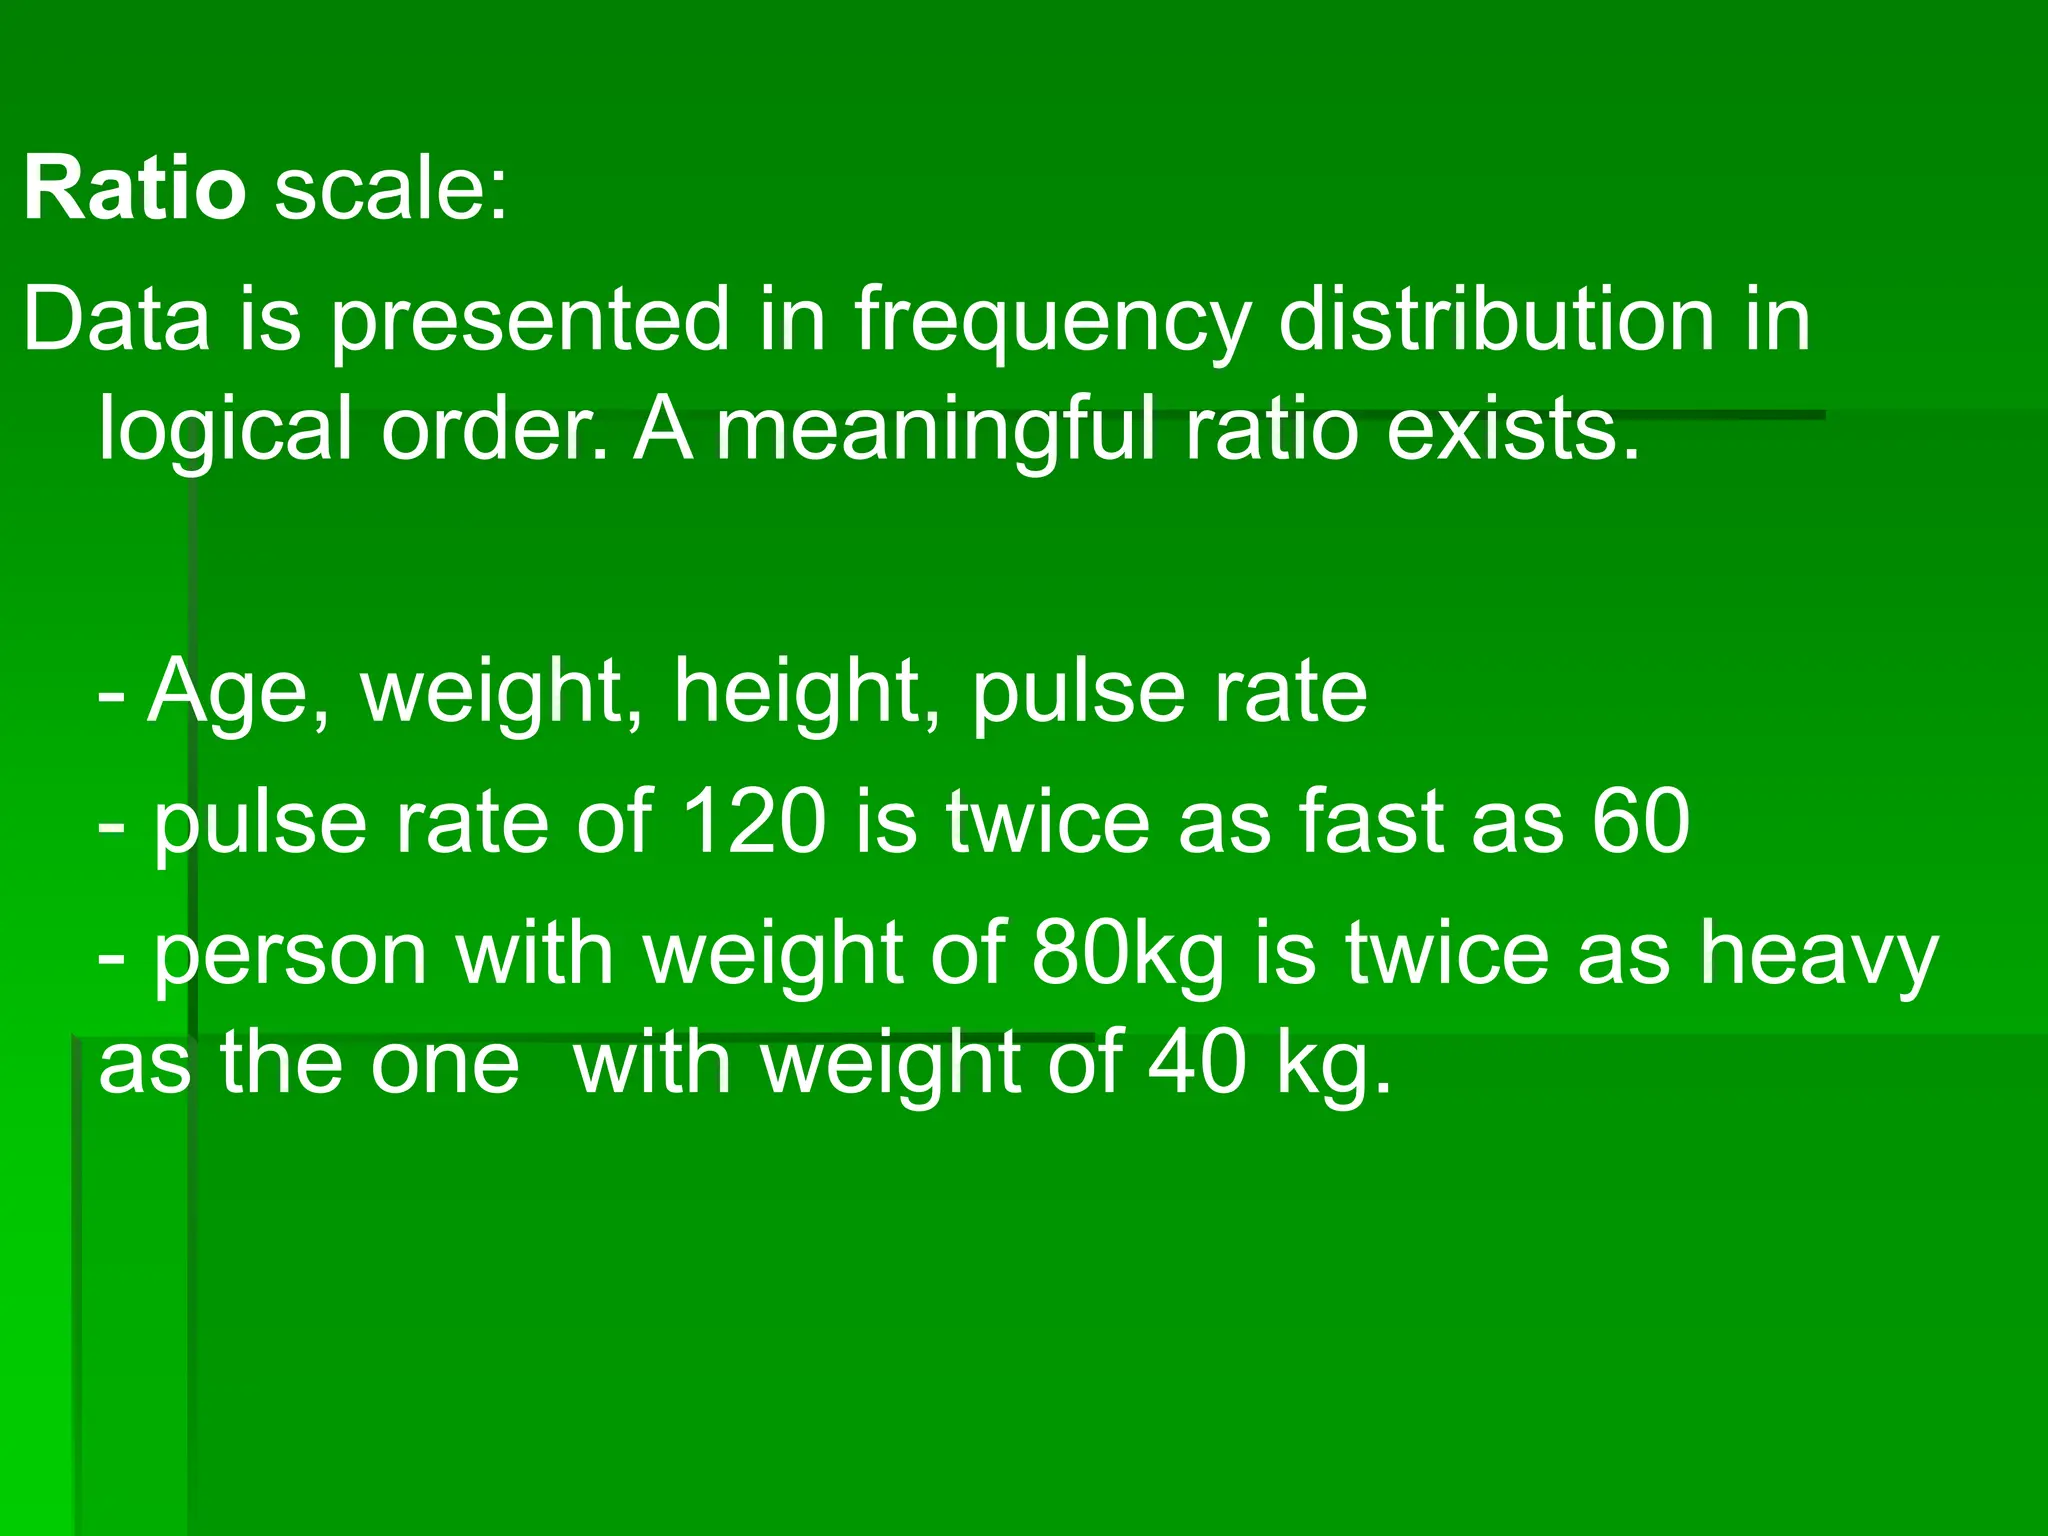
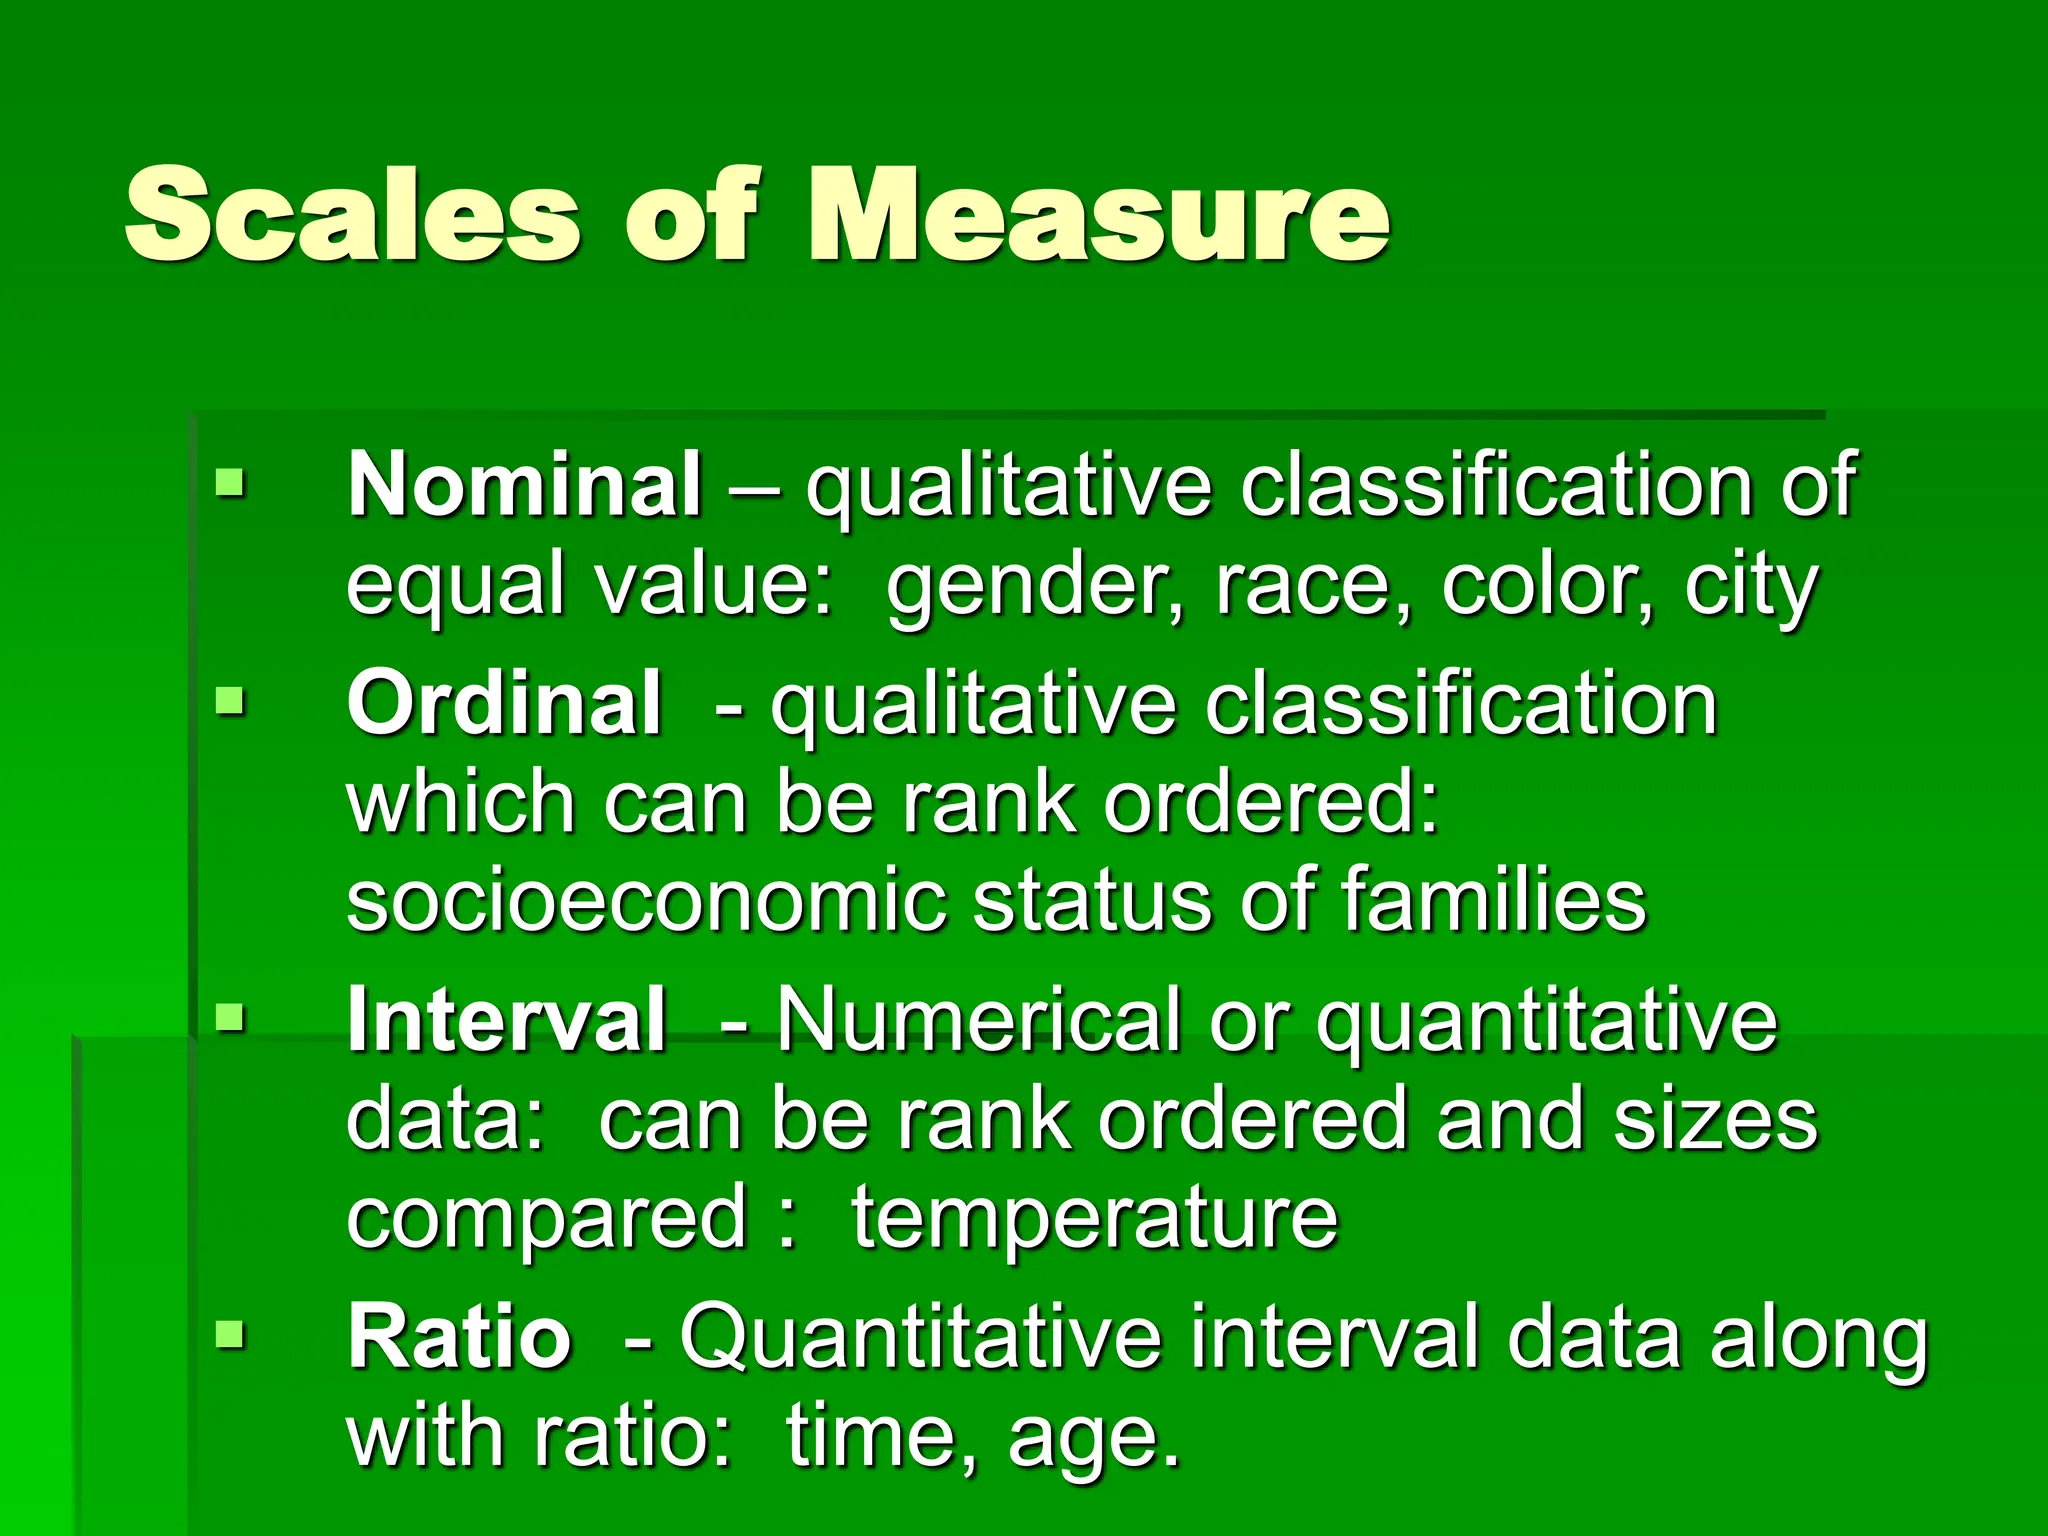
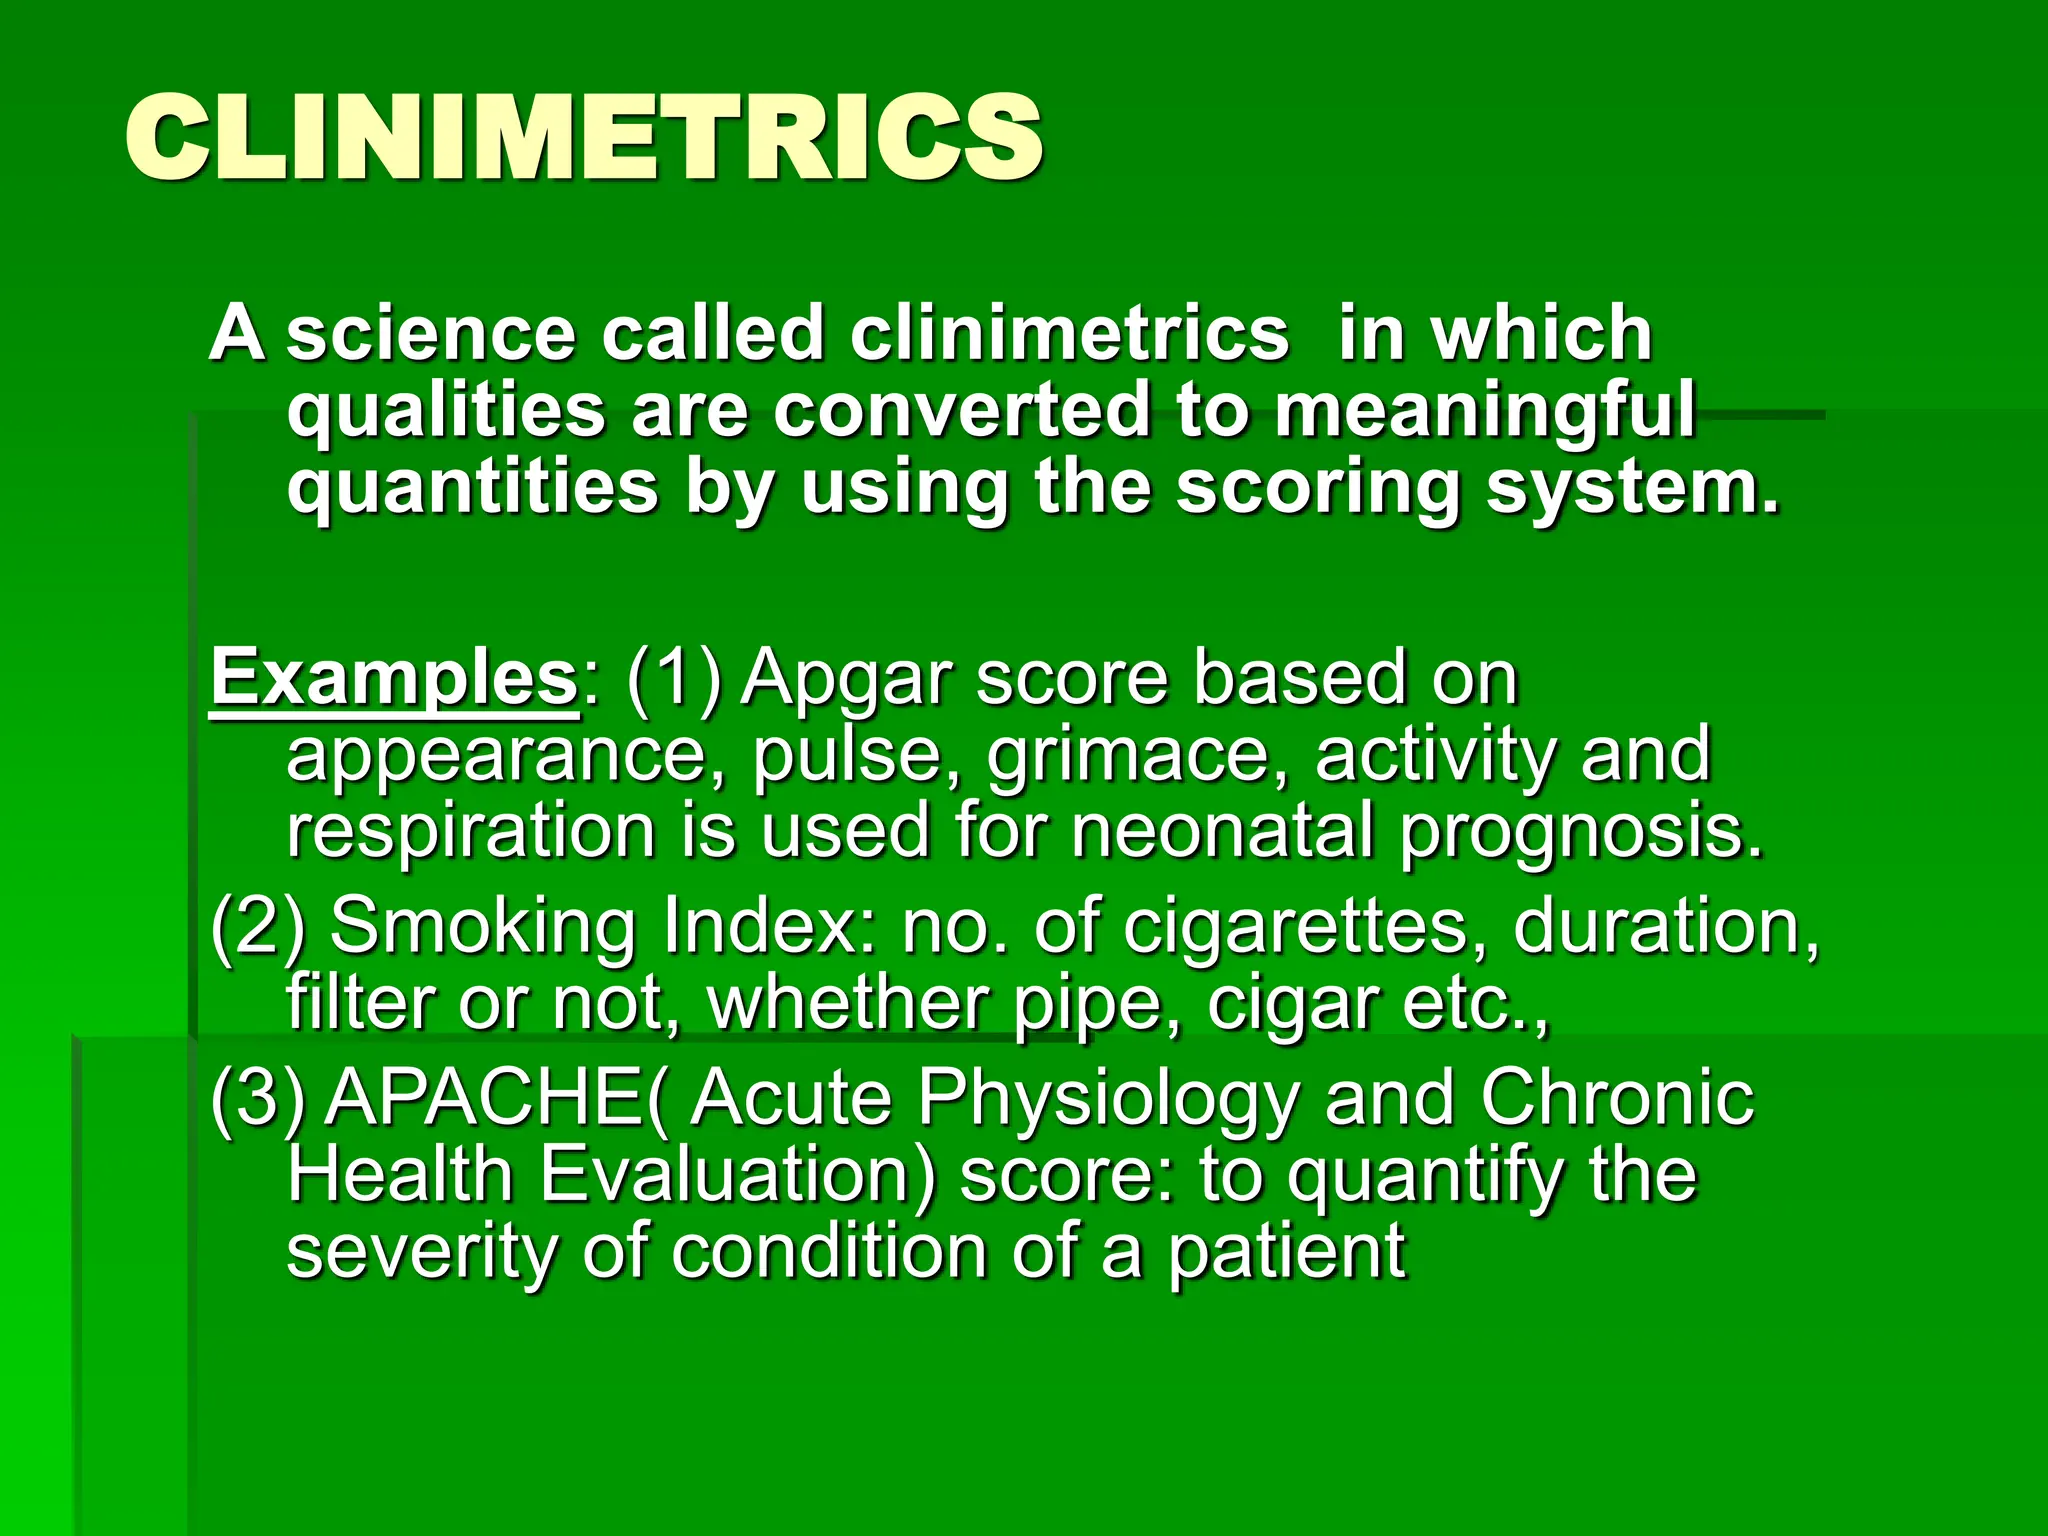

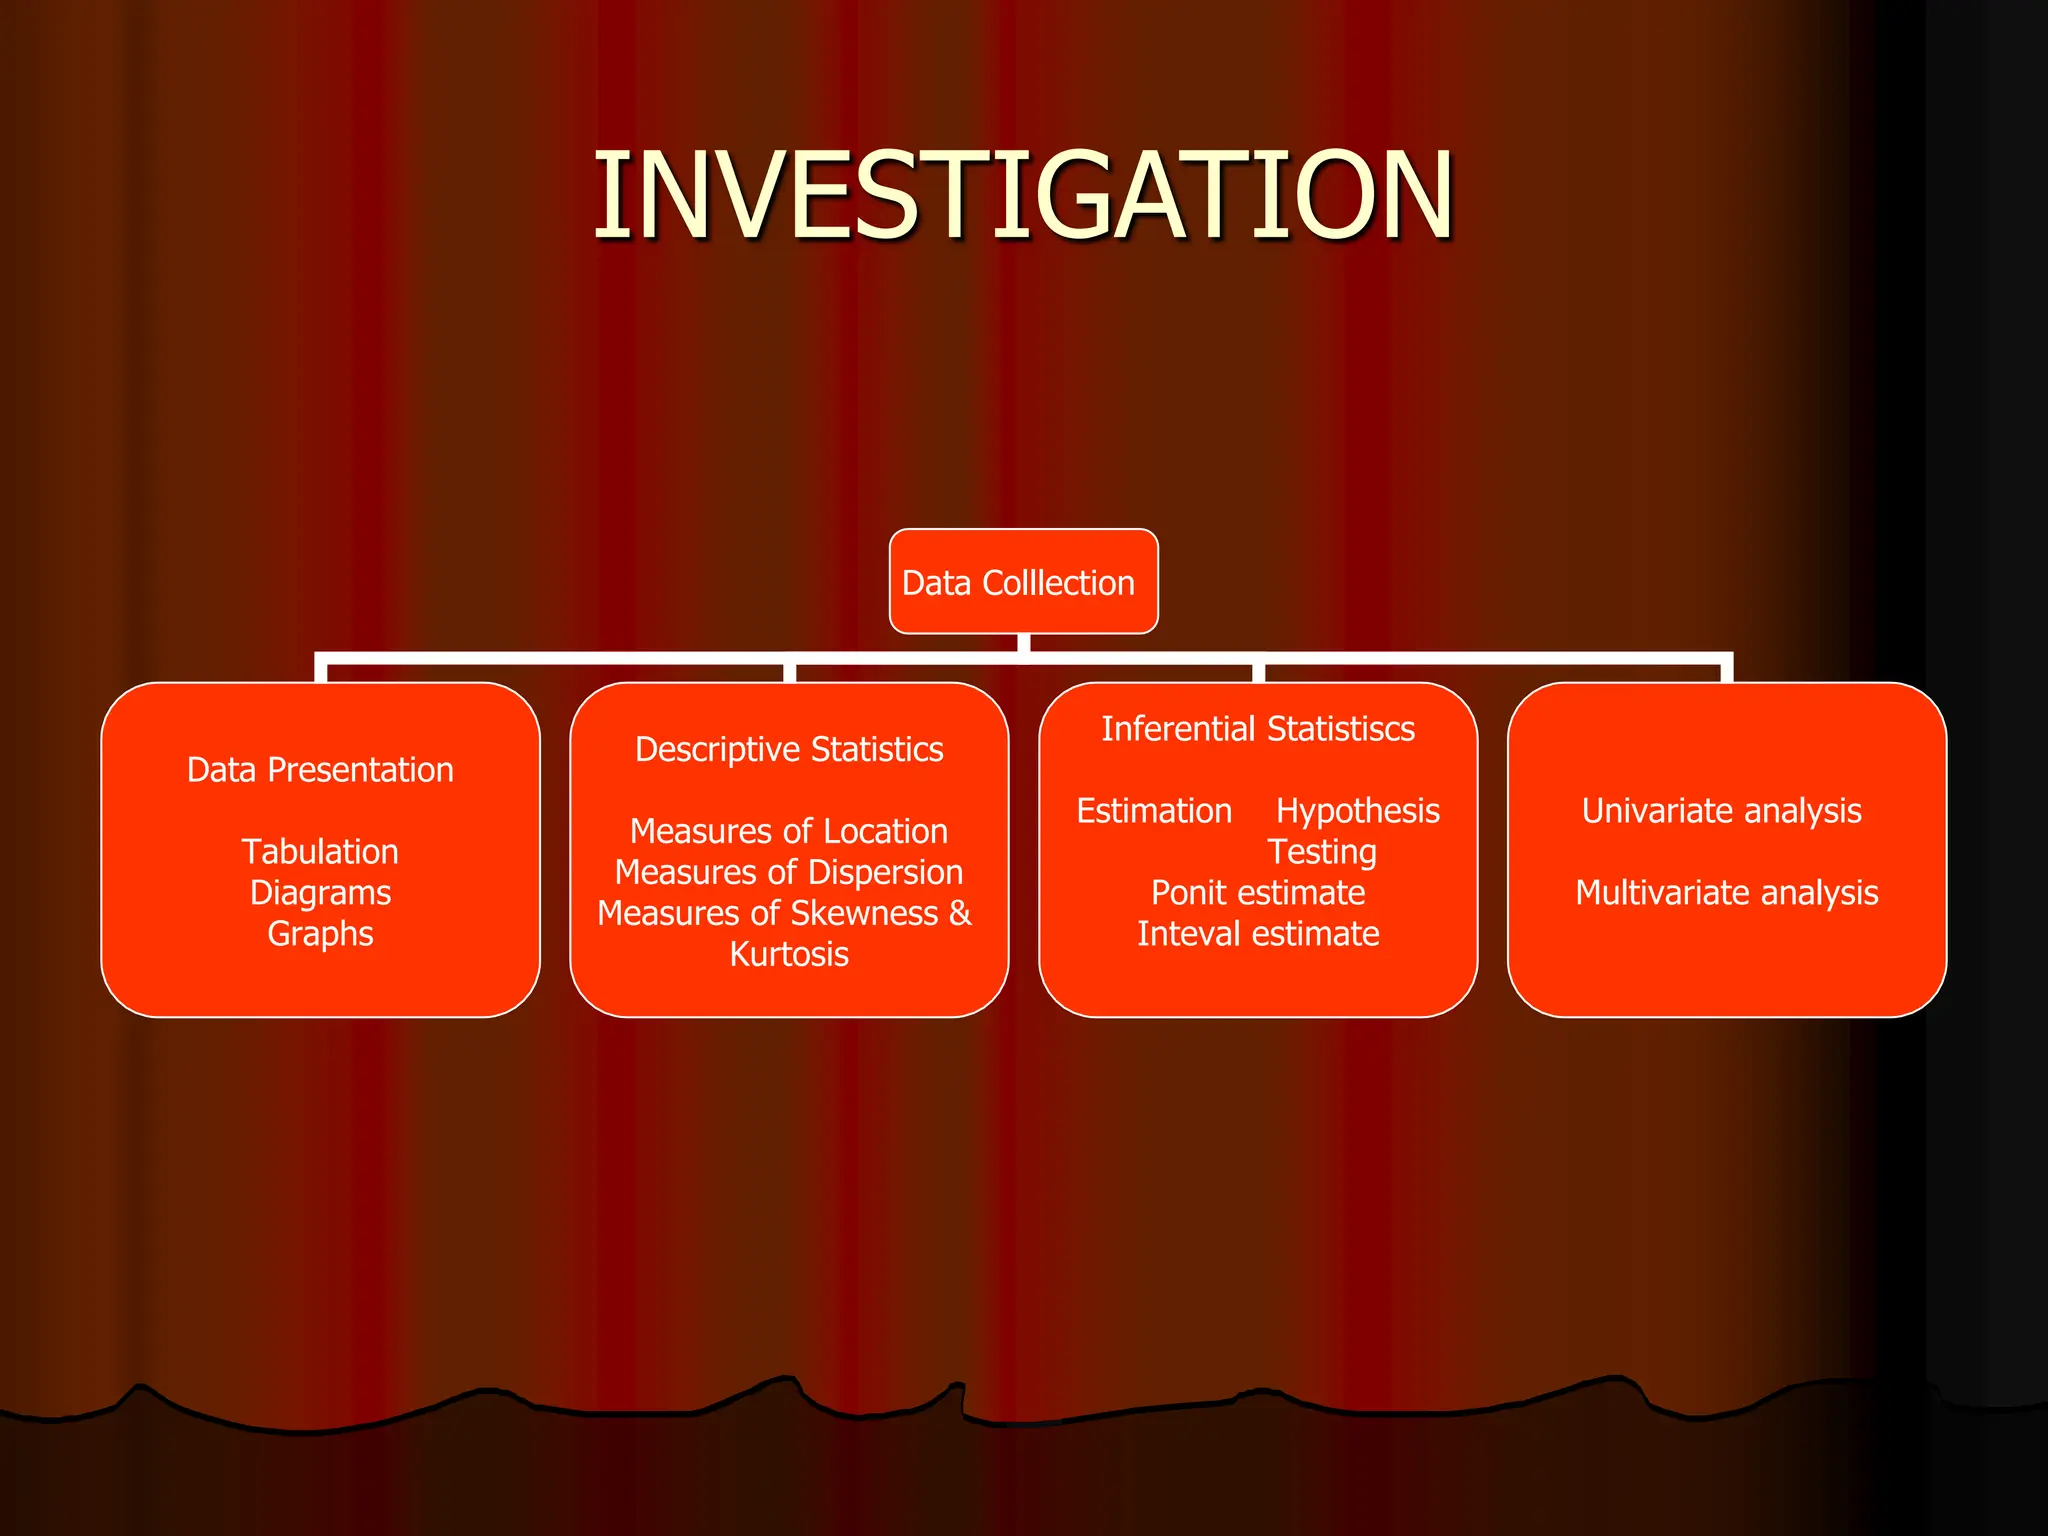
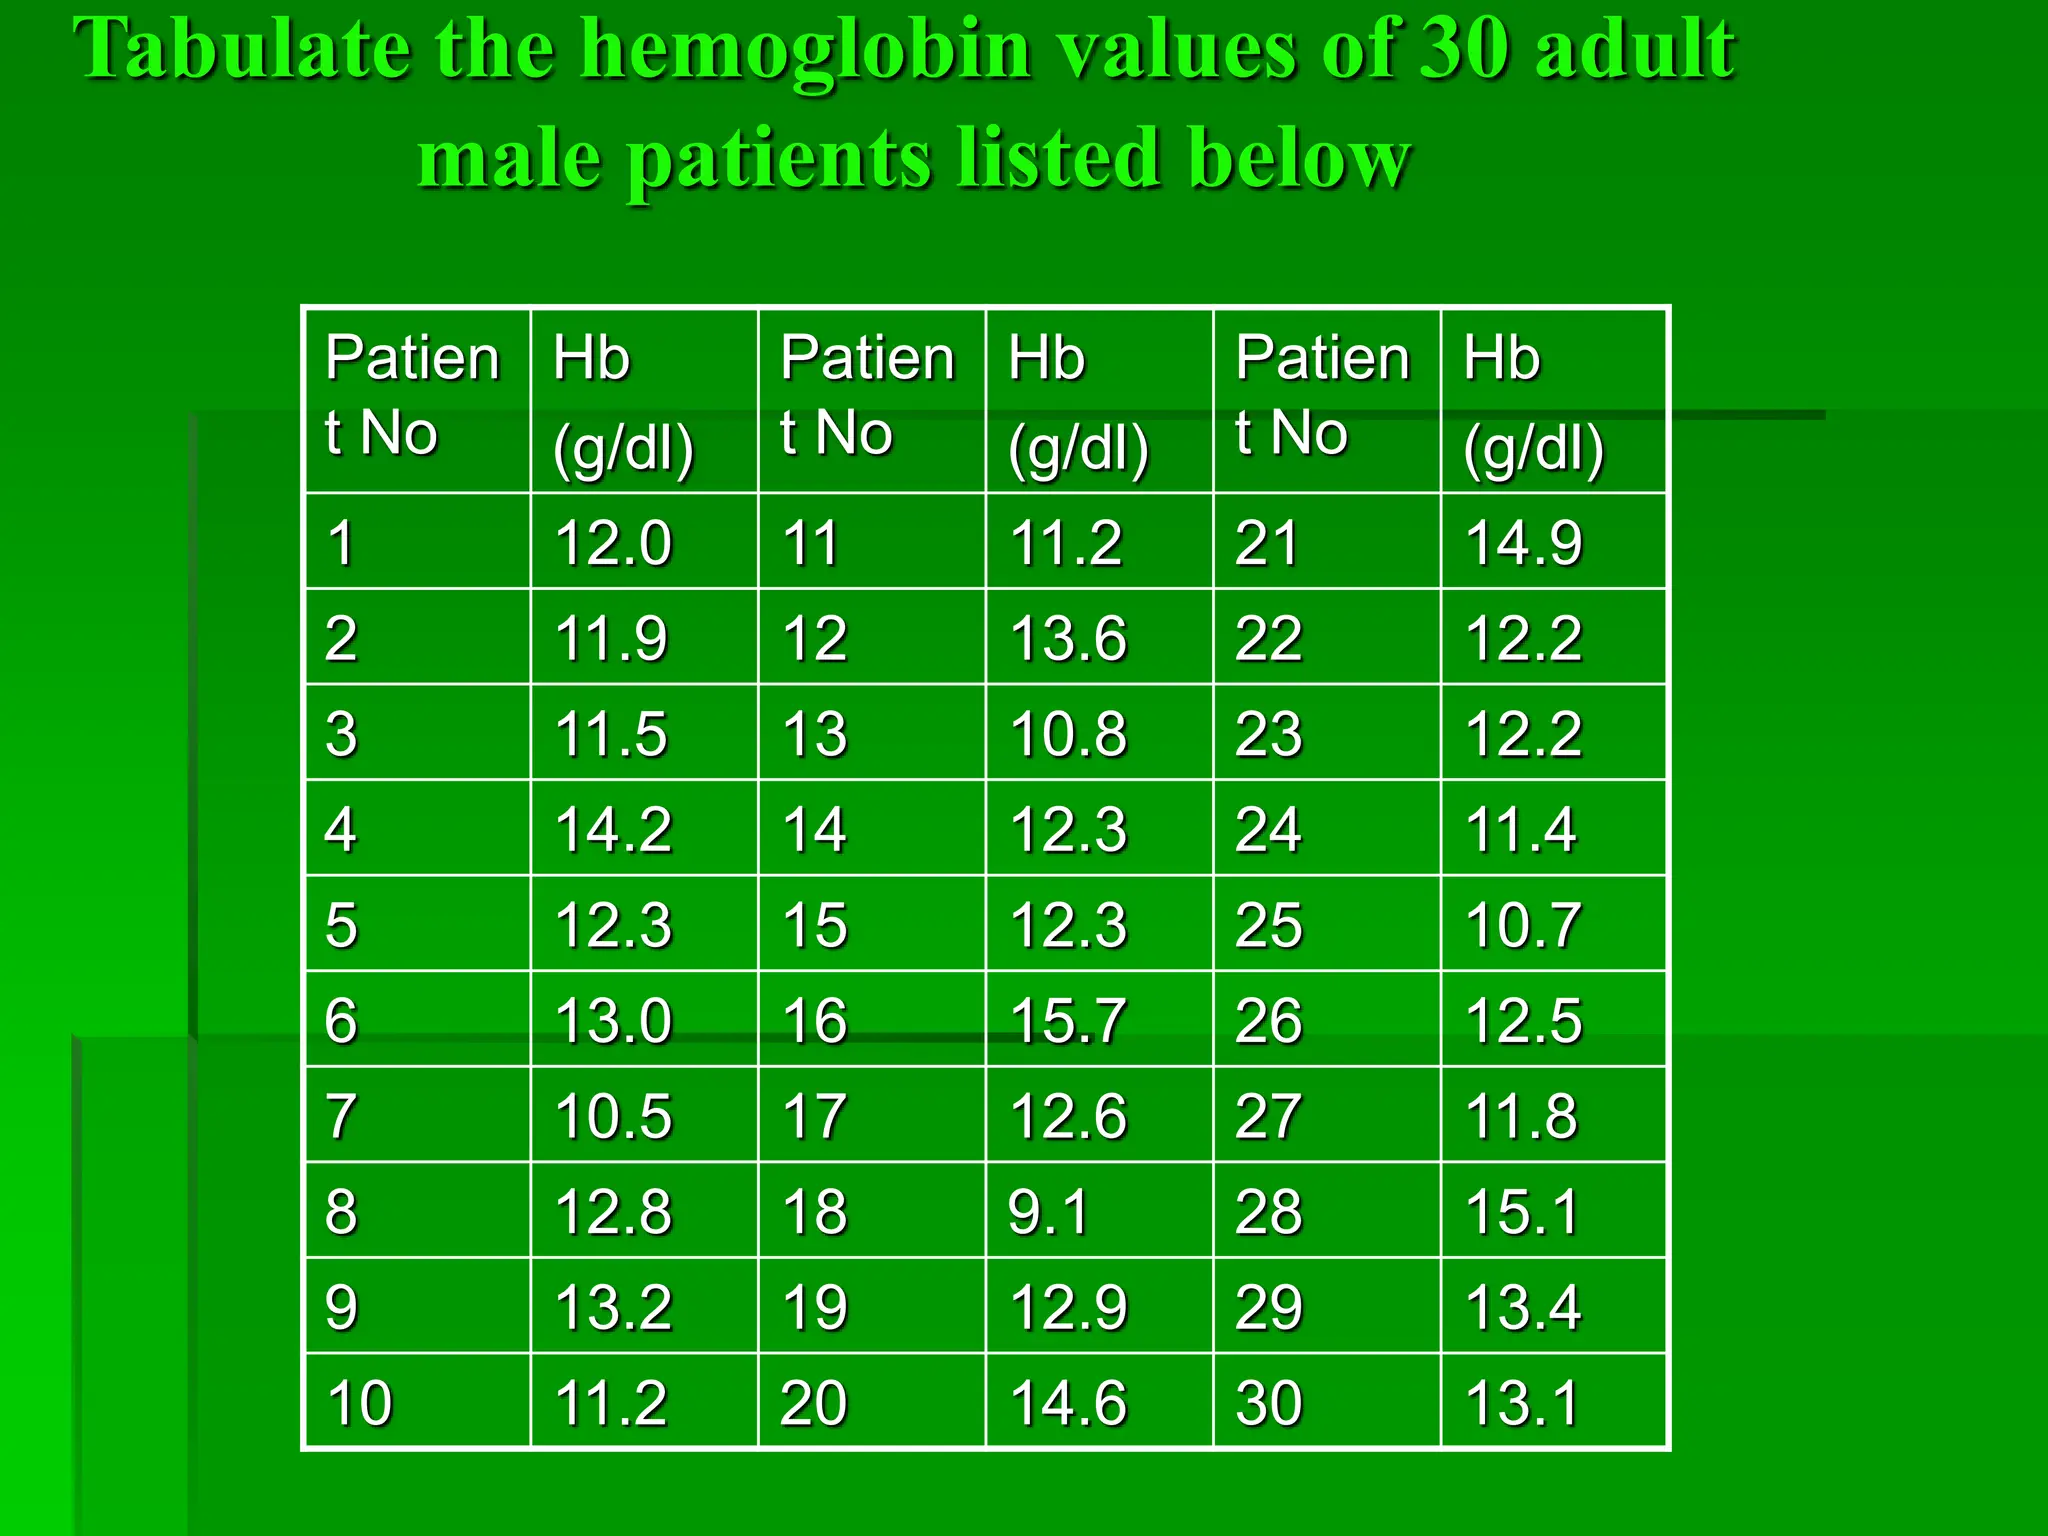
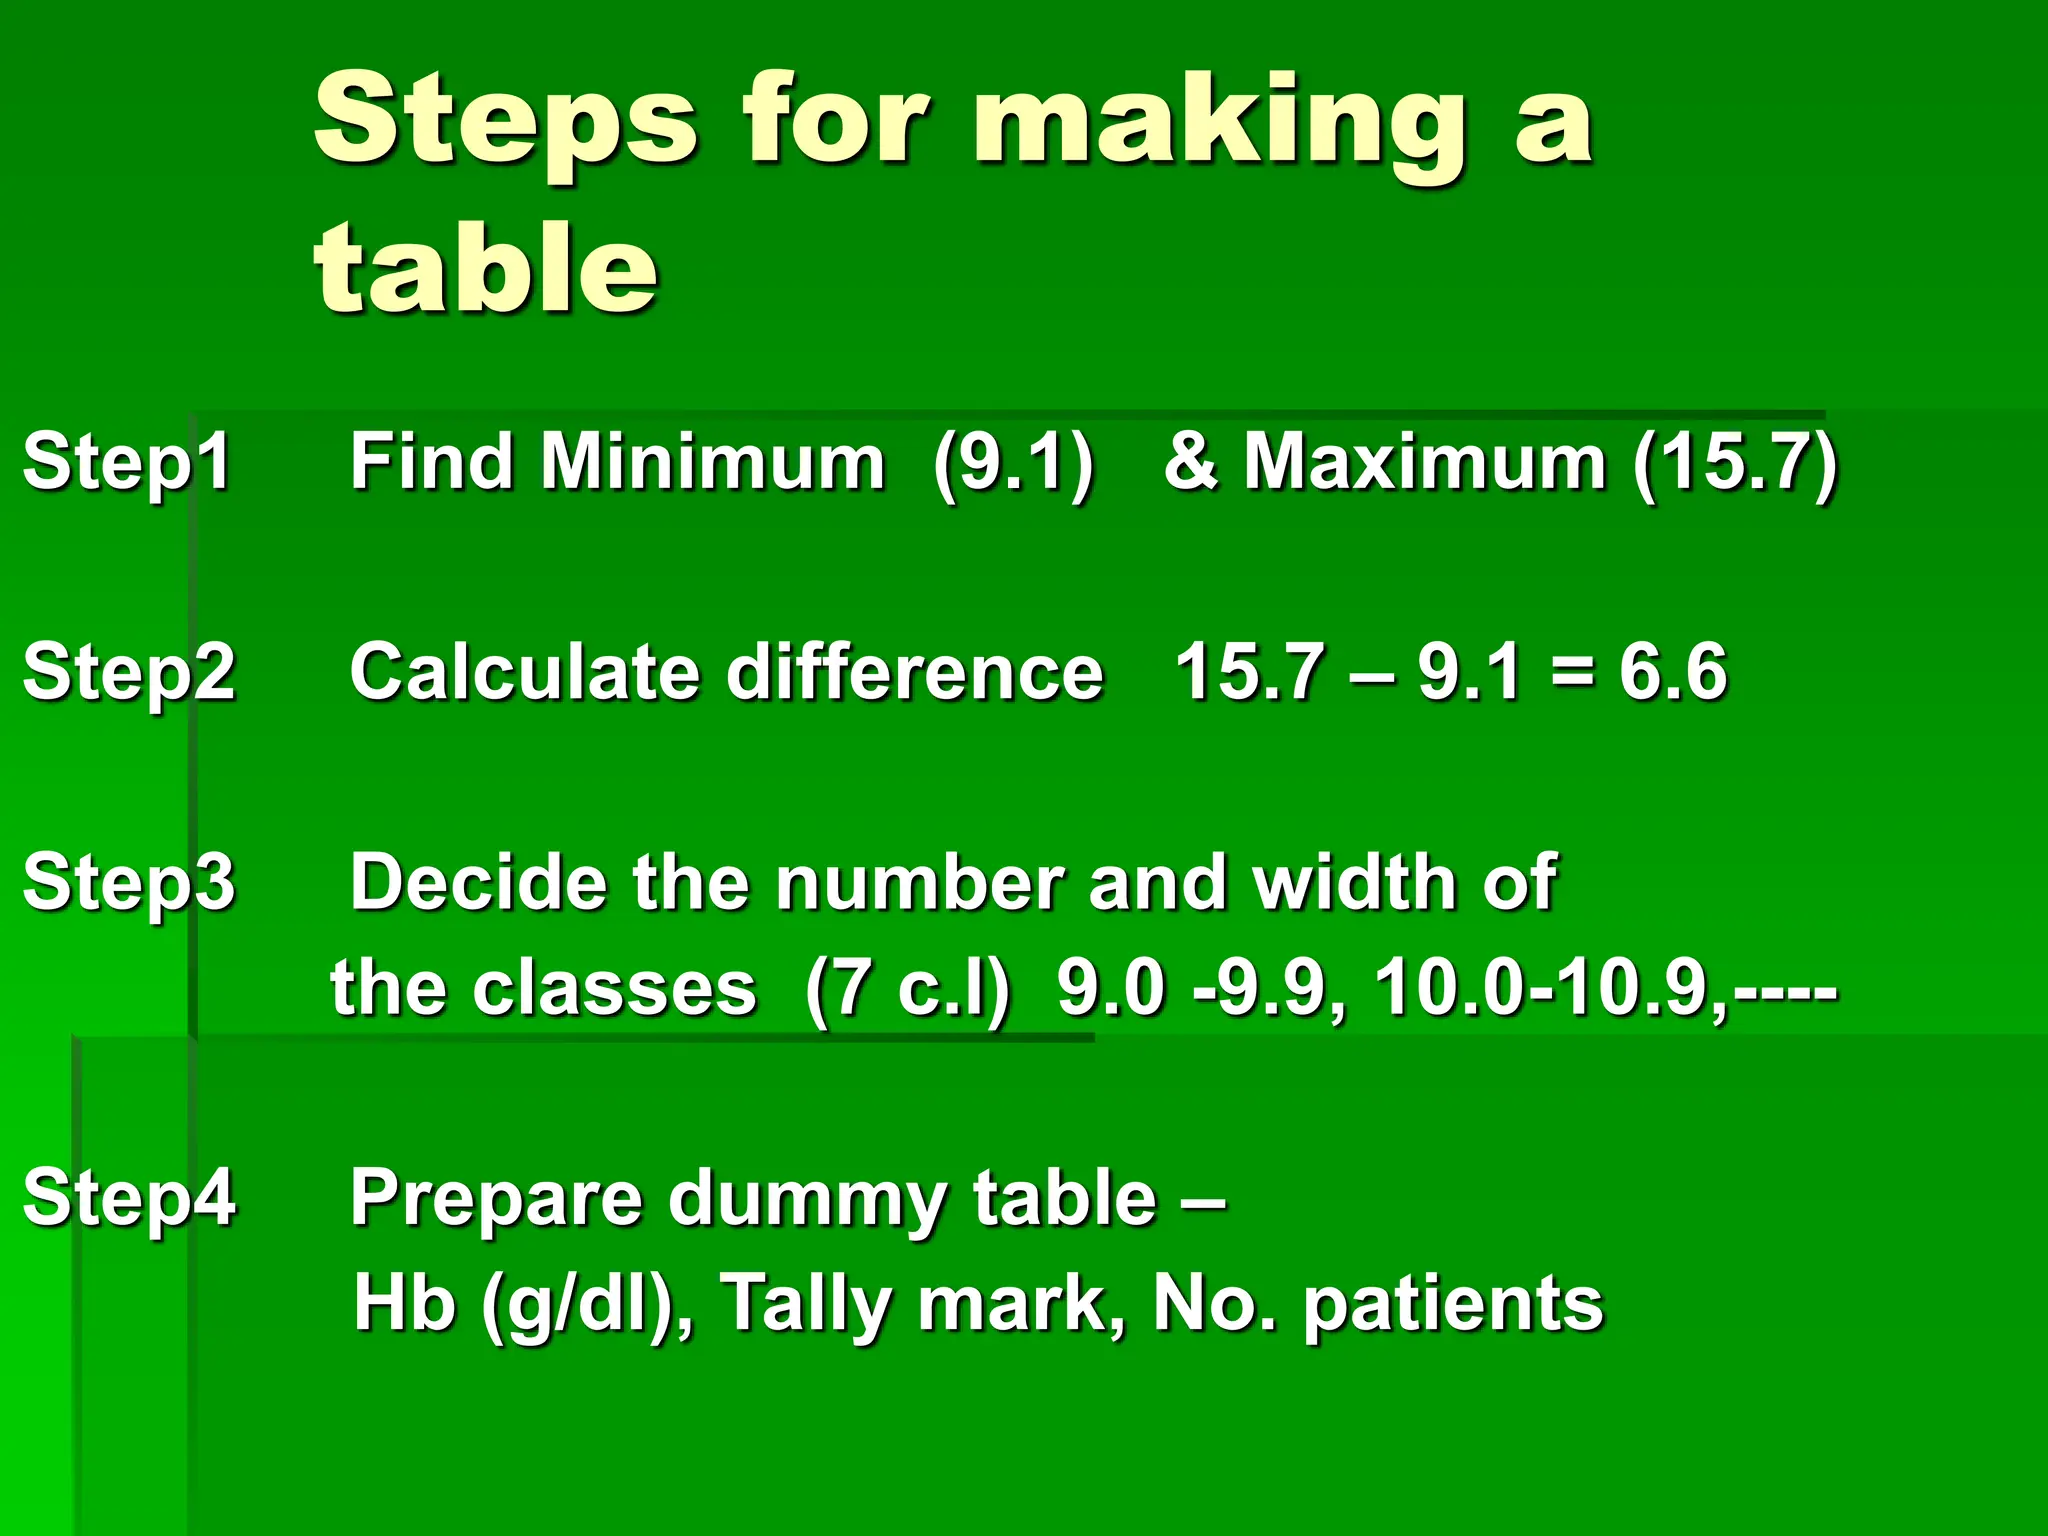
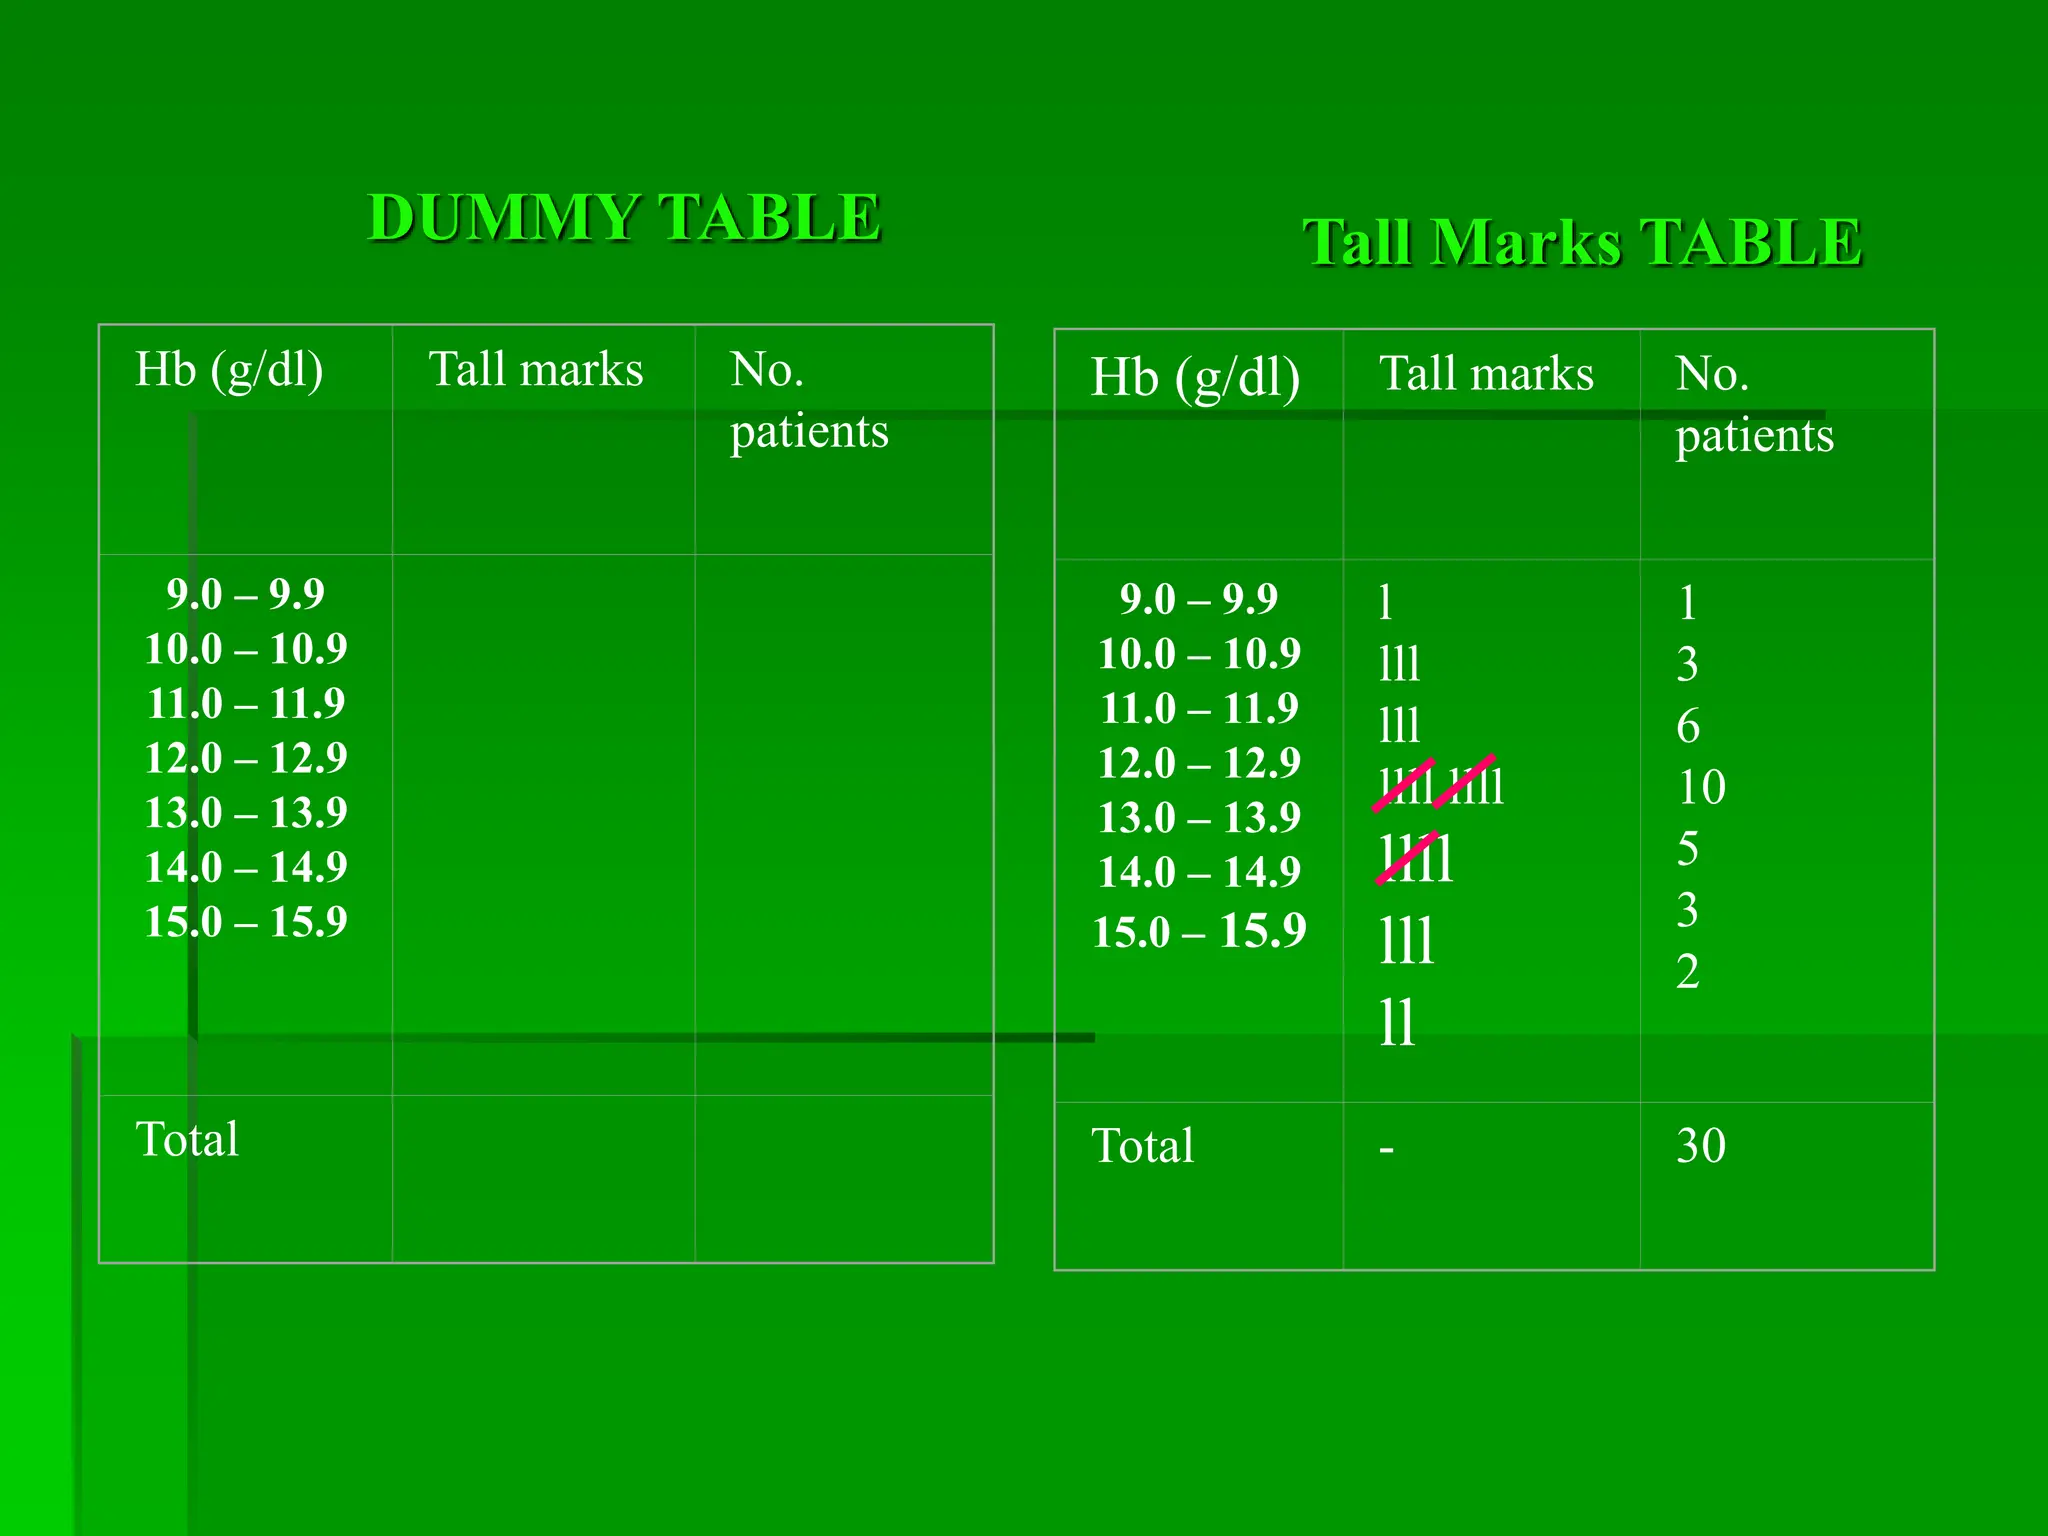
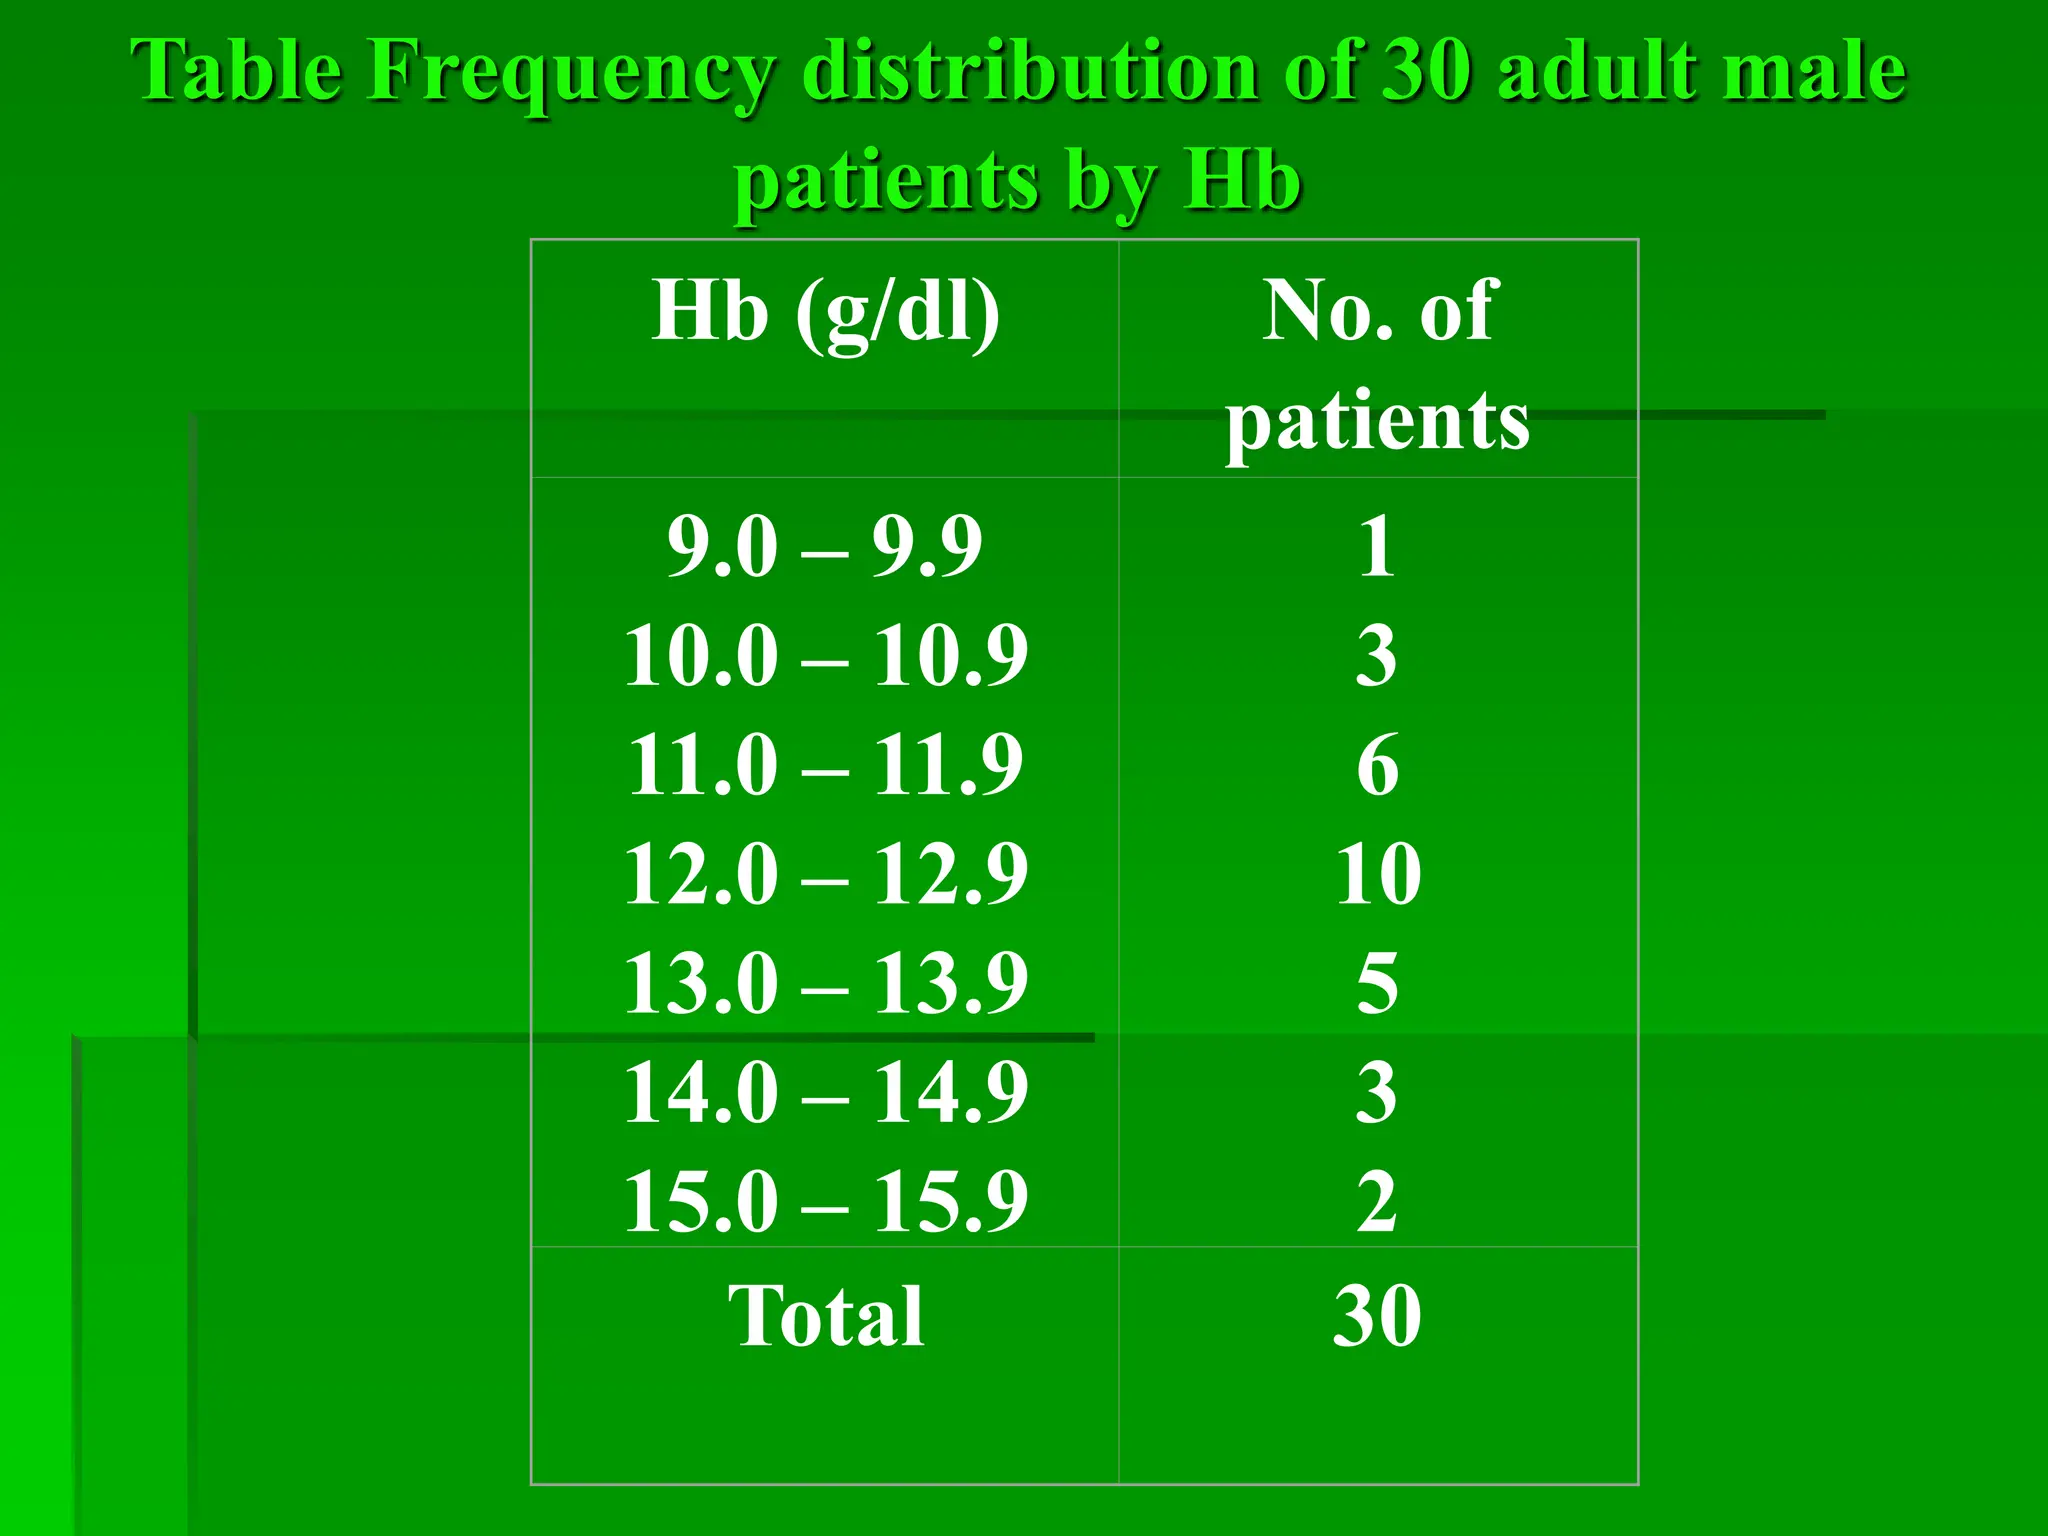


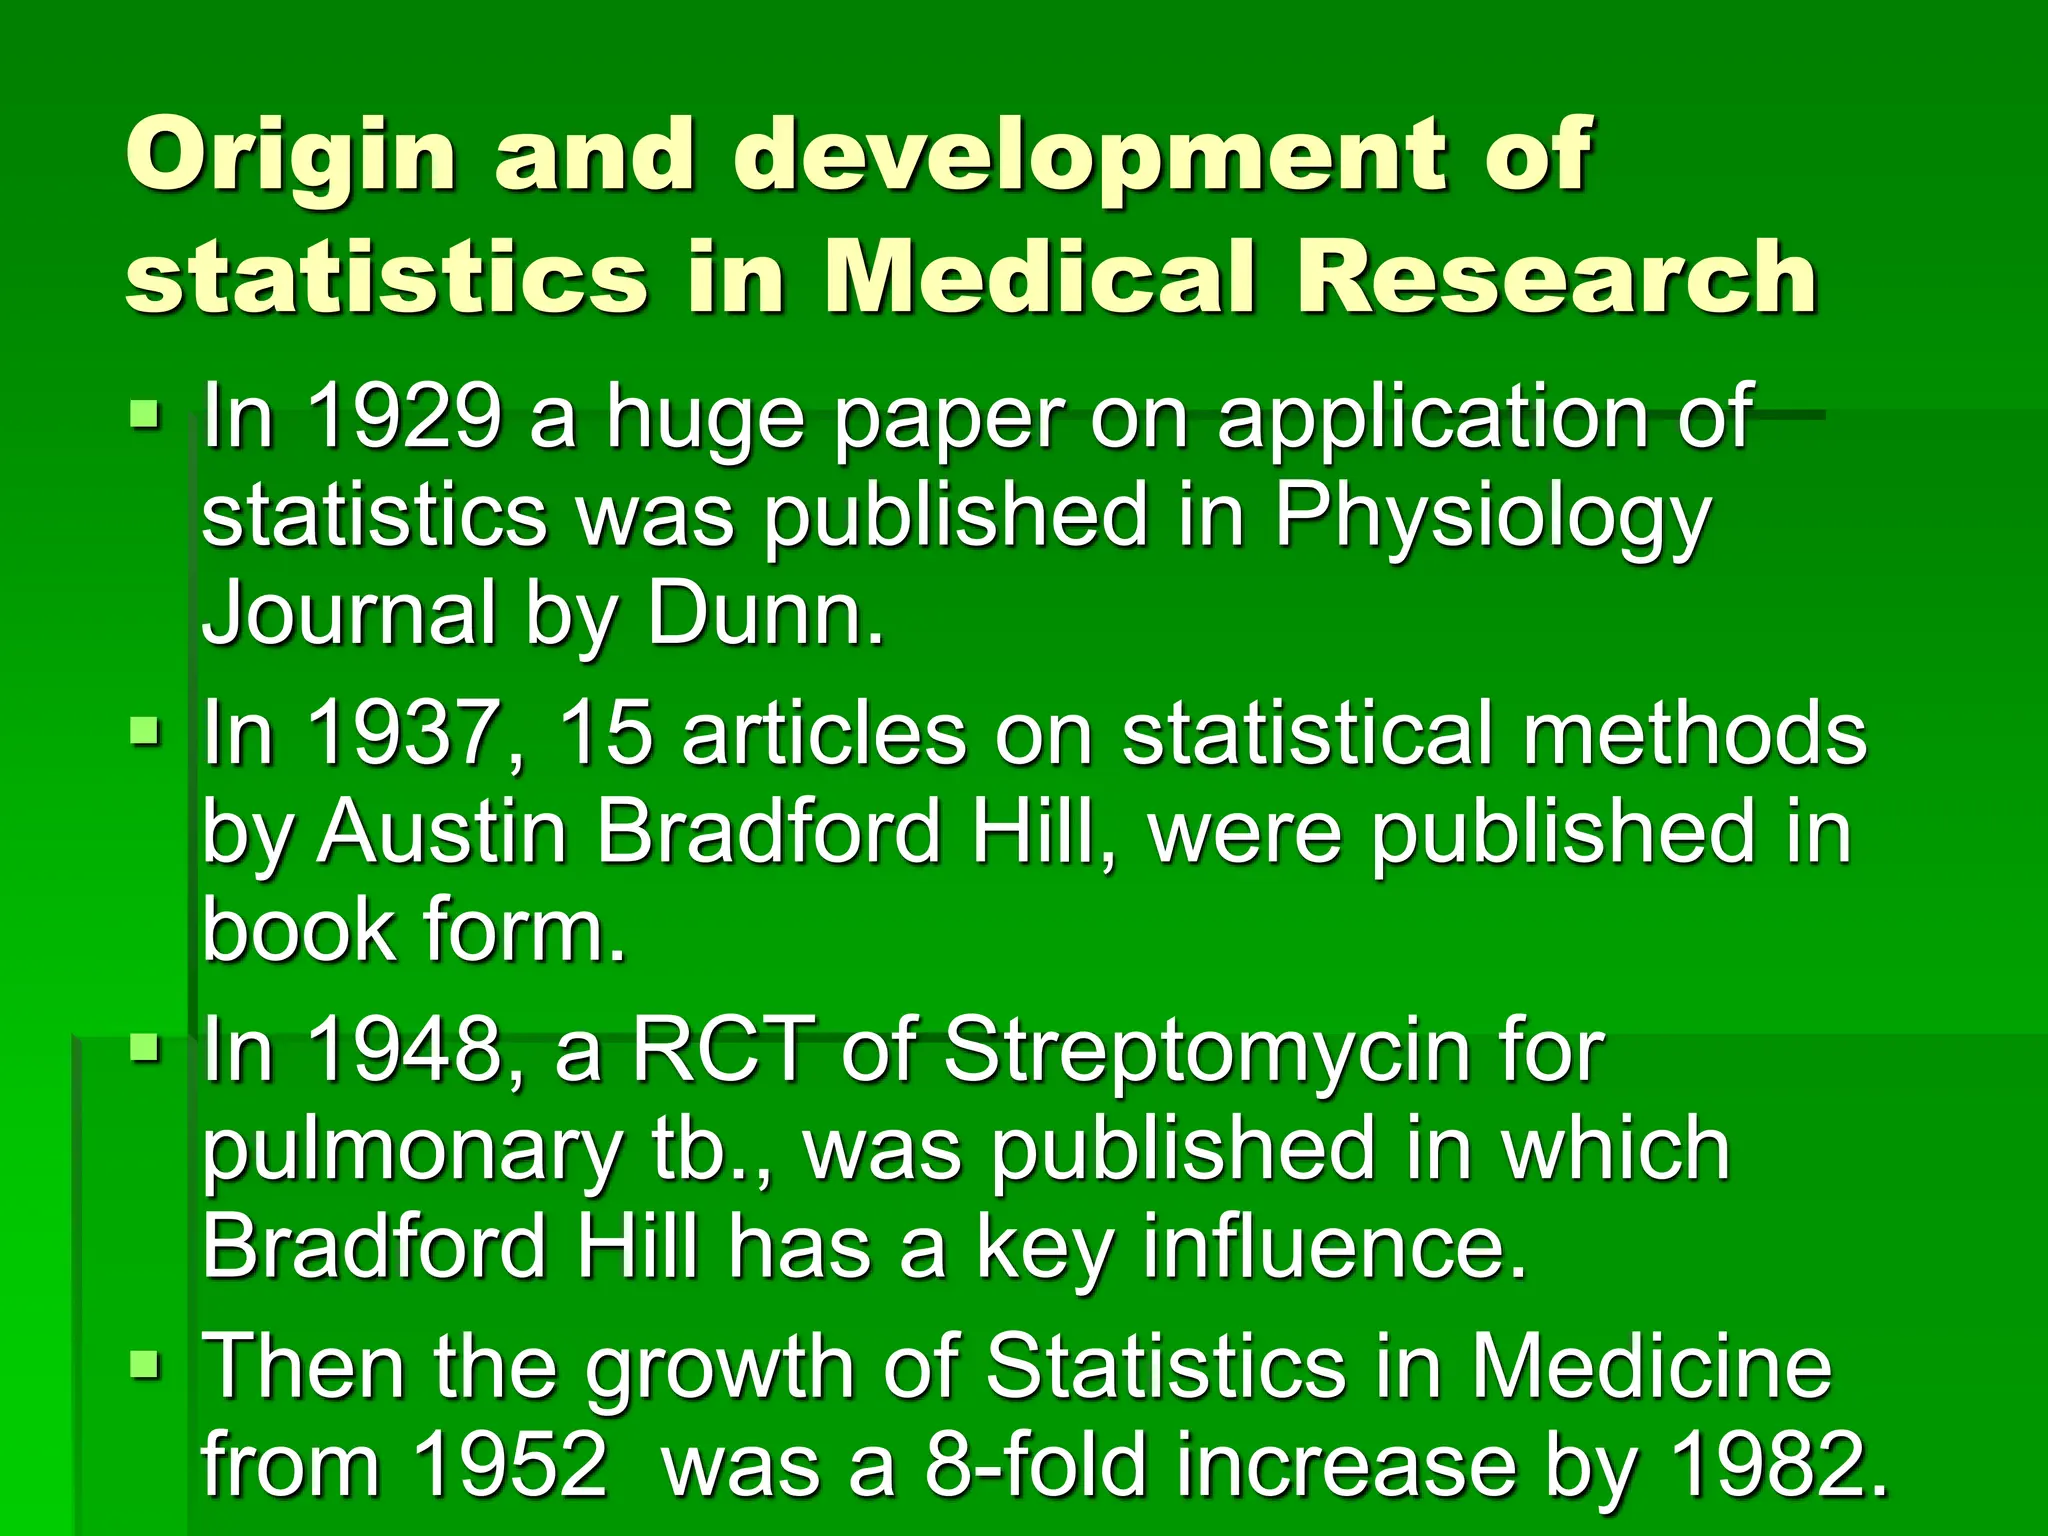

This document provides an introduction to biostatistics. It discusses key concepts including descriptive statistics, inferential statistics, hypothesis testing, and sampling techniques. It outlines the role of biostatistics in various areas like clinical medicine, preventive medicine, health planning and evaluation, and medical research. Biostatistics helps manage uncertainties in medicine by providing statistical methods to analyze data, evaluate treatments and programs, and make inferences about populations. It is important for designing valid research studies and interpreting medical literature.