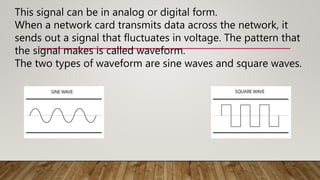
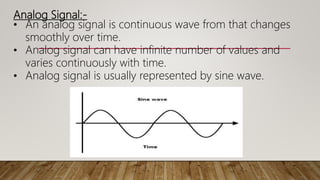
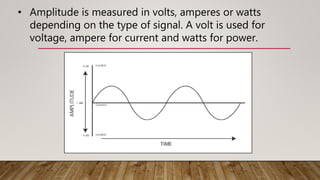
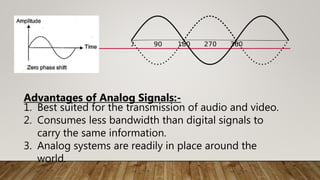
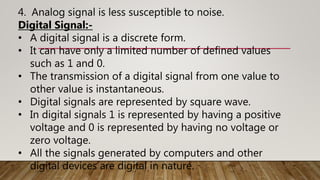
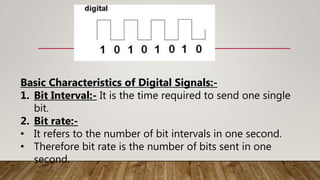
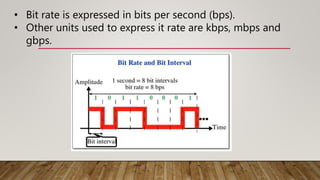
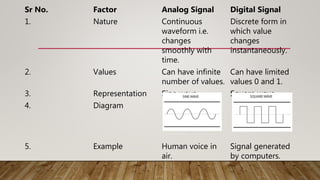
It is a digital representation of an analog signal that takes samples of the amplitude of the analog signal at regular intervals. The sampled analog data is changed to, and then represented by, binary data.
Analog-to-digital conversion is an electronic process in which a continuously variable (analog) signal is changed, without altering its essential content, into a multi-level (digital) signal.
The input to an analog-to-digital converter (ADC) consists of a voltage that varies among a theoretically infinite number of values. Examples are sine waves, the waveforms representing human speech, and the signals from a conventional television camera. The output of the ADC, in contrast, has defined levels or states. The number of states is almost always a power of two -- that is, 2, 4, 8, 16, etc. The simplest digital signals have only two states, and are called binary. All whole numbers can be represented in binary form as strings of ones and zeros.
The Presentation is as per the syllabus of the subject ”Digital Communication” of B.E. VIth Semester of Sant Gadge Baba Amravati University, Maharashtra, India
Contents are
Digital Communication System
Line Coding
Scrambling
Time-division multiplexing is a method of transmitting and receiving independent signals over a common signal path by means of synchronized switches at each end of the transmission line so that each signal appears on the line only a fraction of time in an alternating pattern.
This presentation is for students of NICE Balangir to help them cover their CCN course. It cannot be called complete but I have made all efforts to make it simple and easy to understand. For suggestions please mail me at sambit_khuas@yahoo.co.in
This presentation, created by Syed Faiz ul Hassan, explores the profound influence of media on public perception and behavior. It delves into the evolution of media from oral traditions to modern digital and social media platforms. Key topics include the role of media in information propagation, socialization, crisis awareness, globalization, and education. The presentation also examines media influence through agenda setting, propaganda, and manipulative techniques used by advertisers and marketers. Furthermore, it highlights the impact of surveillance enabled by media technologies on personal behavior and preferences. Through this comprehensive overview, the presentation aims to shed light on how media shapes collective consciousness and public opinion.
Acorn Recovery: Restore IT infra within minutesIP ServerOne
Introducing Acorn Recovery as a Service, a simple, fast, and secure managed disaster recovery (DRaaS) by IP ServerOne. A DR solution that helps restore your IT infra within minutes.
Have you ever wondered how search works while visiting an e-commerce site, internal website, or searching through other types of online resources? Look no further than this informative session on the ways that taxonomies help end-users navigate the internet! Hear from taxonomists and other information professionals who have first-hand experience creating and working with taxonomies that aid in navigation, search, and discovery across a range of disciplines.
This presentation by Morris Kleiner (University of Minnesota), was made during the discussion “Competition and Regulation in Professions and Occupations” held at the Working Party No. 2 on Competition and Regulation on 10 June 2024. More papers and presentations on the topic can be found out at oe.cd/crps.
This presentation was uploaded with the author’s consent.
Sharpen existing tools or get a new toolbox? Contemporary cluster initiatives...Orkestra
UIIN Conference, Madrid, 27-29 May 2024
James Wilson, Orkestra and Deusto Business School
Emily Wise, Lund University
Madeline Smith, The Glasgow School of Art
0x01 - Newton's Third Law: Static vs. Dynamic AbusersOWASP Beja
f you offer a service on the web, odds are that someone will abuse it. Be it an API, a SaaS, a PaaS, or even a static website, someone somewhere will try to figure out a way to use it to their own needs. In this talk we'll compare measures that are effective against static attackers and how to battle a dynamic attacker who adapts to your counter-measures.
About the Speaker
===============
Diogo Sousa, Engineering Manager @ Canonical
An opinionated individual with an interest in cryptography and its intersection with secure software development.
2. Signal:-
Electric signal is represented as a change in voltage over
time.
The change occurs when the voltage begins at zero and
increases until it peaks. The signal then drops back down
its lowest level.
In computer networks, we send information from one
computer to another. This information may be in form of
data, voice, pictures and so on. In order to transmit this
information across the network, it needs to be
into electromagnetic signals. Therefore in computer
networks information flows from one system to another in
the form of signal via transmission media.
3. This signal can be in analog or digital form.
When a network card transmits data across the network, it
sends out a signal that fluctuates in voltage. The pattern that
the signal makes is called waveform.
The two types of waveform are sine waves and square waves.
4. Analog Signal:-
• An analog signal is continuous wave from that changes
smoothly over time.
• Analog signal can have infinite number of values and
varies continuously with time.
• Analog signal is usually represented by sine wave.
5. • Each cycle consists of a single arc above the time axis
followed by a single arc below the time axis.
• Example of analog signal is human voice. When we
speak, we use air to transmit an analog signal. Electrical
signal from an audio tape, can also be in analog form.
Basic Characteristics of Analog Signal:-
1. Amplitude:-
• Amplitude of a signal refers to the height of the signal.
• It is equal to the vertical distance from a given point on
the waveform to the horizontal axis.
• The maximum amplitude of a sine wave is equal to the
highest value it reaches on the vertical axis.
6. • Amplitude is measured in volts, amperes or watts
depending on the type of signal. A volt is used for
voltage, ampere for current and watts for power.
7. 2. Period:-
• Period refers to the amount of time in which a signal
completes one cycle.
• It is measured in seconds.
• Other units used to measure period are millisecond,
microsecond, nanosecond and picoseconds.
3. Frequency:-
• It refers to the number of wave patterns completed in a
given period of time.
• To be more precise, frequency refers to number of
periods in one second or number of cycles per second.
• Frequency is measured in Hertz (Hz).
8. • Other units used to express frequency are kilohertz,
megahertz, gigahertz and terahertz.
• Frequency and period are the inverse of each other.
Period is the inverse of frequency and frequency is the
inverse of period.
9. 4. Phase:-
• Phase describes the position of the waveform relative
to time zero.
• Phase describes the amount by which the waveform
shifts forward or backward along the time axis.
• It indicates the status of first cycle.
• Phase is measured in degrees or radians.
• A phase shift of 360 degree indicates a shift of a
complete period, a phase shift of 180 degree indicates
a shift of half period and a phase shift of 90 degree
indicates a shift of a quarter of a period.
10. Advantages of Analog Signals:-
1. Best suited for the transmission of audio and video.
2. Consumes less bandwidth than digital signals to
carry the same information.
3. Analog systems are readily in place around the
world.
11. 4. Analog signal is less susceptible to noise.
Digital Signal:-
• A digital signal is a discrete form.
• It can have only a limited number of defined values
such as 1 and 0.
• The transmission of a digital signal from one value to
other value is instantaneous.
• Digital signals are represented by square wave.
• In digital signals 1 is represented by having a positive
voltage and 0 is represented by having no voltage or
zero voltage.
• All the signals generated by computers and other
digital devices are digital in nature.
12. Basic Characteristics of Digital Signals:-
1. Bit Interval:- It is the time required to send one single
bit.
2. Bit rate:-
• It refers to the number of bit intervals in one second.
• Therefore bit rate is the number of bits sent in one
second.
13. • Bit rate is expressed in bits per second (bps).
• Other units used to express it rate are kbps, mbps and
gbps.
14. Advantages of Digital Signals:-
1. Best suited for the transmission of digital data.
2. Digital data can be easily compressed.
3. Digital information can be encrypted.
4. Equipment that uses digital signals is more common and
less expensive.
5. Provides better clarity because all signals must be either
1s or 0s.
15. Sr No. Factor Analog Signal Digital Signal
1. Nature Continuous
waveform i.e.
changes
smoothly with
time.
Discrete form in
which value
changes
instantaneously.
2. Values Can have infinite
number of values.
Can have limited
values 0 and 1.
3. Representation Sine wave Square wave
4. Diagram
5. Example Human voice in
air.
Signal generated
by computers.
16. Maximum Data Rate Of A Channel:-
• The maximum rate at which the data can be transmitted
over a given communication path or a channel, under
given conditions is known as channel capacity.
• The data rate of a channel usually depends on three
factors:-
1. Bandwidth of channel
2. Level of the signal
3. Quality of the channel
• The quality of a channel is basically concerned with the
level of noise present on the channel.
• There are two different theoretical formulas to calculate
data rate of a channel:
17. • Nyquist theorem for noiseless channel.
• Shannon capacity formula for noisy channel.
1. Nyquist Theorem:-
• Nyquist derived the limit of bit rate for a perfectly noiseless
channel.
• It states that if B is the bandwidth of a transmission channel
which carries a signal having L levels, the maximum bit rate
R is given by:
R=2B log2 L
• For example, if we consider a noiseless channel having a
bandwidth of 300Hz transmitting a signal with two signal
levels, the maximum data rate of a channel can be
calculated as:
18. R=2 x 3000 x log22= 6000 bps
• This formula for noiseless channel is completely
theoretical and will not give accurate results because of
following reasons:
1. No transmission channel is practically noiseless.
2. If we increase the number of signal levels, the bit rate
will not increase. Because when the number of signal
levels are increased it creates a burden on the receiver
and reduces the reliability of the system.
1. Shannon Capacity Formula:-
• Practically, it is not possible to have a noiseless channel.
19. • In 1994 Claude Shannon defined a formula called the
Shannon capacity to determine the theoretical highest
data rate for a noisy channel.
• The amount of thermal noise present is measured by the
ratio of the signal power to the noise power called signal-
to-noise ratio.
• The signal power is represented by S and noise power by
N and the signal-to-noise ratio is S/N.
• Signal to noise ratio is expressed in decibels.
• Shannon’s equation puts a limit on the number of levels
L.
• The number of levels required for the bit rate of 30,000
bps, can be computed from Nyquist’s formula.
20. S. No. Factor Analog transmission Digital transmission
1. Nature of signal Continuous waveform Discrete form
2. Values Infinite values Limited values
3. Cost Low High
4. Effect of Noise High, Noise immunity
is poor
Low, Noise immunity is
excellent.
5. Efficiency Low High
6. Security and Privacy Not very much Coding can be applied
to digital data
7. Integration Not possible Voice, video and digital
data can be easily
integrated.
8. Attenuation High Low
9. Maintenance Cost High Low
10. Multiplexing
Technique
FDM is used TDM is used
11. Error Detection Not possible Possible
12. Example Radio transmission Data transmission