Amy S Friend- STC- To Err Is Human: Applying Six Sigma Quality to Technical Communications
•
0 likes•53 views

Amy Friend - STC Spectrum conference- Six sigma quality concepts are applicable to more than manufacturing. Amy Friend presented this presentation for Technical Communicators at the STC Spectrum Conference. This is the accompanying white paper with the PPT. While the sessions may be dated, the concepts still apply in business processes today. For more information on applying six sigma to non-manufacturing, contact Amy Friend at amysfriend.ny@gmail.com or visit www.amysfried.com

Recommended
Recommended
More Related Content
What's hot
What's hot (19)
Similar to Amy S Friend- STC- To Err Is Human: Applying Six Sigma Quality to Technical Communications
Similar to Amy S Friend- STC- To Err Is Human: Applying Six Sigma Quality to Technical Communications (20)
More from Amy S. Friend
More from Amy S. Friend (16)
Recently uploaded
Recently uploaded (20)
Amy S Friend- STC- To Err Is Human: Applying Six Sigma Quality to Technical Communications
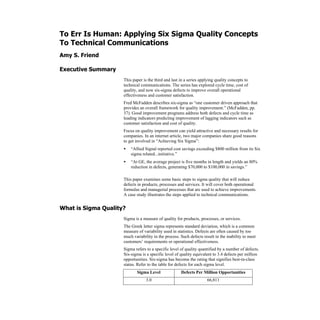
- 1. To Err Is Human: Applying Six Sigma Quality Concepts To Technical Communications Amy S. Friend Executive Summary This paper is the third and last in a series applying quality concepts to technical communications. The series has explored cycle time, cost of quality, and now six-sigma defects to improve overall operational effectiveness and customer satisfaction. Fred McFadden describes six-sigma as “one customer driven approach that provides an overall framework for quality improvement.” (McFadden, pp. 37). Good improvement programs address both defects and cycle time as leading indicators predicting improvement of lagging indicators such as customer satisfaction and cost of quality. Focus on quality improvement can yield attractive and necessary results for companies. In an internet article, two major companies share good reasons to get involved in “Achieving Six Sigma”: • “Allied Signal reported cost savings exceeding $800 million from its Six sigma related...initiative.” • “At GE, the average project is five months in length and yields an 80% reduction in defects, generating $70,000 to $100,000 in savings.” This paper examines some basic steps to sigma quality that will reduce defects in products, processes and services. It will cover both operational formulas and managerial processes that are used to achieve improvements. A case study illustrates the steps applied to technical communications. What is Sigma Quality? Sigma is a measure of quality for products, processes, or services. The Greek letter sigma represents standard deviation, which is a common measure of variability used in statistics. Defects are often caused by too much variability in the process. Such defects result in the inability to meet customers’ requirements or operational effectiveness. Sigma refers to a specific level of quality quantified by a number of defects. Six-sigma is a specific level of quality equivalent to 3.4 defects per million opportunities. Six-sigma has become the rating that signifies best-in-class status. Refer to the table for defects for each sigma level. Sigma Level Defects Per Million Opportunities 3.0 66,811
- 2. To Err Is Human: Applying Six Sigma Quality Concepts To Technical Communications, Amy Friend, c 1999 4.0 6,210 5.0 233 6.0 3.4 Table: Sigma Level for DPMO Six-sigma also refers to a methodology to reach optimum quality levels. This methodology provides metrics to quantify and track quality and process steps to improve quality levels. Some of the “Steps to Six-Sigma” and equations are covered in this paper. 1. Define products, services, and processes 2. Identify customer requirements 3. Compare product with requirements 4. Describe the process 5. Improve the process 6. Measure quality and productivity Figure: Steps to Six-Sigma The Sigma methodology used to reduce defects is applicable to any product, service, or process. These steps resemble a generic problem-solving model. Applications of Sigma Six-sigma has been primarily used in manufacturing. However, many quality conscious companies have applied the sigma quality concepts to improve products, services, and processes. Since the concept of six-sigma helps to answer the question “how good is good enough?” It is used to improve many kinds of businesses, including technical communications. The Schaumburg Central Engineering Service Group was one of the first to apply six-sigma to technical communications. Information Services at Motorola continued the application in their work. Examples from Motorola will be used to illustrate applications. Defects Defects can be defined as: • Any variation in a product, process, or service which would prevent us from meeting the needs of the customer and/or which adds cost, whether or not it is detected. • In practice, it is non-conformance to a customer-driven specification. • Any non-conformance, interruption of the flow, or intervention in the flow.
- 3. To Err Is Human: Applying Six Sigma Quality Concepts To Technical Communications, Amy Friend, c 1999 Examples of Product Defects in Technical Communications: • Document cover is torn • Mis-spelled words • Incorrect content in publication Examples of Service Defects in Technical Communications: • Incomplete order shipped to customer • Job estimate not completed on time • Printing not completed on time Examples of Process Defects in Technical Communications: • Subject Matter Expert is not available for specified time • Illustrations need to be redone • Computer needs to be repaired • Product is not available on time • Writer is not trained on software as prescribed • Meetings start late Observed Defects Observed defects are those defects found within the scope of our operation, before the customer receives the product or service. It is advantageous to find defects before customers do to limit the impact on customer satisfaction, loyalty, and retention. Such observed defects may be part of the process or the products/services. A number of steps are built into our processes to enable us to catch these defects: • Development of templates, styles, and standards • Training of employees to do their jobs • Reviews by Subject-Matter Experts to ensure the content is correct • Validations and verifications by target audience to ensure clarity and relevence of content • Reviews by editors to ensure adherence to styles and standards • Approvals by management on plans to ensure fulfillment of client requirements Observed defects are leading indicators of the final product quality. If defects are caught and corrected during our processes, you can eliminate escaped defects before the customer sees them. Unnessesary rework can also be eliminated.
- 4. To Err Is Human: Applying Six Sigma Quality Concepts To Technical Communications, Amy Friend, c 1999 Escaped Defects Escaped defects are those errors that we miss and that reach customers. Inspections and reviews are not 100% effective, so some defects will reach the customer. We hear about some of these defects in the form of customer complaints. Some defects the customers don't catch either. Since customers do not report many escaped defects, we typically count only observed defects as part of process improvement. However, it is important to track escaped defects as they are a key source of customer dissatisfaction. Both observed and escaped defects should be used to make improvements. Many folks focus improvements on observed defects because they can be tracked more reliably. Escaped defects are used to better understand causes of customer dissatisfaction. Units Just counting defects may not provide enough information to analyze the quality on an ongoing basis over time. To look at the rate of improvement over time, the number of defects is compared against the number of units. A Unit is: • The normal end product or output of the process • What the customer buys, the saleable unit Examples of units in Technical communications include: • Service Manual • Operators Guide • Newsletter • Student Guide • Video program • Software Manual DPU The defects-per-unit (DPU) compares the number of observed or counted defects to the number of units processed. Looking at the DPU provides some benefits: • Suppose that your Newsletter group issued one newsletter this week with a total of one observed defect for the week; last week, the group issued six newsletters, with a total of two observed defects for the week. • If you only count defects, you find one defect this week and two last week. This week looks better than last week. • If you look at DPU, you find that this week 100% of units contained defects. Last week, only 33% of units contained defects.
- 5. To Err Is Human: Applying Six Sigma Quality Concepts To Technical Communications, Amy Friend, c 1999 • If there is variability in the process volume, looking at the DPU will normalize the variability somewhat so that you can make valid comparisons of the quality from one week to the next. Figure: Tracking DPU for Newsletter Quality In the figure above, notice the reduction in defects per unit (DPU) as improvements are implemented. Opportunities Opportunities are used when it is necessary to compare a simple product, process, or service to a more complex one. For example: is it fair to compare the DPU of a Newsletter process to that of a Service Document process? No! The Newsletter process is simpler, shorter, and has fewer chances for errors than that of the Service Documentation process. Two aspects to keep in mind when identifying opportunities include: • Opportunities are counted by the people who own/do the process • Opportunities are measured once and do not change unless the process changes DPO Defects per Opportunity (DPO) takes observed Defects per Unit (DPU) and divides them by the number of opportunities (O) per unit. DPMO Typically this number is very small. Multiply by a million to get a number that is easier to deal with. The result is called Defects Per Million Opportunities (DPMO). DPU is typically the measure used to track internal operations. DPMO is the number used to identify the sigma level and is also the number used when benchmarking with other external organizations. 1998 Newsletter DPU 0 10 20 30 40 50 1 2 3 4 5 6 7 8 9 10 11 12 Month DPU
- 6. To Err Is Human: Applying Six Sigma Quality Concepts To Technical Communications, Amy Friend, c 1999 Equations DPU = Total Number of Defects Counted . Total Number of Units Completed in same time DPO = DPU . Total Number of Opportunities DPMO = DPO X 1 million SIGMA It is the DPMO number that identifies the sigma level. While there are lengthy calculations that can be done to determine the sigma level for the DPMO, it is easier to use a Sigma Table. Sigma Level Defects Per Million Opportunities 3.0 66,811 3.5 22,750 4.0 6,210 4.5 1,350 5.0 233 5.5 32 6.0 3.4 6.5 0.3 Table: Sigma Look-up Table How is Sigma used? Sigma is used to: • Benchmark with other companies • Improve the quality of products, processes, and services • Improve customer satisfaction • Set challenging goals for teams and companies
- 7. To Err Is Human: Applying Six Sigma Quality Concepts To Technical Communications, Amy Friend, c 1999 How do I start? Measure Current Defects 1. Define Defects First define the defects for your product, service and/or process. Define them in terms of what is important to the customers. It may be helpful to brainstorm defects. Consider the customer complaints received. Consider the things that really upset the process owners. Look at the process flow to help generate the list. The Motorola team used error categories to define defects in their publications. Error Category Types of Defects Text Structure Defects of grammar, syntax, spelling, reference accuracy, cohesiveness of thought, ambiguity, and consistency in abbreviations and terms Graphic Aspects Defects of illustration quality and the consistency of the illustrations to the format required both by the client and the Technical Communications Group’s graphics standards Client Direction Defects exceeding a stated reading-grade level, not adhering to customer or internal department specifications, or incorrect page layout Technical Accuracy Defects found in the process of a Subject- Matter Expert (SME) review of technical text (i.e. the theory is incorrect as stated), or validation/verification of the text by the customer. Customer in this case may be either the SME or an external end-user Procedural Accuracy Defects found during a “tabletop” validation (reading the steps) of all procedural material, or by actually using the steps to operate the equipment described in the document to see if they work Table: Motorola Error Categories These categories are used for all kinds of publications, regardless of length or purpose. They provided a common frame of reference for every document checked. These categories make the metric more specific in terms of what is most important to the customers, not the internal process owners. They also enable the team to pinpoint the areas that need the most improvement later in the process.
- 8. To Err Is Human: Applying Six Sigma Quality Concepts To Technical Communications, Amy Friend, c 1999 2. Count Defects Next, count the defects. How many errors are there? Keep a tally of each kind of defect. It is important to ensure consistency of how defects are counted. To do this consider these aspects: 1. Develop a defect counting tool. 2. Train editors/writers on use of the tool and definition of defects. Keep tools simple and easy to use. The more complex a tool is, the more chance there is for people to not use them or to not use them correctly. Training people on how to use tools and apply quality concepts helps to ensure that the results are meaningful, consistent, and accurate. Demonstrate how to apply defect-tracking tools. Provide coaching on the job while people are just starting to use new tools.
- 9. To Err Is Human: Applying Six Sigma Quality Concepts To Technical Communications, Amy Friend, c 1999 Refer to the figure for an example of how Motorola applied the concept of a tool. Publication Quality Tracking Form Job title: “Georgia” Proposal Date: May 12, 1993 Team Leader: G. Giddy Charge Number: 12345-4321 Job Number: 5512 Client/Customer: Joan Smythe Applicable Specifications: Standard Newsletter format Sample Size (pg.) Sample = 30 + 0.3 (147-30) = 41 Weighting Factors Pages Checked Customer Weight Defects Counted A. Text Structure • Spelling • Grammar • Syntax • Ref. Accuracy • Consistency 41 0.6 2 B. Graphic Aspects • Illustration quality • Consistent to format Simple: Medium: Complex: 8 0.25 2 C. Technical Accuracy • Tabletop validation • SME review 0 0 D. Procedural Accuracy • Tabletop • Validation/verific ation 0 0 E. Client/Customer Direction • Reading grade level • Page layout • Spec adherence 41 0.15 1 Table: Motorola Matrix Check Sheet Example
- 10. To Err Is Human: Applying Six Sigma Quality Concepts To Technical Communications, Amy Friend, c 1999 Notice that Motorola also applied two more factors: • Customers weight the importance of each element. This helps to focus improvements on areas most important to customers’ requirements. • Determination of appropriate sample size. Publication departments produce thousands of pages or screens of documentation. Defining a significant sample size allows the department to not have to count defects on every page/screen of every document. A Case Study Figure: Sample Process This example shows a simple process for developing a newsletter. The process starts with a request to write a newsletter and ends when the customer receives the newsletter. In this example a unit is defined as one newsletter request. Defects tracked include: • Text Structure • Graphic Aspects • Client Direction • Technical Accuracy • Procedural Accuracy The table analyzes the DPU for this simple process: SME Correct? Type Newsletter Mail Newsletter Proofread Approve Request Gather content No Yes Customer
- 11. To Err Is Human: Applying Six Sigma Quality Concepts To Technical Communications, Amy Friend, c 1999 Gather Type Proofread Approve Mail Observed Defects 0 2 10 0 0 Units 20 20 20 20 20 DPU 0 0.1 0.5 0 0 Cumulative DPU 0 0.1 0.6 0.6 0.6 Table: Defect Analysis for DPU • The Units row shows that 20 newsletters were completed during this period. • The Observed Defects row shows 2 defects found in typing, ten defects found in proofreading, and zero defects found in approval and mailing. • The DPU row shows that, normalized over 20 newsletters, .1 defects per unit were found in typing and .5 defects per unit were found in proofreading. • The Cumulative DPU row shows the running total DPU for each step, the total cumulative DPU being .6. By analyzing the process this way, you can quantify the overall quality level, check that proper inspections are built-in, and identify areas of the process that need improvement. Some escaping defects were identified through customer complaints. Two customers found errors in their newsletters and one newsletter was not received. While these defects were not calculated as part of the defect analysis, they are helpful to understand improvements needed. Now we want to be able to compare the quality of the newsletters with the quality of the customer user guides. To do this, factor in the opportunities. Gather Type Proofre ad Approve Mail Total DPU 0 0.1 0.5 0 0 0.6 Opportunities 20 180 5 1 2 208 DPO 0 .0005555 0.1 0 0 0.002884 DPMO 0 555 100000 0 0 2884.6 SIGMA Level 7 5 4.6 Table: Defect Analysis for DPO • The DPU row is carried over from the previous table. • The Opportunities row shows the number of opportunities identified for each step. There are a total of 208 opportunities for defects in the
- 12. To Err Is Human: Applying Six Sigma Quality Concepts To Technical Communications, Amy Friend, c 1999 newsletter process. To get these each step was analyzed by the writers. The number of opportunities remains the same each week unless there is a change to the process. • To calculate the DPO, divide the DPU by the number of opportunities. • The Total DPO for the process is .002884. • To calculate the DPMO, multiply the DPO by one million. The final DPMO for the newsletter process is 2884.6. • To determine the sigma level, look up the DPMO in the SIGMA Table. The cumulative sigma level for the newsletter process is 4.6. How do I improve Sigma? Analyze Baseline Data Understand the defect calculations for the process. What defects are counted? What opportunities were include? What is the DPU of the process? Is the process stable? You’ll need to understand your process very thoroughly to compare it to others. How Good Is Good Enough: Set a Goal A six-sigma rating indicates best-in-class status. However, six-sigma may not be the best goal for every application. Some cases may require higher than six-sigma and others may allow for less than six-sigma. To identify the best goal, you need to understand what is expected and what is possible. What do your customers expect? Are the results of a six-sigma process acceptable? For examples, refer to the table below: Comparing Performance: 99.9% Defect Free 6 Sigma Wrong prescriptions 20,000 per year 68 per year Babies dropped 15,000 per year 51 per year Unsafe drinking water 1 hour per month 12 seconds per month No telephone service or television 10 minutes per week 2 seconds per week Short or long landings at O’Hare 2 per day 5 per 2 years Incorrect surgical procedures 500 per week 88 per year Lost articles of mail 2,000 per hour 160 per day
- 13. To Err Is Human: Applying Six Sigma Quality Concepts To Technical Communications, Amy Friend, c 1999 Table: Comparing Performances Also, we need to understand what is possible. How capable is our process? How good are other similar processes? How much room for improvement is there? A statistician may be helpful in calculating the process capability. If you don’t have such a resource, what does your experience tell you about the quality of the process? Is there room for improvement? Conduct some research to determine how good competitors perform and how good is good enough. The December 1994 issue of Quality Progress reports that “most quality- conscious companies averaged a four-sigma level at the beginning of 1990, with the exception of the domestic airline flight fatality rate, which was better than six sigma.” This points out the need for different goals depending on how critical the results are. If it is not possible to compare to other departments outside your company, compare with other processes inside your company. Comparitive processes need not be competitive processes. You can learn a lot by understanding other processes that have different products with similar goals. For example, any company regardless of their product can learn about great customer satisfaction from observing the practices of LLBEAN or Disney. Analyze If there is a gap to close, then work to close the gap. The rate of improvement will depend on the size of the gap and the impact on customers needs. If your business is eroding quickly due to large defect issues, you may want to speed of the rate of improvement. If your process shows that it is already at a higher sigma rate than competitors or that customer complaints are not severe, then the rate of improvement may be slower. It may only be necessary to improve enough to stay ahead of the pack. Conduct Defect Analysis Prioritize the types, frequency, and cost of defects. Target root cause analysis based on frequency and financial impact. Check out the process flow map and look for opportunities to make the process more robust. Are there places where verifications and checks can be added to prevent defects before they escape to the customers? Find Underlying Causes and Remove Through Projects Determine root causes of defects by either: • Asking “why?” 5 times • Completing an Fishbone Cause and Effect Diagram Table: Example of 5 Why’s
- 14. To Err Is Human: Applying Six Sigma Quality Concepts To Technical Communications, Amy Friend, c 1999 Improvements may take many forms. They may be changes to: • Process (i.e. eliminate, simplify, or automate steps to process, addition of editor) • Policies (i.e. requirements in approvals) • People (i.e. training, entry skills, etc.) • Tools/equipment (i.e. upgrade of tools to include more robust spell- checker) Verify and Monitor Improvement Continue to track the DPU. Verify that the process stays in control. If the DPU falls below target levels, identify the cause and make corrections. This step is most important to ensure that the time invested to make improvements is not wasted later due to lack of conformance to process improvements. Case Study Continued Comparitive Process: Web Page Development Since this group has no external processes to compare against, they compared against another process in the company: the web development process. Gather Input & Design Edit Approve Post Totals Defects Observed 0 2 10 0 0 12 Units 20 20 20 20 20 20 DPU 0 0.1 0.5 0 0 0.6 Opportunities 5 100 5 1 1 112 DPO 0 0.001 0.1 0 0 0.005357 DPMO 0 1000 100000 0 0 5357.1 SIGMA Level Table: Defect Analysis for Web Process Pareto Defects Defect Quantity Cost Text Structure 2 $50 Graphics 3 $150
- 15. To Err Is Human: Applying Six Sigma Quality Concepts To Technical Communications, Amy Friend, c 1999 Client direction 0 $0 Technical Accuracy 6 $300 Procedural Accuracy 1 $25 Total 12 $525 Table: Example of Root Cause Analysis This example applies the method of asking “why?” five times for the problem of too many technical defects. Why? Answer 1. Why are there so many technical errors? Errors are not noticed during technical proofreading. 2. Why are errors not noticed? SME’s do not see them. 3. Why don’t SME’s see errors? They don’t know a lot about the product. 4. Why don’t SME’s know a lot about product? They don’t have a lot of time to work with the product. 5. Why don’t SME’s have much time to work with the product? There isn’t a product available for them in the department. Table: Example of 5 Why’s Possible Improvements In the example, the real problem to address is getting enough equipment and product exposure for the Subject Matter Experts. Summary In a time when competition is strong and the need for value is increasing, every person in any job must continue to improve how they work. Six-sigma provides some basic tools to apply to help us achieve this. Metrics like DPU enable us to track and monitor the health of our processes. Metrics like DPMO enables us to compare our quality to others so that we can answer the question “how good is good enough?” Using accepted quality tools such as process flow mapping, graphing data, and root cause analysis enable us to focus limited resources in the best ways. To err is human, but not every human strives for improvement. Six-sigma is one methodology to attain good quality products, services and processes.
- 16. To Err Is Human: Applying Six Sigma Quality Concepts To Technical Communications, Amy Friend, c 1999 References • McFadden, Fred R. (1993). “Six-Sigma Quality Programs.” Quality Progress; June, pp. 37-42. • Fontenot, Gwen, Behara, Ravi, and Gresham, Alicia (1994). “Six sigma in Customer Satisfaction.” Quality Progress; December, pp. 73-75. • Tadikamalla, Pandu R. (1994). “The Confusion Over Six sigma Quality.” Quality Press; November, 1994, pp83-85. • National Center for Manufacturing Sciences (1996). An Introduction to Six Sigma. (Interactive Distance Learning Course Guide). National Center for Manufacturing Sciences, Inc., US. • Holt, Roger W. & Millman, Jack H. (1993). A Methodology for Measurement of Publications Quality. Motorola University Press, Addison-Wesley Publishing Group, Reading Massachusetts. • Smith, Bill. (1993) “Six Sigma Quality: A Must Not A Myth.” Machine Design; February 12, pp.63-66. • Pyzdek, Thomas. (1996) The Complete Guide to the CQM. Quality Publishing, Inc., Tucson, Arizona • Cortada, James, & Woods, John (1995). McGraw-Hill Encyclopedia of Quality Terms & Concepts. McGraw-Hill, Inc., USA. • Allied Signal (1999). Achieving Six Sigma [Online]. Available: http://wwwmpcps.com/A6S.html[1999, February]. • Eastman Kodak Company (1996). Getting Started With 10X. Rochester, NY. Amy S. Friend Amy Friend is a Certified Quality Improvement Facilitator for Eastman Kodak Company. In this position she helps groups to improve their processes using quality principles. Prior to this, Amy developed and delivered training programs as an Instructional Designer. Amy is also Adjunct Faculty at RIT where she teaches Instructional Design Principles. She develops and teaches classroom and distance-learning courses. Amy has served as President, Vice President, and Treasurer for the Rochester Chapter of STC. She presents frequently for STC and has presented/published at the International-level. She has chaired the spectrum planning committee twice and has been a volunteer on this committee for the past seven years. Currently she is serving as Web Master and Strategic Planning Committee Chair. She has published a number of articles and presentations on a variety of process improvement topics including cost of quality, cycle time, dealing with change, and sigma quality.