Download as PDF, PPTX

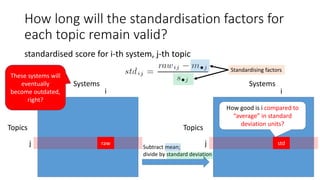
![Score standardisation [Webber+08]
standardised score for i-th system, j-th topic
j
i
raw
Topics
Systems
j
i
std
Topics
Systems
Subtract mean;
divide by standard deviation
How good is i compared to
“average” in standard
deviation units?
Standardising factors](https://image.slidesharecdn.com/airs2016-161125083819/85/AIRS2016-5-320.jpg)
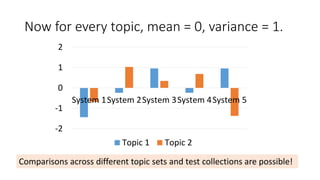
![Standardised scores have the [-∞, ∞] range
and are not very convenient.
-2
-1
0
1
2
System 1System 2System 3System 4System 5
Topic 1 Topic 2
Transform them back into the [0,1] range!](https://image.slidesharecdn.com/airs2016-161125083819/85/AIRS2016-7-320.jpg)
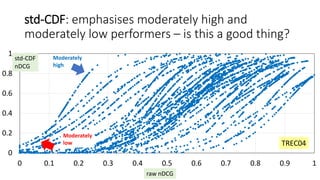
![std-CDF: use the cumulative density function of
the standard normal distribution [Webber+08]
0
0.2
0.4
0.6
0.8
1
0 0.1 0.2 0.3 0.4 0.5 0.6 0.7 0.8 0.9 1
TREC04
Each curve is
a topic, with
110 runs
represented
as dots
raw nDCG
std-CDF
nDCG](https://image.slidesharecdn.com/airs2016-161125083819/85/AIRS2016-8-320.jpg)
![std-AB: How about a simple linear
transformation? [Sakai16ICTIR]
0
0.2
0.4
0.6
0.8
1
0 0.1 0.2 0.3 0.4 0.5 0.6 0.7 0.8 0.9 1
std-CDF nDCG std-AB nDCG (A=0.10) std-AB nDCG (A=0.15)
TREC04
raw nDCG](https://image.slidesharecdn.com/airs2016-161125083819/85/AIRS2016-10-320.jpg)
![std-AB with clipping, with the range [0,1]
Let B=0.5 (“average” system)
Let A=0.15 so that 89% of scores fall within [0.05, 0.95]
(Chebyshev’s inequality)
For EXTREMELY good/bad systems…
This formula with (A,B) is used in educational
research: A=100, B=500 for SAT, GRE [Lodico+10],
A=10, B=50 for Japanese hensachi “standard scores”.](https://image.slidesharecdn.com/airs2016-161125083819/85/AIRS2016-11-320.jpg)
![[Sakai16ICTIR] bottom line
• Advantages of score standardisation:
- removes topic hardness, enables comparison across test collections
- normalisation becomes unnecessary
• Advantages of std-AB over std-CDF:
Low within-system variances and therefore
- Substantially lower swap rates (higher consistency across different
data)
- Enables us to consider realistic topic set sizes in topic set design
Swap rates for std-CDF can be higher than
those for raw scores, probably due to its
nonlinear transformation
std-AB is a good alternative to std-CDF.](https://image.slidesharecdn.com/airs2016-161125083819/85/AIRS2016-13-320.jpg)
![Topic set size design (1) [Sakai16IRJ]
• Provides answers to the following question:
“I’m building a new test collection. How many topics should I create?”
• A prerequisite: a small topic-by-run score matrix based on pilot data,
for estimating within-system variances.
• Three approaches (with easy-to-use Excel tools), based on
[Nagata03]:
(1) paired t-test power
(2) one-way ANOVA power
(3) confidence interval width upperbound.](https://image.slidesharecdn.com/airs2016-161125083819/85/AIRS2016-15-320.jpg)
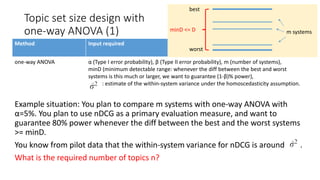
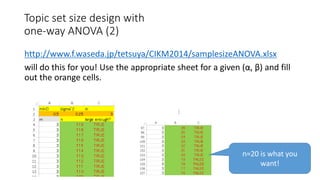
![Topic set size design (2) [Sakai16IRJ]
Method Input required
Paired t-test α (Type I error probability), β (Type II error probability),
minDt (minimum detectable difference: whenever the diff between two systems is this
much or larger, we want to guarantee (1-β)% power),
: variance estimate for the score delta.
one-way ANOVA α (Type I error probability), β (Type II error probability), m (number of systems),
minD (minimum detectable range: whenever the diff between the best and worst
systems is this much or larger, we want to guarantee (1-β)% power),
: estimate of the within-system variance under the homoscedasticity assumption.
Confidence intervals α (Type I error probability),
δ (CI width upperbound: you want the CI for the diff between any system pair to be this
much or smaller),
: variance estimate for the score delta.](https://image.slidesharecdn.com/airs2016-161125083819/85/AIRS2016-16-320.jpg)
![Topic set size design (3) [Sakai16IRJ]
Test collection designs should evolve based on past data
topic-by-run
score matrix with
pilot data
About 25 topics
with runs from
a few teams
probably sufficient
[Sakai+16EVIA]
n1 topics
m runs
Estimate n1 based on the
within-system variance
estimate
TREC 201X TREC 201(X+1)
n2 topics
n0 topics
Estimate n2 based on the
within-system variance
estimate
A more accurate estimate](https://image.slidesharecdn.com/airs2016-161125083819/85/AIRS2016-17-320.jpg)
![Topic set size design (4) [Sakai16IRJ]
ANOVA-based results for
m=10 can be used instead
of CI-based results
ANOVA-based results for
m=2 can be used instead of
t-test-based results
In practice, you can deduce t-test-based and CI-based results from ANOVA-based results
Caveat: the ANOVA-based tool can only
handle (α, β)=(0.05, 0.20), (0.01, 0.20),
(0.05, 0.10), (0.01, 0.10).](https://image.slidesharecdn.com/airs2016-161125083819/85/AIRS2016-18-320.jpg)
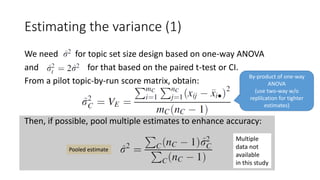
![Why the variances are smaller after applying std-AB
The initial estimate of n with the one-way ANOVA topic set size design
is given by [Nagata03]
where,
for (α, β)=(0.05, 0.20), λ ≒
So n will be small if is small.
With std-AB, is indeed small because A is small (e.g. 0.15) and it can
be shown that
Noncentrality parameter of a noncentral
chi-square distribution](https://image.slidesharecdn.com/airs2016-161125083819/85/AIRS2016-24-320.jpg)
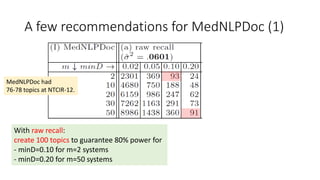
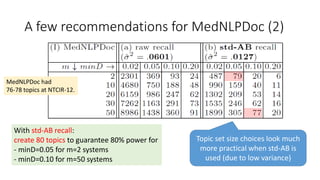
![MedNLPDoc (1) [Aramaki+16]
https://sites.google.com/site/mednlpdoc/
• INPUT: a medical record
• OUTPUT: ICD (international classification of diseases) codes of
possible disease names
• MEASURES: precision and recall of ICDs
precision
recall
14 runs 14 runs
78 topics
76 topics](https://image.slidesharecdn.com/airs2016-161125083819/85/AIRS2016-26-320.jpg)
![MedNLPDoc (2) [Aramaki+16]
https://sites.google.com/site/mednlpdoc/
76 topics
Raw recall:
- Lots of 0’s
- Some 1’s
std-AB recall:
- No 0’s
- Fewer 1’s
0
100
200
300
400
500
600
700
0
50
100
150
200
250
300
350
score range score range](https://image.slidesharecdn.com/airs2016-161125083819/85/AIRS2016-27-320.jpg)
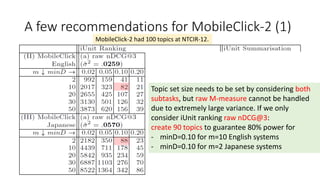
![MobileClick-2 iUnit ranking (1) [Kato+16]
http://mobileclick.org/
• INPUT: iUnits (relevant nuggets for a mobile search summary)
• OUTPUT: iUnits ranked by relevance
• MEASURES:
nDCG [Jarvelin+02]
= Σ g(r)/log(r+1) / Σ g*(r)/log(r+1)
Q-measure [Sakai05AIRS04]
= (1/R) Σ I(r) BR(r) where BR(r) = ( Σ I(k) + β Σ g(k) )/( r + βΣ g*(k) )
l
r=1
l
r=1
r
r
k=1
r
k=1
r
k=1
gain at r in an ideal list
1 if relevant, 0 otherwise](https://image.slidesharecdn.com/airs2016-161125083819/85/AIRS2016-28-320.jpg)
![MobileClick-2 iUnit ranking (2) [Kato+16]
http://mobileclick.org/
Raw nDCG:
- hard topics, easy topics
0
100
200
300
400
500
600
700
0
100
200
300
400
500
600
700
std-AB nDCG:
- topics look more comparable
to one another](https://image.slidesharecdn.com/airs2016-161125083819/85/AIRS2016-29-320.jpg)
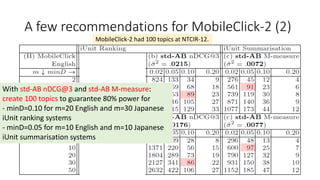
![MobileClick-2 iUnit summarisation (1) [Kato+16]
http://mobileclick.org/
• INPUT: iUnits (relevant nuggets for a mobile search summary)
• OUTPUT: two-layered textual
summary
• MEASURES:
M-measure, a variant of the
intent-aware U-measure
[Sakai+13SIGIR]
M-measure is an unnormalised
measure: does not have the [0,1] range.
(Intent-aware measures difficult to normalise.)
[Kato+16]](https://image.slidesharecdn.com/airs2016-161125083819/85/AIRS2016-30-320.jpg)
![MobileClick-2 iUnit summarisation (2) [Kato+16]
http://mobileclick.org/
Raw M-measure:
- unnormalised, unbounded,
extremely large variances
- topics definitely not comparable
(note the different scale of the y axis)
std-AB M-measure:
- no problem!
0
100
200
300
400
500
0
100
200
300
400
500
600
40-45 0.9-1.0
Clearly violates
i.i.d](https://image.slidesharecdn.com/airs2016-161125083819/85/AIRS2016-31-320.jpg)
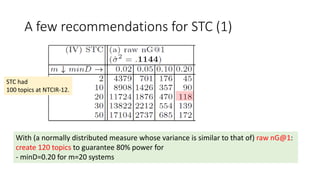
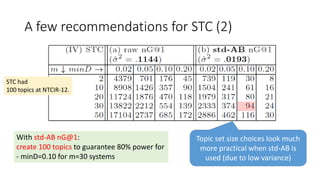
![STC (short text conversation) (1) [Shang+16]
http://ntcir12.noahlab.com.hk/stc.htm
• INPUT: a Weibo post (Chinese tweet)
• OUTPUT: a ranked list of Weibo posts from a repository that serve as valid
responses to the input
• MEASURES:
nG@1
(normalised gain at 1,
a.k.a. “nDCG@1”)
nERR@10
[Chapelle11]
P+ [Sakai06AIRS]
a variant of Q-measure](https://image.slidesharecdn.com/airs2016-161125083819/85/AIRS2016-32-320.jpg)
![STC (short text conversation) (2) [Shang+16]
http://ntcir12.noahlab.com.hk/stc.htm
Raw P+:
- Lots of 1’s 0’s
- Gap in the [0.625, 1] range
(see previous slide)
std-AB P+:
- Looks like a continuous measure!
- Fewer 1’s
- No 0’s
0
0.1
0.2
0.3
0.4
0.5
0.6
0.7
0.8
0.9
1
1
4
7
10
13
16
19
22
25
28
31
34
37
40
43
46
49
52
55
58
61
64
67
70
73
76
79
82
85
88
91
94
97
100
0
0.1
0.2
0.3
0.4
0.5
0.6
0.7
0.8
0.9
1
1
4
7
10
13
16
19
22
25
28
31
34
37
40
43
46
49
52
55
58
61
64
67
70
73
76
79
82
85
88
91
94
97
100
0
500
1000
1500
0
500
1000
1500](https://image.slidesharecdn.com/airs2016-161125083819/85/AIRS2016-33-320.jpg)
![STC (short text conversation) (3) [Shang+16]
http://ntcir12.noahlab.com.hk/stc.htm
Raw nG@1:
- 0 or 1/3 or 1!
0
1000
2000
3000
0
500
1000
1500
2000
2500
std-AB nG@1:
- Looks like a continuous measure!
- Fewer 1’s
- No 0’s](https://image.slidesharecdn.com/airs2016-161125083819/85/AIRS2016-34-320.jpg)
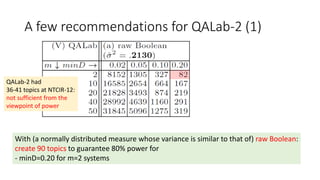
![QALab-2 (1) [Shibuki+16]
http://research.nii.ac.jp/qalab/
• INPUT: a multiple-choice Japanese National Center Test (university
entrance exam) question on world history
• OUTPUT: choice deemed correct by system
• MEASURES:
Boolean: 1 (correct) or 0 (incorrect)](https://image.slidesharecdn.com/airs2016-161125083819/85/AIRS2016-35-320.jpg)
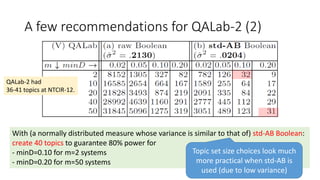
![QALab-2 (2) [Shibuki+16]
http://research.nii.ac.jp/qalab/
36 topicsRaw Boolean:
- 0 or 1!
std-AB Boolean:
- Two distinct ranges of values
[0.2999, 0.4460] and [0.6091, 0.9047]
Normal assumption still clearly violated: our topic set size design
results should be interpreted as those for normally-distributed measures
that happen to have variances similar to Raw/std-AB Boolean.
QALab-2 organisers sorted the topics
by #systems_correctly_answered
before providing the matrices to the present author
0
200
400
600
800
0
200
400
600](https://image.slidesharecdn.com/airs2016-161125083819/85/AIRS2016-36-320.jpg)


![Selected references (1)
[Aramaki+16] Aramaki et al.: Overview of the NTCIR-12 MedNLPDoc task, NTCIR-12
Proceedings, 2016.
[Carterette+08] Carterette et al.: Evaluation over Thousands of Queries, SIGIR 2008.
[Chapelle+11] Chapelle et al.: Intent-based Diversification of Web Search Results: Metrics
and Algorithms, Information Retrieval 14(6), 2011.
[Jarvelin+02] Jarvelin and Kelalainen: Cumulated Gain-based Evaluation of IR techniques,
ACM TOIS 20(4), 2002.
[Gilbert+79] Gilbert and Sparck Jones:, Statistical Bases of Relevance assessment for the
`IDEAL’ Information Retrieval Test Collection, Computer Laboratory, University of
Cambridge, 1979.
[Kato+16] Kato et al.: Overview of the NTCIR-12 MobileClick task, NTCIR-12 Proceedings,
2016.
[Nagata03] Nagata: How to Design the Sample Size (in Japanese), Asakura Shoten, 2003.](https://image.slidesharecdn.com/airs2016-161125083819/85/AIRS2016-59-320.jpg)
![Selected references (2)
[Sakai05AIRS04] Sakai: Ranking the NTCIR Systems based on Multigrade Relevance, AIRS
2004 (LNCS 3411), 2005.
[Sakai06AIRS] Sakai: Bootstrap-based Comparisons of IR Metrics for Finding One Relevant
Document, AIRS 2006 (LNCS 4182).
[Sakai+13SIGIR] Sakai and Dou: Summaries, Ranked Retrieval and Sessions: A Unified
Framework for Information Access Evaluation, SIGIR 2013.
[Sakai16ICTIR] Sakai: A simple and effective approach to score standardisaiton, ICTIR 2016.
[Sakai16ICTIRtutorial] Sakai: Topic set size design and power analysis in practice (tutorial),
ICTIR 2016.
[Sakai16IRJ] Sakai: Topic set size design, Information Retrieval, 19(3), 2016. OPEN ACCESS:
http://link.springer.com/content/pdf/10.1007%2Fs10791-015-9273-z.pdf
[Sakai+16EVIA] Sakai and Shang: On Estimating Variances for Topic Set Size Design, EVIA
2016. http://research.nii.ac.jp/ntcir/workshop/OnlineProceedings12/pdf/evia/02-
EVIA2016-SakaiT.pdf](https://image.slidesharecdn.com/airs2016-161125083819/85/AIRS2016-60-320.jpg)
![Selected references (3)
[Shang+16] Shang et al.: Overview of the NTCIR-12 short text conversation task, NTCIR-12
Proceedings, 2016.
[Shibuki+16] Shibuki et al.: Overview of the NTCIR-12 QA Lab-2 task, NTCIR-12 Proceedings,
2016.
[SparckJones+75] Sparck Jones and Van Rijsbergen: Report on the Need for and Provision
on an `Ideal’ Information Retrieval Test Collection, Computer Laboratory, University of
Cambridge, 1975.
[Voorhees+05] Voorhees and Harman: TREC: Experiment and Evaluation in Information
Retrieval, The MIT Press, 2005.
[Voorhees09] Voorhees: Topic Set Size Redux, SIGIR 2009.
[Webber+08SIGIR] Webber, Moffat, Zobel: Score standardisation for inter-collection
comparison of retrieval systems, SIGIR 2008.
[Webber+08CIKM] Webber, Moffat, Zobel: Statistical power in retrieval experimentation,
CIKM 2008.](https://image.slidesharecdn.com/airs2016-161125083819/85/AIRS2016-61-320.jpg)

The document discusses score standardization techniques for evaluating information retrieval systems. It presents two main techniques: std-CDF and std-AB. Std-CDF emphasizes moderately high and low performing systems, while std-AB provides a simple linear transformation. Std-AB is shown to have lower within-system variances and more consistent rankings across collections compared to std-CDF. The document also discusses how score standardization can enable topic set size design and comparisons across different test collections. It provides examples applying std-AB to NTCIR-12 tasks, showing it reduces variances and does not change system rankings.


![[系列活動] Machine Learning 機器學習課程](https://cdn.slidesharecdn.com/ss_thumbnails/ml4ds02122017-170212005829-thumbnail.jpg?width=640&height=640&fit=bounds)