SlideShare a Scribd company logo
1 of 107
Download to read offline
Introduction to Statistical Tools 
for IR Experiments
https://www.slideshare.net/TetsuyaSakai/assia2019
More detailed slides:
https://www.slideshare.net/TetsuyaSakai/ecir2019tutorial
Tutorial materials:
http://waseda.box.com/SIGIR2018tutorial
A good book on this topic:
https://link.springer.com/book/10.1007/978‐981‐13‐1199‐4
Tetsuya Sakai (Waseda University)
11th June 2019@ASSIA 2019, Haikou, P.R.C. 1
Lecture Outline
• Introduction
• How to conduct t‐tests with R 
• How to conduct ANOVA with R; 
• How to conduct the Tukey HSD test with R; 
• How to conduct the randomised Tukey HSD test; 
• How to use topic set size design tools; 
• How to use power analysis tools.
• Summary
2
Statistical significance testing 
[Robertson81, p.23]
“having performed a comparison of two systems on 
specific samples of documents and requests, we may 
be interested in the statistical significance of the 
difference, that is in whether the difference we 
observe could be simply an accidental property of 
the sample or can be assumed to represent a 
genuine characteristic of the populations.”
3
Statistically significant result may not be 
practically significant (and vice versa)
“It must nevertheless be admitted that the basis for 
applying significance tests to retrieval results is not well 
established, and it should also be noted that 
statistically significant performance differences may be 
too small to be of much operational interest.” 
[SparckJones81, Chapter 12, p.243]
Karen Sparck Jones  
1935‐2007
Roger Needham 
1935‐2003
4
What do samples tell us about 
population means?
Are they the same? 5
Parametric tests for comparing means
• In IR experiments, we often compare sample means to 
guess if the population means are different.
• We often employ parametric tests (assume specific 
population distributions, e.g., normal)
‐ paired and two‐sample t‐tests 
(Are the m(=2) population means equal?)
‐ ANOVA (Are the m(>2) population means equal?)
‐ Tukey HSD test for m(m‐1)/2 system pairs
scores
EXAMPLE
(paired data) n topics
m systems
Sample mean for a system
6
Null hypothesis, test statistic, p‐value
• H0: tentative assumption that all 
population means are equal
• test statistic: what you compute 
from observed data – under H0, 
this should obey a known 
distribution (e.g. t‐distribution)
• p‐value: probability of observing 
what you have observed (or 
something more extreme) 
assuming H0 is true
Null hypothesis
test statistic t0
7
Type I error and statistical power
Reject H0
if p‐value <= α
test statistic t0
tinv(φ; α)
Can’t reject H0 Reject H0
H0 is true
systems are equivalent
Correct conclusion
(1‐α)
Type I error
α
H0 is false
systems are different
Type II error
β
Correct conclusion
(1‐β)
α/2 α/2
Statistical power: ability to 
detect real differences8
Type II error
Can’t reject H0
if p‐value > α
test statistic t0
tinv(φ; α)
Can’t reject H0 Reject H0
H0 is true
systems are equivalent
Correct conclusion
(1‐α)
Type I error
α
H0 is false
systems are different
Type II error
β
Correct conclusion
(1‐β)
α/2 α/2
9
Cohen’s five‐eighty convention
Can’t reject H0 Reject H0
H0 is true
systems are equivalent
Correct conclusion
(1‐α)
Type I error
α
H0 is false
systems are different
Type II error
β
Correct conclusion
(1‐β)
Statistical power: 
ability to detect 
real differencesCohen’s five‐eighty convention:
α=5%, 1‐β=80% (β=20%)
Type I errors 4 times as serious as Type II errors
The ratio may be set depending on specific situations
10
Lecture Outline
• Introduction
• How to conduct t‐tests with R 
• How to conduct ANOVA with R; 
• How to conduct the Tukey HSD test with R; 
• How to conduct the randomised Tukey HSD test; 
• How to use topic set size design tools; 
• How to use power analysis tools.
• Summary
11
Which search engine is better?
(paired data)
0.4 0.4
0.8 0.6
0.7 0.5
Some evaluation 
measure score
Sample size n = 3
12
Paired t‐test (1)
x1j : nDCG of System 1 for the j‐th topic
x2j: nDCG of System 2 for the j‐th topic
Assume that the scores are independent and that
Then  for per‐topic differences
From Theorem 4
13
Paired t‐test (2)
⇒
where 
Sample mean Sample variance
From Corollary 5
14
Paired t‐test (3)
Two‐sided test:
H0 : μ1 = μ2 H1 : μ1 ≠ μ2
Under H0 the following should hold:
Two‐sided vs one‐sided tests: See [Sakai18book] Ch.1
15
Paired t‐test (4)
Under H0 ,                                                        should 
hold. 
So reject H0 iff
The difference is statistically significant 
at the significance criterion α
16
Loading 20topics3runs.mat.csv to R
sample means
17
Paired t‐test with R
Compare with the Excel case 
Two‐sided test 
18
Which search engine is better?
(unpaired data)
0.4
0.8
0.7
1.0
0.8
0.1
0.5
n1 = 3
n2 = 4
19
Two‐sample t‐test (1)
x1j : nDCG of System 1 for the j‐th topic (n1 topics)
x2j: nDCG of System 2 for the j‐th topic (n2 topics)
Assume that the scores are independent and that
Homoscedasticity (equal variance) assumption.
But the t‐test is actually quite robust to the assumption
violation. For a discussion on Student’s and Welch’s 
t‐tests, see [Sakai16SIGIRshort, Sakai18book]
20
Two‐sample t‐test (2)
⇒
Sample means
From Corollary 6
Pooled variance
21
Two‐sample t‐test (3)
H0 : μ1 = μ2 H1 : μ1 ≠ μ2
Under H0 the following should hold:
So reject H0 iff
22
Two‐sample (Student’s) t‐test with R
Two‐sided test 
Compare with the Excel case 
23
Lecture Outline
• Introduction
• How to conduct t‐tests with R 
• How to conduct ANOVA with R; 
• How to conduct the Tukey HSD test with R; 
• How to conduct the randomised Tukey HSD test; 
• How to use topic set size design tools; 
• How to use power analysis tools.
• Summary
24
Analysis of Variance
• A typical question ANOVA addresses:
Given observed scores for m systems,
are the m population means all equal or not?
• ANOVA does NOT tell you which system means are 
different from others. 
• If you are interested in the difference between 
every system pair (i.e. obtaining m(m‐1)/2 p‐values), 
conduct an appropriate multiple comparison 
procedure, e.g. Tukey HSD test. No need to do 
ANOVA before Tukey HSD.
25
One‐way ANOVA, equal group sizes (1)
• Data format:
• Basic assumption:
or
• Question: Are the m population means equal?
unpaired data, but
equal group sizes
(e.g. #topics)
homoscedasticity
Generalises the two‐sample t‐test, and can handle unequal
group sizes as well. See [Sakai18book]
population mean for System i
26
One‐way ANOVA, equal group sizes (2)
Let
Null hypothesis:
⇔
μ2 = μ3 = 0.2
μ = 0.3
μ1 = 0.5
a1 = 0.2
a2 = ‐0.1 a3 = ‐0.1
population grand mean i‐th system effect
All population means are equal (to μ)
m=3
27
One‐way ANOVA, equal group sizes (3)
Let
Clearly, 
sample grand mean System i’s sample mean
Diff between
an individual score
and the grand mean
can be broken down
into…
Diff between
the system mean
and the grand mean
and…
Diff between
the individual score
and the grand mean
28
One‐way ANOVA, equal group sizes (4)
Interestingly, this also holds:
Between‐system
sum of squares
Within‐system sum of squares
Total sum of squares (variations)
29
One‐way ANOVA, equal group sizes (5)
⇒
From Theorem 9
From Theorem 7
30
One‐way ANOVA, equal group sizes (6)
As for SA , since
⇒
⇒ Under H0 ,
⇒ Under H0 ,
From Corollary 1
From Corollary 9
31
One‐way ANOVA, equal group sizes (7)
⇒ By definition, under H0 , 
Under H0 :
32
One‐way ANOVA, equal group sizes (8)
Under H0 ,
so reject H0 iff
Conclusion: probably 
not all population 
means are equal
33
One‐way ANOVA with R (1)
Here, just as an exercise, treat the matrix as if it’s unpaired
data (i.e., sample sizes equal but no common topic set)
The sample means (mean nDGG scores) suggest
System1 > System2 > System3.
But is the system effect statistically significant?
34
One‐way ANOVA with R (2)
mat is a 20x3 topic‐by‐run matrix:
Let’s convert the format for convenience…
35
One‐way ANOVA with R (3)
A 60x2 data.frame Gather all 
columns of mat
36
One‐way ANOVA with R (4)
• φA = m‐1 = 3‐1 = 2
• φE1 = m(n‐1) = 3(20‐1) = 57
The system effect 
is statistically significant 
at α = 0.05
p‐value
The three systems are probably not all equally effective,
but we don’t know where the difference lies.
37
Two‐way ANOVA without replication (1)
• Data format:
• Basic assumption: 
i‐th system effect
j‐th topic effect
A common topic set 
for all m systems
(paired data)
38
Two‐way ANOVA without replication (2)
Clearly,
sample grand mean System i’s sample mean
Topic j’s sample mean
39
Two‐way ANOVA without replication (3)
Similarly: 
Between‐topic
sum of squares
from one‐way
ANOVA
40
Two‐way ANOVA without replication (4)
It can be shown that under H0,
so reject H0 iff
The system effect is 
statistically significant at α
All population system
means are equal
41
Two‐way ANOVA without replication (5)
If also interested in the topic effect, under H0
so reject H0 iff
The topic effect is 
statistically significant at α
All population topic
means are equal
42
Two‐way ANOVA without 
replication with R (1)
Just inserting a column for topic IDs
43
Two‐way ANOVA without 
replication with R (2)
Just converting the data format
Gather all 
columns of mat
except Topic
A 60x3 data.frame
44
Two‐way ANOVA without 
replication with R (3)
• φA = 3‐1 = 2
• φB = 20‐1 = 19
• φE1 = (3‐1)*(20‐1)= 38
The system effect 
is statistically highly significant
(so is the topic effect)
The three systems are probably not all equally effective,
but we don’t know where the difference lies. 45
Lecture Outline
• Introduction
• How to conduct t‐tests with R 
• How to conduct ANOVA with R; 
• How to conduct the Tukey HSD test with R; 
• How to conduct the randomised Tukey HSD test; 
• How to use topic set size design tools; 
• How to use power analysis tools.
• Summary
46
Interested in the differences for all system pairs. 
So just repeat t‐tests m(m‐1)/2 times? (1)
The following is the same as repeating t.test with 
paired=TRUE for every system pair...
Compare with the
Paired t‐test with R slide
... but is NOT the right thing to do.
47
Interested in the differences for all system pairs. 
So just repeat t‐tests m(m‐1)/2 times? (2)
The following is the same as repeating t.test with 
var.equal=TRUE for every system pair...
Compare with the
Two‐sample (Student’s) t‐test with R slide
This means using Vp rather 
than VE1 from one‐way 
ANOVA
... but is NOT the right thing to do.
48
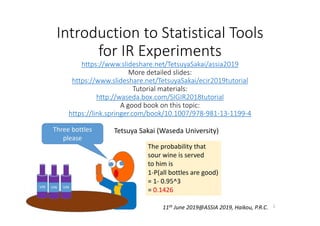
Don’t repeat a regular t‐test m(m‐1)/2 
times!
Why? Suppose a restaurant has a wine cellar. It is 
known that one in every twenty bottles is sour.
Pick a bottle; the probability 
that it is sour is
1/20 = 0.05
(Assume that we have an 
infinite number of bottles)
VIN VIN VIN VIN VIN VIN VIN VIN VIN VIN
49
A customer orders one bottle
A bottle of red 
please
The probability that 
sour wine is served 
to him is 0.05
VIN
50
A customer orders two bottles
Two bottles 
please
The probability that 
sour wine is served 
to him is
1‐P(both bottles are good)
= 1‐ 0.95^2
= 0.0975
VIN VIN
51
A customer orders three bottles
Three bottles 
please
The probability that 
sour wine is served 
to him is
1‐P(all bottles are good)
= 1‐ 0.95^3
= 0.1426
VIN VIN VIN
52
Comparisonwise vs Familywise error rate
(restaurant owner)
• The restaurant is worried not about the probability 
of each bottle being sour, but about the probability 
of accidentally serving sour wine to the customer 
who orders k bottles. The latter probability should 
be no larger than (say) 5%.
YOU SERVED ME SOUR WINE
I’M GONNA TWEET ABOUT IT
53
Comparisonwise vs Familywise error rate
(researcher)
• We should be worried not about the 
comparisonwise Type I error rate, but about the 
familywise error rate – the probability of making at 
least one Type I error among the k=m(m‐1)/2 tests. 
• Just repeating a t‐test k times gives us a familywise 
error rate of 1‐(1‐α)^k if the tests are independent.
e.g. α=0.05, k=10 ⇒ familywise error rate = 40%!
54
Multiple comparison procedures 
[Carterette12][Nagata+97]
• Make sure that the familywise error rate is no more 
than α.
• Stepwise methods: outcome of one hypothesis test 
determines what to do next
• Single step methods: test all hypotheses at the 
same time – we discuss these only.
‐ Bonferroni correction (considered obsolete)
‐ Tukey’s Honestly Significant Difference (HSD) test 
‐ others (e.g. those available in pairwise.t.test)
55
• Instead of conducting a t‐test k = m(m‐1)/2 times, 
consider the maximum difference (best system –
worst system) among the k differences.
• The distribution that the max difference obeys is 
called a studentised range distribution. Its upper 
100P% value is denoted by
• We compare the k differences against the above 
distribution. By construction, if the maximum is not 
statistically significant, the other differences are not 
statistically significant either. Thus the familywise 
error rate can be controlled.                            
How Tukey HSD works
qtukey(P, m, φ, lower.tail=FALSE) in R
56
Tukey HSD with equal group sizes (1)
Data structure: same as one‐way ANOVA with equal 
group sizes
Tukey HSD can handle unequal group sizes as well. See [Sakai18book]
sample mean
for System i
unpaired data
57
Null hypothesis             : 
the population means for 
systems i and i’ are equal
Test statistic: 
Reject            iff
Tukey HSD with equal group sizes (2)
58
R: Tukey HSD with equal group sizes
The data.frame we made for 
one‐way ANOVA
Only the diff between Systems 1 
and 3 statistically significant at 
α=0.05
59
Tukey HSD with paired observations (1)
Data structure: same as two‐way ANOVA without 
replication
sample mean
for Topic j
paired data
sample mean
for System i
60
Null hypothesis             : 
the population means for 
systems i and i’ are equal
Test statistic: 
Reject            iff
Tukey HSD with paired observations (2)
61
R: Tukey HSD with paired observations
The data.frame we made for two‐way 
ANOVA without replication
The difference between Systems 1 and 3 
and that between Systems 2 and 3 are 
statistically highly significant
62
Lecture Outline
• Introduction
• How to conduct t‐tests with R 
• How to conduct ANOVA with R; 
• How to conduct the Tukey HSD test with R; 
• How to conduct the randomised Tukey HSD test; 
• How to use topic set size design tools; 
• How to use power analysis tools.
• Summary
63
Computer‐based tests
• Unlike classical significance tests, do not require 
assumptions about the underlying distribution
• Bootstrap test [Sakai06SIGIR][Savoy97] – assumes 
the observed data are a random sample from the 
population. Samples with replacement from the 
observed data.
• Randomisation test [Smucker+07] – no random 
sampling assumption. Permutes the observed data.
64
Randomisation test for paired data (1)
Suppose we have an nDCG matrix for 
two systems with n topics. 
Are these systems equally effective?
65
Randomisation test for paired data (2)
Suppose we have an nDCG matrix for 
two systems with n topics. 
Are these systems equally effective?
Let’s assume there is a single hidden 
system. For each topic, it generates 
two nDCG scores. They are randomly 
assigned to the two systems.
66
Randomisation test for paired data (3)
If H0 is right, these alternative matrices
(obtained by randomly permuting each 
row of U) could also have occurred 
67
Randomisation test for paired data (4)
There are 2 possible matrices, but 
let’s just consider B of them 
(e.g. 10000 trials)
n
68
Randomisation test for paired data (5)
How likely is the observed difference (or something 
even more extreme) under H0? → p‐value
69
Randomisation test for paired data ‐
pseudocode
The exact p‐value changes slightly depending on B. 70
Random‐test in Discpower [Sakai14PROMISE]
http://research.nii.ac.jp/ntcir/tools/discpower‐en.html
Contains a tool for 
conducting a 
randomisation test or 
randomised Tukey HSD 
test
71
http://www.f.waseda.jp/tetsuya/20topics2runs.scorematrix
Mean difference and 
p‐value (compare 
with paired t‐test)
Paired randomisation test, B=5000 trials
A 20x2 matrix, 
white‐space‐separated
72
Randomised Tukey HSD test for paired data (1)
Suppose we have an nDCG matrix for 
more than two systems with n topics. 
Are these systems equally effective?
73
Suppose we have an nDCG matrix for 
more than two systems with n topics. 
Which system pairs are really 
different?
Randomised Tukey HSD test for paired data (2)
Let’s assume there is a single hidden 
system. For each topic, it generates m 
nDCG scores. They are randomly 
assigned to the m systems.
74
If H0 is right, these alternative matrices
(obtained by randomly permuting each 
row of U) could also have occurred 
Randomised Tukey HSD test for paired data (3)
75
Randomised Tukey HSD test for paired data (4)
There are (m!)   possible matrices, but 
let’s just consider B of them 
(e.g. 10000 trials)
n
76
How likely are the observed differences
given the null distribution of the maximum differences?
→ Tukey HSD p‐value
Randomised Tukey HSD test for paired data (5)
77
Randomised Tukey HSD – pseudocode
(adapted from [Carterette12])
The exact p‐value changes slightly depending on B. 78
http://www.f.waseda.jp/tetsuya/20topics3runs.scorematrix
Randomised Tukey HSD test, B=5000 trials
Compare the p‐values with 
those of the Tukey HSD test 
with R (paired data)
A 20x3 matrix, 
white‐space‐separated
79
Lecture Outline
• Introduction
• How to conduct t‐tests with R 
• How to conduct ANOVA with R; 
• How to conduct the Tukey HSD test with R; 
• How to conduct the randomised Tukey HSD test; 
• How to use topic set size design tools; 
• How to use power analysis tools.
• Summary
80
Effect sizes
P‐value = f(sample_size, effect_size)
‐ A large effect size ⇒ a small p‐value
‐ A large sample size ⇒ a small p‐value
For example, consider: 
From the paired 
t‐test
Magnitude of the difference
A large effect size (standardised mean difference) 
⇒ a large t‐value ⇒ a small p‐value
A large sample size (topic set size) 
⇒ a large t‐value ⇒ a small p‐value
Anything can be made 
statistically significant 
by making n large enough! 81
Statistical power: ability to detect 
real differences
Given α and an effect size that you are interested in 
(e.g. standardized mean difference >=0.2),
increasing the sample size n improves statistical power (1‐β).
‐ An overpowered experiment: n larger than necessary
‐ An underpowered experiment: n smaller than necessary 
(cannot detect real differences – a waste of research effort!)
Can’t reject H0 Reject H0
H0 is true
systems are equivalent
Correct conclusion
(1‐α)
Type I error
α
H0 is false
systems are different
Type II error
β
Correct conclusion
(1‐β)
82
http://sigir.org/files/museum/pub‐14/pub_14.pdf
[SparckJones+75]
83
On TREC topic set sizes [Voorhees09]
“Fifty‐topic sets are clearly too small to have 
confidence intervals in a conclusion when 
using a measure as unstable as P(10). Even for 
stable measures, researchers should remain 
skeptical of conclusions demonstrated on only 
a single test collection.”
TREC 2007 Million Query track [Allan+08] had “sparsely‐judged” 
1,800 topics, but this was an exception…
84
Deciding on the number of topics to 
create based on statistical 
requirements
• Desired statistical power [Webber+08][Sakai16IRJ]
• A cap on the confidence interval width for the mean 
difference [Sakai16IRJ]
• Sakai’s Excel tools based on [Nagata03]:
samplesizeTTEST2.xlsx (paired t‐test power)
samplesize2SAMPLET.xlsx (two‐sample t‐test power)
samplesizeANOVA2.xlsx (one‐way ANOVA power)
samplesizeCI2.xlsx (paired data CI width)
samplesize2SAMPLECI (two‐sample CI width)
85
• If you’re interested in the statistical power of the 
paired t‐test, two‐sample t‐test, or one‐way ANOVA, 
use samplesizeANOVA2.
• If you’re interested in the CI width of the mean 
difference for paired or two‐sample data, use 
samplesize2SAMPLECI. 
• … unless you have an accurate estimate of the 
population variance of the score differences
which the paired‐data tools 
require.
Recommendations on topic set 
size design tools
samplesizeTTEST2
samplesizeCI2See “Paired t‐test (1)”
86
α: Type I Error probability
β: Type II Error probability, i.e., you want 100(1‐β)% 
power (see below)
m: number of systems to be compared in one‐way 
ANOVA
minD: minimum detectable range, i.e., 
whenever the true difference D between 
the best and the worst systems is minD
or larger, you want to guarantee 100(1‐β)% power
: variance estimate for a particular evaluation 
measure (under the homoscedasticity assumption)
samplesizeANOVA2 input
μbest
μworst
D
m system means
87
samplesizeANOVA2: 
“alpha=.05, beta=.20” sheet (1)
Enter values in the orange cells (α=5%, β=20%):
m=10, minD=0.1,          =0.1
To ensure 80% power (at α=5%) for one‐way ANOVA 
with any m=10 systems with a minimum detectable 
range of 0.1 in terms of a measure whose variance is 
0.1, we need n=312 topics. μbest
μworst
D>= 0.1
m system means88
samplesizeANOVA2: 
“alpha=.05, beta=.20” sheet (2)
Enter values in the orange cells (α=5%, β=20%):
m=2, minD=0.1,          =0.1
To ensure 80% power (at α=5%) for one‐way ANOVA 
with any m=2 systems with a minimum detectable 
difference of 0.1 in terms of a measure whose 
variance is 0.1, we need n=154 topics. μbest
μworst
D>= 0.1 Two system means
89
samplesizeANOVA2: 
“alpha=.05, beta=.20” sheet (3)
Since one‐way ANOVA with m=2 systems is strictly 
equivalent to the two‐sample t‐test [Sakai18book],
To ensure 80% power (at α=5%) for the two‐sample 
t‐test with a minimum detectable difference of 0.1 in 
terms of a measure whose variance is 0.1, we need 
n=154 topics. μbest
μworst
D>= 0.1 Two system meansThis n can also be regarded as a pessimistic estimate
for the paired data case. 90
Estimating the common variance
If you have a topic‐by‐system score matrix or two 
from some pilot data, an unbiased estimator 
can be obtained as: 
A score matrix from 
test collection C
Pooled estimate
91
Some real estimates based on TREC 
data (using VE1 rather than VE2)
See “One‐way ANOVA, equal group sizes (8)”
Some measures are less stable ⇒ require larger topic set sizes under the same requirement
92
Some topic set size design results
The paired t‐test tool does not return tight estimates due to 
(covariance not considered)  93
1. Build a small data set first (or borrow one from a past 
task similar to your own).
2. Decide on a primary evaluation measure, and create 
a small topic‐by‐system score matrix with the small 
data set.
3. Compute         as VE1 or VE2 and use a topic set size 
design tool to decide on n.
4. You can advertise your test collection as follows:
“We created 70 topics, which, according to topic set size 
design with      = 0.044, is more than sufficient for 
achieving 80% power with a (paired) t‐test whenever the 
true difference in Mean nDCG@10 is 0.10 or larger.” 
So, to build a test collection…
See previous two slides
94
Lecture Outline
• Introduction
• How to conduct t‐tests with R 
• How to conduct ANOVA with R; 
• How to conduct the Tukey HSD test with R; 
• How to conduct the randomised Tukey HSD test; 
• How to use topic set size design tools; 
• How to use power analysis tools.
• Summary
95
Power analysis with R scripts 
[Sakai16SIGIR] (adapted from [Toyoda09])
• Given an adequately reported significance test 
result in a paper, 
‐ compute the effect size and the achieved power in 
that experiment.
‐ propose a new sample size to achieve a desired 
power.
Relies on the pwr library of R
96
The five R power analysis scripts
[Sakai16SIGIR]
• future.sample.paired (for paired t‐tests)
• future.sample.unpairedt (for two‐sample t‐tests)
• future.sample.1wayanova (for one‐way ANOVAs)
• future.sample.2waynorep (for two‐way ANOVAs 
without replication)
• future.sample.2wayanova2 (for two‐way ANOVAs)
97
future.sample.pairedt
Basically just enter t0 and the actual sample size
OUTPUT:
‐ Effect size dpaired
‐ Achieved power of the experiment
‐ future sample size for achieving 80% power
98
future.sample.pairedt: an actual 
example from a SIGIR paper
A highly underpowered experiment.
In future, use 244 topics, not 28, to achieve 80% 
power for this small effect (dpaired = 0.18).
Only 15% power!
Underpowered experiments can be a waste of research effort:
there’s a high chance that you will miss a true difference!
about 85% 99
future.sample.2waynorep
Basically just enter F0, the number of systems m
and the actual sample size
OUTPUT:
‐ A partial effect size [Sakai18book]
‐ Achieved power of the experiment
‐ future sample size for achieving 80% power 100
future.sample.2waynorep: an actual 
example from a SIGIR paper
A highly underpowered experiment.
In future, use 75 topics, not 17, to achieve 80% 
power for this small effect.
Only 18% power!
Underpowered experiments can be a waste of research effort:
there’s a high chance that you will miss a true difference!
about 82% 101
From [Sakai16SIGIR]
102
Underpowered/Overpowered
experiments: t‐tests
103
p.182
Underpowered/Overpowered
experiments: ANOVAs
104
p.184
Lecture Outline
• Introduction
• How to conduct t‐tests with R 
• How to conduct ANOVA with R; 
• How to conduct the Tukey HSD test with R; 
• How to conduct the randomised Tukey HSD test; 
• How to use topic set size design tools; 
• How to use power analysis tools.
• Summary
105
Summary
• It’s extremely easy to conduct significance tests 
with R. But understand the underlying assumptions 
first! Report the results with p‐values and effect 
sizes! (See the ECIR2019 tutorial slides.)
• To design a test collection, use some pilot data to 
estimate the variance of a particular evaluation 
measure for sample size considerations.
• To design an experiment, use a pilot or existing 
study for sample size considerations to ensure 
sufficient statistical power. Underpowered 
experiments can be a waste of research effort.
106
More info
More detailed slides (with references):
https://www.slideshare.net/TetsuyaSakai/ecir2019tutorial
Tutorial materials:
http://waseda.box.com/SIGIR2018tutorial
A good book on this topic:
https://link.springer.com/book/10.1007/978‐981‐13‐1199‐4
107

More Related Content

What's hot

Bibliometric Tools
Bibliometric ToolsBibliometric Tools
Bibliometric ToolsUCT
 
Journal and author impact measures Assessing your impact (h-index and beyond)
Journal and author impact measures Assessing your impact (h-index and beyond)Journal and author impact measures Assessing your impact (h-index and beyond)
Journal and author impact measures Assessing your impact (h-index and beyond)Aboul Ella Hassanien
 
Co word analysis
Co word analysisCo word analysis
Co word analysisdebolina73
 
Finding Journal Impact Factor using Journal Citation Reports
Finding Journal Impact Factor using Journal Citation Reports Finding Journal Impact Factor using Journal Citation Reports
Finding Journal Impact Factor using Journal Citation Reports Andiswa Mfengu
 
Journal Impact Factors and Citation Analysis
Journal Impact Factors and Citation AnalysisJournal Impact Factors and Citation Analysis
Journal Impact Factors and Citation Analysisrepayne
 
Researcher profiles and metrics that matter
Researcher profiles and metrics that matterResearcher profiles and metrics that matter
Researcher profiles and metrics that matterLibrary_Connect
 
Journal ranking metrices new perspective in journal performance management
Journal ranking metrices   new perspective in journal performance managementJournal ranking metrices   new perspective in journal performance management
Journal ranking metrices new perspective in journal performance managementAboul Ella Hassanien
 
Bibliometrics in the library
Bibliometrics in the libraryBibliometrics in the library
Bibliometrics in the libraryWouter Gerritsma
 
Journal ranking metrices new perspective in journal performance management
Journal ranking metrices   new perspective in journal performance managementJournal ranking metrices   new perspective in journal performance management
Journal ranking metrices new perspective in journal performance managementAboul Ella Hassanien
 
Using Bibliometrics in the Library
Using Bibliometrics in the LibraryUsing Bibliometrics in the Library
Using Bibliometrics in the LibraryState Of Innovation
 
Research metrics Apr2013
Research metrics Apr2013Research metrics Apr2013
Research metrics Apr2013Naz Torabi
 
Bibliometrics and its application
Bibliometrics and its applicationBibliometrics and its application
Bibliometrics and its applicationsaurabh kaushik
 
The academic impact of research: Current and the future citation trends in de...
The academic impact of research: Current and the future citation trends in de...The academic impact of research: Current and the future citation trends in de...
The academic impact of research: Current and the future citation trends in de...Nader Ale Ebrahim
 
Effectively Applying Usage Statistics in E-Resource Collection Development
Effectively Applying Usage Statistics in E-Resource Collection DevelopmentEffectively Applying Usage Statistics in E-Resource Collection Development
Effectively Applying Usage Statistics in E-Resource Collection Developmentralowe
 
Texas STaR Chart
Texas STaR ChartTexas STaR Chart
Texas STaR Chartjkcummings
 

What's hot (19)

Bibliometric Tools
Bibliometric ToolsBibliometric Tools
Bibliometric Tools
 
Journal and author impact measures Assessing your impact (h-index and beyond)
Journal and author impact measures Assessing your impact (h-index and beyond)Journal and author impact measures Assessing your impact (h-index and beyond)
Journal and author impact measures Assessing your impact (h-index and beyond)
 
Co word analysis
Co word analysisCo word analysis
Co word analysis
 
Finding Journal Impact Factor using Journal Citation Reports
Finding Journal Impact Factor using Journal Citation Reports Finding Journal Impact Factor using Journal Citation Reports
Finding Journal Impact Factor using Journal Citation Reports
 
Journal Impact Factors and Citation Analysis
Journal Impact Factors and Citation AnalysisJournal Impact Factors and Citation Analysis
Journal Impact Factors and Citation Analysis
 
Researcher profiles and metrics that matter
Researcher profiles and metrics that matterResearcher profiles and metrics that matter
Researcher profiles and metrics that matter
 
Journal ranking metrices new perspective in journal performance management
Journal ranking metrices   new perspective in journal performance managementJournal ranking metrices   new perspective in journal performance management
Journal ranking metrices new perspective in journal performance management
 
Bibliometrics in the library
Bibliometrics in the libraryBibliometrics in the library
Bibliometrics in the library
 
Journal ranking metrices new perspective in journal performance management
Journal ranking metrices   new perspective in journal performance managementJournal ranking metrices   new perspective in journal performance management
Journal ranking metrices new perspective in journal performance management
 
Using Bibliometrics in the Library
Using Bibliometrics in the LibraryUsing Bibliometrics in the Library
Using Bibliometrics in the Library
 
Research metrics Apr2013
Research metrics Apr2013Research metrics Apr2013
Research metrics Apr2013
 
Bibliometrics and its application
Bibliometrics and its applicationBibliometrics and its application
Bibliometrics and its application
 
Understanding the Basics of Journal Metrics
Understanding the Basics of Journal MetricsUnderstanding the Basics of Journal Metrics
Understanding the Basics of Journal Metrics
 
The impact factor and other measures of journal prestige
The impact factor and other measures of journal prestigeThe impact factor and other measures of journal prestige
The impact factor and other measures of journal prestige
 
Harper Analytics Beyond Usage Numbers
Harper Analytics Beyond Usage NumbersHarper Analytics Beyond Usage Numbers
Harper Analytics Beyond Usage Numbers
 
The academic impact of research: Current and the future citation trends in de...
The academic impact of research: Current and the future citation trends in de...The academic impact of research: Current and the future citation trends in de...
The academic impact of research: Current and the future citation trends in de...
 
Effectively Applying Usage Statistics in E-Resource Collection Development
Effectively Applying Usage Statistics in E-Resource Collection DevelopmentEffectively Applying Usage Statistics in E-Resource Collection Development
Effectively Applying Usage Statistics in E-Resource Collection Development
 
Citation metrics
Citation metricsCitation metrics
Citation metrics
 
Texas STaR Chart
Texas STaR ChartTexas STaR Chart
Texas STaR Chart
 

Similar to assia2019

Measuring Open Data Portal User-Orientation: A Computational Approach
Measuring Open Data Portal User-Orientation: A Computational ApproachMeasuring Open Data Portal User-Orientation: A Computational Approach
Measuring Open Data Portal User-Orientation: A Computational ApproachMark Dix
 
Visual Atlas Analysis of Distance Measurement Research Literature Based on Ci...
Visual Atlas Analysis of Distance Measurement Research Literature Based on Ci...Visual Atlas Analysis of Distance Measurement Research Literature Based on Ci...
Visual Atlas Analysis of Distance Measurement Research Literature Based on Ci...Scientific Review SR
 
Assessment Of Chemical Engineering Research Output
Assessment Of Chemical Engineering Research OutputAssessment Of Chemical Engineering Research Output
Assessment Of Chemical Engineering Research OutputJim Jimenez
 
Running Head DESCRIPTIVE STATISTICS COMPUTING .docx
Running Head DESCRIPTIVE STATISTICS COMPUTING                    .docxRunning Head DESCRIPTIVE STATISTICS COMPUTING                    .docx
Running Head DESCRIPTIVE STATISTICS COMPUTING .docxtodd271
 
From act-to-impact-katherine
From act-to-impact-katherineFrom act-to-impact-katherine
From act-to-impact-katherineEducopia
 
Review of literature
Review of literature Review of literature
Review of literature Anju George
 
Research design decisions and be competent in the process of reliable data co...
Research design decisions and be competent in the process of reliable data co...Research design decisions and be competent in the process of reliable data co...
Research design decisions and be competent in the process of reliable data co...Stats Statswork
 
Aligning Learning Analytics with Classroom Practices & Needs
Aligning Learning Analytics with Classroom Practices & NeedsAligning Learning Analytics with Classroom Practices & Needs
Aligning Learning Analytics with Classroom Practices & NeedsSimon Knight
 
Data Science and What It Means to Library and Information Science
Data Science and What It Means to Library and Information ScienceData Science and What It Means to Library and Information Science
Data Science and What It Means to Library and Information ScienceJian Qin
 
The value of data curation as part of the publishing process
The value of data curation as part of the publishing processThe value of data curation as part of the publishing process
The value of data curation as part of the publishing processVarsha Khodiyar
 
HowtoWriteaBibliometricpaperByNaderAleEbrahim.pdf
HowtoWriteaBibliometricpaperByNaderAleEbrahim.pdfHowtoWriteaBibliometricpaperByNaderAleEbrahim.pdf
HowtoWriteaBibliometricpaperByNaderAleEbrahim.pdfMr Garg
 
A sample study on applying data mining research techniques in educational sci...
A sample study on applying data mining research techniques in educational sci...A sample study on applying data mining research techniques in educational sci...
A sample study on applying data mining research techniques in educational sci...Wendy Hager
 
20200319_Recent trends of social science data in Japan
20200319_Recent trends of social science data in Japan20200319_Recent trends of social science data in Japan
20200319_Recent trends of social science data in JapanYasuyuki Minamiyama
 
MBA 5652Unit ILiterature ReviewInstructionsWithin this cou.docx
MBA 5652Unit ILiterature ReviewInstructionsWithin this cou.docxMBA 5652Unit ILiterature ReviewInstructionsWithin this cou.docx
MBA 5652Unit ILiterature ReviewInstructionsWithin this cou.docxalfredacavx97
 
Sociology and anthropology briefings (C-SAP collections project)
Sociology and anthropology briefings (C-SAP collections project)Sociology and anthropology briefings (C-SAP collections project)
Sociology and anthropology briefings (C-SAP collections project)CSAPSubjectCentre
 
Puce cutting eeg_paris2018
Puce cutting eeg_paris2018Puce cutting eeg_paris2018
Puce cutting eeg_paris2018Aina Puce
 
Teaching Data Analysis using SPSS
Teaching Data Analysis using SPSSTeaching Data Analysis using SPSS
Teaching Data Analysis using SPSSijtsrd
 
WritingUpResearchAStatisticalPerspective
WritingUpResearchAStatisticalPerspectiveWritingUpResearchAStatisticalPerspective
WritingUpResearchAStatisticalPerspectivemehedi hasan
 

Similar to assia2019 (20)

Measuring Open Data Portal User-Orientation: A Computational Approach
Measuring Open Data Portal User-Orientation: A Computational ApproachMeasuring Open Data Portal User-Orientation: A Computational Approach
Measuring Open Data Portal User-Orientation: A Computational Approach
 
Visual Atlas Analysis of Distance Measurement Research Literature Based on Ci...
Visual Atlas Analysis of Distance Measurement Research Literature Based on Ci...Visual Atlas Analysis of Distance Measurement Research Literature Based on Ci...
Visual Atlas Analysis of Distance Measurement Research Literature Based on Ci...
 
Assessment Of Chemical Engineering Research Output
Assessment Of Chemical Engineering Research OutputAssessment Of Chemical Engineering Research Output
Assessment Of Chemical Engineering Research Output
 
Running Head DESCRIPTIVE STATISTICS COMPUTING .docx
Running Head DESCRIPTIVE STATISTICS COMPUTING                    .docxRunning Head DESCRIPTIVE STATISTICS COMPUTING                    .docx
Running Head DESCRIPTIVE STATISTICS COMPUTING .docx
 
From act-to-impact-katherine
From act-to-impact-katherineFrom act-to-impact-katherine
From act-to-impact-katherine
 
Review of literature
Review of literature Review of literature
Review of literature
 
Research design decisions and be competent in the process of reliable data co...
Research design decisions and be competent in the process of reliable data co...Research design decisions and be competent in the process of reliable data co...
Research design decisions and be competent in the process of reliable data co...
 
Aligning Learning Analytics with Classroom Practices & Needs
Aligning Learning Analytics with Classroom Practices & NeedsAligning Learning Analytics with Classroom Practices & Needs
Aligning Learning Analytics with Classroom Practices & Needs
 
Dsir2019(nishiyama)
Dsir2019(nishiyama)Dsir2019(nishiyama)
Dsir2019(nishiyama)
 
Data Science and What It Means to Library and Information Science
Data Science and What It Means to Library and Information ScienceData Science and What It Means to Library and Information Science
Data Science and What It Means to Library and Information Science
 
The value of data curation as part of the publishing process
The value of data curation as part of the publishing processThe value of data curation as part of the publishing process
The value of data curation as part of the publishing process
 
research-library.pptx
research-library.pptxresearch-library.pptx
research-library.pptx
 
HowtoWriteaBibliometricpaperByNaderAleEbrahim.pdf
HowtoWriteaBibliometricpaperByNaderAleEbrahim.pdfHowtoWriteaBibliometricpaperByNaderAleEbrahim.pdf
HowtoWriteaBibliometricpaperByNaderAleEbrahim.pdf
 
A sample study on applying data mining research techniques in educational sci...
A sample study on applying data mining research techniques in educational sci...A sample study on applying data mining research techniques in educational sci...
A sample study on applying data mining research techniques in educational sci...
 
20200319_Recent trends of social science data in Japan
20200319_Recent trends of social science data in Japan20200319_Recent trends of social science data in Japan
20200319_Recent trends of social science data in Japan
 
MBA 5652Unit ILiterature ReviewInstructionsWithin this cou.docx
MBA 5652Unit ILiterature ReviewInstructionsWithin this cou.docxMBA 5652Unit ILiterature ReviewInstructionsWithin this cou.docx
MBA 5652Unit ILiterature ReviewInstructionsWithin this cou.docx
 
Sociology and anthropology briefings (C-SAP collections project)
Sociology and anthropology briefings (C-SAP collections project)Sociology and anthropology briefings (C-SAP collections project)
Sociology and anthropology briefings (C-SAP collections project)
 
Puce cutting eeg_paris2018
Puce cutting eeg_paris2018Puce cutting eeg_paris2018
Puce cutting eeg_paris2018
 
Teaching Data Analysis using SPSS
Teaching Data Analysis using SPSSTeaching Data Analysis using SPSS
Teaching Data Analysis using SPSS
 
WritingUpResearchAStatisticalPerspective
WritingUpResearchAStatisticalPerspectiveWritingUpResearchAStatisticalPerspective
WritingUpResearchAStatisticalPerspective
 

More from Tetsuya Sakai (20)

NTCIR15WWW3overview
NTCIR15WWW3overviewNTCIR15WWW3overview
NTCIR15WWW3overview
 
sigir2020
sigir2020sigir2020
sigir2020
 
ipsjifat201909
ipsjifat201909ipsjifat201909
ipsjifat201909
 
sigir2019
sigir2019sigir2019
sigir2019
 
ntcir14centre-overview
ntcir14centre-overviewntcir14centre-overview
ntcir14centre-overview
 
evia2019
evia2019evia2019
evia2019
 
ecir2019tutorial-finalised
ecir2019tutorial-finalisedecir2019tutorial-finalised
ecir2019tutorial-finalised
 
ecir2019tutorial
ecir2019tutorialecir2019tutorial
ecir2019tutorial
 
WSDM2019tutorial
WSDM2019tutorialWSDM2019tutorial
WSDM2019tutorial
 
sigir2018tutorial
sigir2018tutorialsigir2018tutorial
sigir2018tutorial
 
Evia2017unanimity
Evia2017unanimityEvia2017unanimity
Evia2017unanimity
 
Evia2017assessors
Evia2017assessorsEvia2017assessors
Evia2017assessors
 
Evia2017dialogues
Evia2017dialoguesEvia2017dialogues
Evia2017dialogues
 
Evia2017wcw
Evia2017wcwEvia2017wcw
Evia2017wcw
 
sigir2017bayesian
sigir2017bayesiansigir2017bayesian
sigir2017bayesian
 
NL20161222invited
NL20161222invitedNL20161222invited
NL20161222invited
 
AIRS2016
AIRS2016AIRS2016
AIRS2016
 
Nl201609
Nl201609Nl201609
Nl201609
 
ictir2016
ictir2016ictir2016
ictir2016
 
ICTIR2016tutorial
ICTIR2016tutorialICTIR2016tutorial
ICTIR2016tutorial
 

Recently uploaded

Connect Wave/ connectwave Pitch Deck Presentation
Connect Wave/ connectwave Pitch Deck PresentationConnect Wave/ connectwave Pitch Deck Presentation
Connect Wave/ connectwave Pitch Deck PresentationSlibray Presentation
 
Transcript: #StandardsGoals for 2024: What’s new for BISAC - Tech Forum 2024
Transcript: #StandardsGoals for 2024: What’s new for BISAC - Tech Forum 2024Transcript: #StandardsGoals for 2024: What’s new for BISAC - Tech Forum 2024
Transcript: #StandardsGoals for 2024: What’s new for BISAC - Tech Forum 2024BookNet Canada
 
Build your next Gen AI Breakthrough - April 2024
Build your next Gen AI Breakthrough - April 2024Build your next Gen AI Breakthrough - April 2024
Build your next Gen AI Breakthrough - April 2024Neo4j
 
Pigging Solutions in Pet Food Manufacturing
Pigging Solutions in Pet Food ManufacturingPigging Solutions in Pet Food Manufacturing
Pigging Solutions in Pet Food ManufacturingPigging Solutions
 
Advanced Test Driven-Development @ php[tek] 2024
Advanced Test Driven-Development @ php[tek] 2024Advanced Test Driven-Development @ php[tek] 2024
Advanced Test Driven-Development @ php[tek] 2024Scott Keck-Warren
 
Making_way_through_DLL_hollowing_inspite_of_CFG_by_Debjeet Banerjee.pptx
Making_way_through_DLL_hollowing_inspite_of_CFG_by_Debjeet Banerjee.pptxMaking_way_through_DLL_hollowing_inspite_of_CFG_by_Debjeet Banerjee.pptx
Making_way_through_DLL_hollowing_inspite_of_CFG_by_Debjeet Banerjee.pptxnull - The Open Security Community
 
Transcript: New from BookNet Canada for 2024: BNC BiblioShare - Tech Forum 2024
Transcript: New from BookNet Canada for 2024: BNC BiblioShare - Tech Forum 2024Transcript: New from BookNet Canada for 2024: BNC BiblioShare - Tech Forum 2024
Transcript: New from BookNet Canada for 2024: BNC BiblioShare - Tech Forum 2024BookNet Canada
 
Understanding the Laravel MVC Architecture
Understanding the Laravel MVC ArchitectureUnderstanding the Laravel MVC Architecture
Understanding the Laravel MVC ArchitecturePixlogix Infotech
 
"LLMs for Python Engineers: Advanced Data Analysis and Semantic Kernel",Oleks...
"LLMs for Python Engineers: Advanced Data Analysis and Semantic Kernel",Oleks..."LLMs for Python Engineers: Advanced Data Analysis and Semantic Kernel",Oleks...
"LLMs for Python Engineers: Advanced Data Analysis and Semantic Kernel",Oleks...Fwdays
 
Key Features Of Token Development (1).pptx
Key  Features Of Token  Development (1).pptxKey  Features Of Token  Development (1).pptx
Key Features Of Token Development (1).pptxLBM Solutions
 
AI as an Interface for Commercial Buildings
AI as an Interface for Commercial BuildingsAI as an Interface for Commercial Buildings
AI as an Interface for Commercial BuildingsMemoori
 
Unblocking The Main Thread Solving ANRs and Frozen Frames
Unblocking The Main Thread Solving ANRs and Frozen FramesUnblocking The Main Thread Solving ANRs and Frozen Frames
Unblocking The Main Thread Solving ANRs and Frozen FramesSinan KOZAK
 
Unlocking the Potential of the Cloud for IBM Power Systems
Unlocking the Potential of the Cloud for IBM Power SystemsUnlocking the Potential of the Cloud for IBM Power Systems
Unlocking the Potential of the Cloud for IBM Power SystemsPrecisely
 
Human Factors of XR: Using Human Factors to Design XR Systems
Human Factors of XR: Using Human Factors to Design XR SystemsHuman Factors of XR: Using Human Factors to Design XR Systems
Human Factors of XR: Using Human Factors to Design XR SystemsMark Billinghurst
 
Swan(sea) Song – personal research during my six years at Swansea ... and bey...
Swan(sea) Song – personal research during my six years at Swansea ... and bey...Swan(sea) Song – personal research during my six years at Swansea ... and bey...
Swan(sea) Song – personal research during my six years at Swansea ... and bey...Alan Dix
 
Snow Chain-Integrated Tire for a Safe Drive on Winter Roads
Snow Chain-Integrated Tire for a Safe Drive on Winter RoadsSnow Chain-Integrated Tire for a Safe Drive on Winter Roads
Snow Chain-Integrated Tire for a Safe Drive on Winter RoadsHyundai Motor Group
 
SQL Database Design For Developers at php[tek] 2024
SQL Database Design For Developers at php[tek] 2024SQL Database Design For Developers at php[tek] 2024
SQL Database Design For Developers at php[tek] 2024Scott Keck-Warren
 
Tech-Forward - Achieving Business Readiness For Copilot in Microsoft 365
Tech-Forward - Achieving Business Readiness For Copilot in Microsoft 365Tech-Forward - Achieving Business Readiness For Copilot in Microsoft 365
Tech-Forward - Achieving Business Readiness For Copilot in Microsoft 3652toLead Limited
 
#StandardsGoals for 2024: What’s new for BISAC - Tech Forum 2024
#StandardsGoals for 2024: What’s new for BISAC - Tech Forum 2024#StandardsGoals for 2024: What’s new for BISAC - Tech Forum 2024
#StandardsGoals for 2024: What’s new for BISAC - Tech Forum 2024BookNet Canada
 

Recently uploaded (20)

Connect Wave/ connectwave Pitch Deck Presentation
Connect Wave/ connectwave Pitch Deck PresentationConnect Wave/ connectwave Pitch Deck Presentation
Connect Wave/ connectwave Pitch Deck Presentation
 
Transcript: #StandardsGoals for 2024: What’s new for BISAC - Tech Forum 2024
Transcript: #StandardsGoals for 2024: What’s new for BISAC - Tech Forum 2024Transcript: #StandardsGoals for 2024: What’s new for BISAC - Tech Forum 2024
Transcript: #StandardsGoals for 2024: What’s new for BISAC - Tech Forum 2024
 
E-Vehicle_Hacking_by_Parul Sharma_null_owasp.pptx
E-Vehicle_Hacking_by_Parul Sharma_null_owasp.pptxE-Vehicle_Hacking_by_Parul Sharma_null_owasp.pptx
E-Vehicle_Hacking_by_Parul Sharma_null_owasp.pptx
 
Build your next Gen AI Breakthrough - April 2024
Build your next Gen AI Breakthrough - April 2024Build your next Gen AI Breakthrough - April 2024
Build your next Gen AI Breakthrough - April 2024
 
Pigging Solutions in Pet Food Manufacturing
Pigging Solutions in Pet Food ManufacturingPigging Solutions in Pet Food Manufacturing
Pigging Solutions in Pet Food Manufacturing
 
Advanced Test Driven-Development @ php[tek] 2024
Advanced Test Driven-Development @ php[tek] 2024Advanced Test Driven-Development @ php[tek] 2024
Advanced Test Driven-Development @ php[tek] 2024
 
Making_way_through_DLL_hollowing_inspite_of_CFG_by_Debjeet Banerjee.pptx
Making_way_through_DLL_hollowing_inspite_of_CFG_by_Debjeet Banerjee.pptxMaking_way_through_DLL_hollowing_inspite_of_CFG_by_Debjeet Banerjee.pptx
Making_way_through_DLL_hollowing_inspite_of_CFG_by_Debjeet Banerjee.pptx
 
Transcript: New from BookNet Canada for 2024: BNC BiblioShare - Tech Forum 2024
Transcript: New from BookNet Canada for 2024: BNC BiblioShare - Tech Forum 2024Transcript: New from BookNet Canada for 2024: BNC BiblioShare - Tech Forum 2024
Transcript: New from BookNet Canada for 2024: BNC BiblioShare - Tech Forum 2024
 
Understanding the Laravel MVC Architecture
Understanding the Laravel MVC ArchitectureUnderstanding the Laravel MVC Architecture
Understanding the Laravel MVC Architecture
 
"LLMs for Python Engineers: Advanced Data Analysis and Semantic Kernel",Oleks...
"LLMs for Python Engineers: Advanced Data Analysis and Semantic Kernel",Oleks..."LLMs for Python Engineers: Advanced Data Analysis and Semantic Kernel",Oleks...
"LLMs for Python Engineers: Advanced Data Analysis and Semantic Kernel",Oleks...
 
Key Features Of Token Development (1).pptx
Key  Features Of Token  Development (1).pptxKey  Features Of Token  Development (1).pptx
Key Features Of Token Development (1).pptx
 
AI as an Interface for Commercial Buildings
AI as an Interface for Commercial BuildingsAI as an Interface for Commercial Buildings
AI as an Interface for Commercial Buildings
 
Unblocking The Main Thread Solving ANRs and Frozen Frames
Unblocking The Main Thread Solving ANRs and Frozen FramesUnblocking The Main Thread Solving ANRs and Frozen Frames
Unblocking The Main Thread Solving ANRs and Frozen Frames
 
Unlocking the Potential of the Cloud for IBM Power Systems
Unlocking the Potential of the Cloud for IBM Power SystemsUnlocking the Potential of the Cloud for IBM Power Systems
Unlocking the Potential of the Cloud for IBM Power Systems
 
Human Factors of XR: Using Human Factors to Design XR Systems
Human Factors of XR: Using Human Factors to Design XR SystemsHuman Factors of XR: Using Human Factors to Design XR Systems
Human Factors of XR: Using Human Factors to Design XR Systems
 
Swan(sea) Song – personal research during my six years at Swansea ... and bey...
Swan(sea) Song – personal research during my six years at Swansea ... and bey...Swan(sea) Song – personal research during my six years at Swansea ... and bey...
Swan(sea) Song – personal research during my six years at Swansea ... and bey...
 
Snow Chain-Integrated Tire for a Safe Drive on Winter Roads
Snow Chain-Integrated Tire for a Safe Drive on Winter RoadsSnow Chain-Integrated Tire for a Safe Drive on Winter Roads
Snow Chain-Integrated Tire for a Safe Drive on Winter Roads
 
SQL Database Design For Developers at php[tek] 2024
SQL Database Design For Developers at php[tek] 2024SQL Database Design For Developers at php[tek] 2024
SQL Database Design For Developers at php[tek] 2024
 
Tech-Forward - Achieving Business Readiness For Copilot in Microsoft 365
Tech-Forward - Achieving Business Readiness For Copilot in Microsoft 365Tech-Forward - Achieving Business Readiness For Copilot in Microsoft 365
Tech-Forward - Achieving Business Readiness For Copilot in Microsoft 365
 
#StandardsGoals for 2024: What’s new for BISAC - Tech Forum 2024
#StandardsGoals for 2024: What’s new for BISAC - Tech Forum 2024#StandardsGoals for 2024: What’s new for BISAC - Tech Forum 2024
#StandardsGoals for 2024: What’s new for BISAC - Tech Forum 2024
 

assia2019