SlideShare a Scribd company logo
1 of 49
Download to read offline
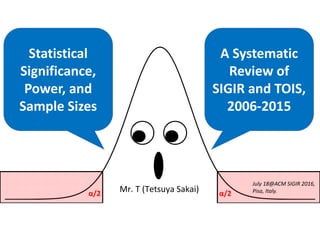
Mr. T (Tetsuya Sakai)
Statistical 
Significance, 
Power, and 
Sample Sizes
A Systematic 
Review of 
SIGIR and TOIS, 
2006‐2015
July 18@ACM SIGIR 2016,
Pisa, Italy.
α/2 α/2
TALK OUTLINE
•Motivation
•Survey Method
•Results
•Summary
•Data and Feedback
Preliminaries (1)
• In IR experiments, we often compare sample means to 
guess if the population means are different.
• We often employ parametric tests (assume specific 
population distributions and guess their parameters)
‐ paired and unpaired t‐tests (comparing m=2 means)
‐ ANOVA (comparing m (>2) means)
one‐way, two‐way, two‐way without replication
Are the two population 
means equal?
Are the m population 
means equal?
scores
EXAMPLE
n topics
m systems
Sample mean for a system
Preliminaries (2)
• H0: tentative assumption that all population means are equal
• test statistic: what you compute from observed data – under H0, this 
should obey a known distribution (e.g. t‐distribution)
• p‐value: probability of observing what you have observed (or 
something more extreme) assuming H0 is true
Null hypothesis
test statistic t0
Preliminaries (3)
Reject H0
if p‐value <= α
test statistic t0 t(φ; α)
Accept H0 Reject H0
H0 is true
systems are equivalent
Correct conclusion
(1‐α)
Type I error
α
H0 is false
systems are different
Type II error
β
Correct conclusion
(1‐β)
α/2 α/2
Statistical power: 
ability to detect real 
differences
Cohen’s five‐eighty convention:
α=5%, 1‐β=80%
Bad practices
• Reporting α but not the p‐value (dichotomous thinking)
“Significant at α=0.05” but p‐value=0.05? 0.000001?
• Reporting the p‐value but not the effect size
“p‐value=0.01” but does this reflect a large effect size
or just a large sample size (n)?
p‐value = f( sample_size, effect_size )
large effect size ⇒ small p‐value
large sample size ⇒ small p‐value
magnitude of the 
actual difference 
Anything can be made statistically significant by using lots of data
Statistical Reform in Information Retrieval?
http://sigir.org/files/forum/2014J/2014J_sigirforum_Article_TetsuyaSakai.pdf
http://tois.acm.org/authors.cfm
Do people actually follow these instructions? What about SIGIR?
Doubts
• Some IR experiments are extremely overpowered –
everything is statistically significant due to large data (e.g. 
search engine logs), no matter how small the effect is. Okay 
if the effect size is properly reported and if the small effect 
size translates to a large profit for companies.
• Some IR experiments are extremely underpowered – missing 
real differences due to lack of observations (e.g. a small user 
group). Maybe better experimental designs are in order.
n much larger than necessary
n much smaller than necessary
TALK OUTLINE
•Motivation
•Survey Method
•Results
•Summary
•Data and Feedback
sleeping
30%
email
15%
teaching
10%
supervising
10%
meetings
10%
eating/drinking
10%
twitter/commuting
8%
movies
5%
research
2%
AN AVERAGE WEEKDAY OF 
AN AVERAGE JAPANESE PROFESSOR
Papers examined (Feb‐Oct 2015)
Coding scheme STEP 1
Does it contain a table/figure of means that 
probably deserves significance testing?
If YES, record one such table/figure 
(representative table).
Coding scheme STEP 2
Does it conduct a 
significance test?
Categorise according to the 
primary test used
(one test type per paper).
pdf searched with Ctrl+F
“statistical” “signi” “test” “ANOVA”
Coding scheme STEP 3
Does it claim “significance”? 
Record the exact expressions 
used.
Coding scheme STEP 4
Record whether p‐
values/test statistics 
are reported.
If only the p‐value is 
reported, deduce test 
statistic wherever 
possible
Coding scheme STEP 5
If test statistic + sample size 
are available, conduct power 
analysis with R tools
133 papers
Coding scheme: Additional classification
Tests for comparing 
two systems
Significance test categorisation scheme
Covered by my power analysis tools
Tests for comparing two systems
R power analysis tools
(based on the library pwr)
• future.sample.unpairedt
• future.sample.pairedt
• future.sample.1wayanova
• future.sample.2waynorep
• future.sample.2wayanova
R code from this 
book by Prof Toyoda
modified by Sakai
INPUT: sample size, test statistic, 
degrees of freedom
OUTPUT: effect size, achieved power,
future sample size
TALK OUTLINE
•Motivation
•Survey Method
•Results
•Summary
•Data and Feedback
Coding scheme STEP 2
Does it conduct a 
significance test?
Categorise according to the 
primary test used
(one test type per paper).
pdf searched with Ctrl+F
“statistical” “signi” “test” “ANOVA”
862 papers with a representative table: 
distribution over significance test types
• 35‐37% use the paired t‐test.
• 28‐30% do not report significance test results although they have a representative table.
• 18‐24% use tests other than t‐tests and ANOVA.
862 papers with a representative table: 
significance test types over a decade
Two proportions z‐test (proportion2006 minus proportion2015): in both figures,
• the proportion of “no significance test” papers in 2015 is significantly lower than 2006
95%CI: [0.023, 0.353] (SIGIR) and [0.031, 0.329] (SIGIR+TOIS)
• the proportion of “paired t‐test” papers in 2015 is significantly higher than 2006
95%CI: [‐0.357, ‐0.044] (SIGIR) and [‐0.361, ‐0.074] (SIGIR+TOIS)
Coding scheme STEP 3
Does it claim “significance”? 
Record the exact expressions 
used.
167/862=19% of papers claim “significance” 
without reporting on significance test results
• “significant improvement” “significantly outperform” even in 
abstracts and conclusions
• Highly misleading! Come on, we’re better than this!
IF you actually did a significance test THEN
say “statistically significant” “statistical significance”
ELSE
avoid saying “significant” “significance”
Coding scheme: Additional classification
Tests for comparing 
two systems
464 papers with a test for comparing two 
systems
• 61‐66% use the paired t‐test
• 20‐23% use the Wilcoxon signed rank test
• 4‐5% use the randomisation test
• 3‐4% use the sign test
464 papers with a test for comparing two 
systems: across a decade
Two proportions z‐test (proportion2006 minus proportion2015): in both figures,
• the proportion of “Wilcoxon signed rank test” papers in 2015 is significantly lower than 2006
95%CI: [0.065, 0.513] (SIGIR) and [0.073, 0.468] (SIGIR+TOIS)
• the proportion of “paired t‐test” papers in 2015 is significantly higher than 2006
95%CI: [‐0.530, ‐0.048] (SIGIR) and [‐0.489, ‐0.057] (SIGIR+TOIS)
Coding scheme STEP 4
Record whether p‐
values/test statistics 
are reported.
565 papers
If only the p‐value is 
reported, deduce test 
statistic wherever 
possible
Do IR researchers report p‐values and/or test 
statistics?
365/565= 65% report neither p‐values nor test statistics. 
Situation not improving.. 
(“neither reported” highest in 2013)
SIGIR 2013 PC chairs: 
133 for power 
analysis (67 used 
nonparametric tests 
etc.)
Coding scheme STEP 5
If test statistic + sample size 
are available, conduct power 
analysis with R tools
133 papers
133 papers that went through power analysis
overpowered
(power >=0.99)
underpowered
(power <=0.50)
about right
(0.50 < power < 0.99)
Unpaired t‐test 3 1 12
Paired t‐test 23 6 61
One‐way ANOVA 8 1 7
Two‐way ANOVA w/o 
replication
2 1 4
Two‐way ANOVA 2 0 2
TOTAL 38 9 86
Yes, the thresholds are arbitrary, but you can do your own analysis using my raw Excel file.
Sample size ratio = actual size/future size:
paired/unpaired t‐test (1)
Sample size ratio = actual size/future size:
paired/unpaired t‐test (2)
A paper on personalisation from a search engine company (paired t‐test)
t=16.00, n=5,352,460, effect size=0.007, achieved power=1
recommended future sample size=164,107
Effect size very small (though this may translate into substantial profit for a 
company)
Sample size ratio = actual size/future size:
paired/unpaired t‐test (3)
User experiments, paired t‐test
t=0.95, n=28,
effect size=0.180,
achieved power=0.152
future sample size=244
(similar results for other t‐test 
results in the same paper)
Sample size ratio = actual size/future size:
ANOVA (1)
Sample size ratio = actual size/future size:
ANOVA (2)
Experiments with a commercial social media 
application data (one‐way ANOVA)
F=243.42, #levels=3, 
sample size per group=2551,
effect size fhat=2.252, achieved power=1,
recommended future sample size per group=52
Sample size ratio = actual size/future size:
ANOVA (3) User experiments, two‐way 
ANOVA w/o replication
F=0.63, #levels=4, 
sample size per group=17,
effect size fhat^2 = 0.039,
achieved power=0.183,
recommended future sample 
size per group=75
(similar results for other 
ANOVA results in the same 
paper)
TALK OUTLINE
•Motivation
•Survey Method
•Results
•Summary
•Data and Feedback
Main findings (1)
• Of the 862 papers that seem to deserve significance testing, 
301 (35%) use the paired t‐test; 255 (30%) lack significance 
testing, of which 167 (19%) claim “significance.”
• Of the 464 papers that discuss significance for comparing 
two systems, 301 (65%) use the paired t‐test; 97 (21%) use 
the Wilcoxon signed rank test. 
Main findings (2)
• Compared to a decade ago, we are seeing more t‐tests, 
fewer Wilcoxon signed rank tests and fewer papers that lack 
significance testing. 
[Improvements statistically significant according to two‐
proportions z‐tests]
• Of the 565 papers that reported on significance test results, 
65% reported neither p‐values nor test statistics. 
[Not improving...]
Main findings (3)
38/133=29% highly overpowered
(e.g. search engine companies)
9/133=7% highly underpowered
(e.g. small user studies)
Recommendations
• Report effect sizes etc., not just p‐values. Especially 
important for overpowered experiments because a low p‐
value may just reflect the large sample size.
• Small‐scale user studies: learn about effect sizes and sample 
sizes from previous work for well‐designed experiments.
• Better reporting practices = collective knowledge and 
progress.
TALK OUTLINE
•Motivation
•Survey Method
•Results
•Summary
•Data and Feedback
Raw systematic review file: 
http://www.f.waseda.jp/tetsuya/data.html
• Raw Excel file containing 
systematic review results
• Simple R code for power 
calculation
Feedback for the systematic review file:
https://twitter.com/IRsysrev
Thank you,
See you at

More Related Content

What's hot

Commonly Used Statistics in Survey Research
Commonly Used Statistics in Survey ResearchCommonly Used Statistics in Survey Research
Commonly Used Statistics in Survey ResearchPat Barlow
 
Inferential Statistics: Chi Square (X2) - DAY 6 - B.ED - 8614 - AIOU
Inferential Statistics: Chi Square (X2) - DAY 6 - B.ED - 8614 - AIOUInferential Statistics: Chi Square (X2) - DAY 6 - B.ED - 8614 - AIOU
Inferential Statistics: Chi Square (X2) - DAY 6 - B.ED - 8614 - AIOUEqraBaig
 
Presentation1group b
Presentation1group bPresentation1group b
Presentation1group bAbhishekDas15
 
Choosing the Right Statistical Techniques
Choosing the Right Statistical TechniquesChoosing the Right Statistical Techniques
Choosing the Right Statistical TechniquesBodhiya Wijaya Mulya
 
Statistical analysis using spss
Statistical analysis using spssStatistical analysis using spss
Statistical analysis using spssjpcagphil
 
Statistical Analysis Overview
Statistical Analysis OverviewStatistical Analysis Overview
Statistical Analysis OverviewEcumene
 
Quantitative analysis using SPSS
Quantitative analysis using SPSSQuantitative analysis using SPSS
Quantitative analysis using SPSSAlaa Sadik
 
Descriptive Statistics
Descriptive StatisticsDescriptive Statistics
Descriptive Statisticsguest290abe
 
INFERENTIAL STATISTICS: AN INTRODUCTION
INFERENTIAL STATISTICS: AN INTRODUCTIONINFERENTIAL STATISTICS: AN INTRODUCTION
INFERENTIAL STATISTICS: AN INTRODUCTIONJohn Labrador
 
Univariate, bivariate analysis, hypothesis testing, chi square
Univariate, bivariate analysis, hypothesis testing, chi squareUnivariate, bivariate analysis, hypothesis testing, chi square
Univariate, bivariate analysis, hypothesis testing, chi squarekongara
 

What's hot (20)

Statistics
StatisticsStatistics
Statistics
 
Commonly Used Statistics in Survey Research
Commonly Used Statistics in Survey ResearchCommonly Used Statistics in Survey Research
Commonly Used Statistics in Survey Research
 
STATISTICAL TOOLS IN RESEARCH
STATISTICAL TOOLS IN RESEARCHSTATISTICAL TOOLS IN RESEARCH
STATISTICAL TOOLS IN RESEARCH
 
Inferential Statistics: Chi Square (X2) - DAY 6 - B.ED - 8614 - AIOU
Inferential Statistics: Chi Square (X2) - DAY 6 - B.ED - 8614 - AIOUInferential Statistics: Chi Square (X2) - DAY 6 - B.ED - 8614 - AIOU
Inferential Statistics: Chi Square (X2) - DAY 6 - B.ED - 8614 - AIOU
 
Behavioral Statistics Intro lecture
Behavioral Statistics Intro lectureBehavioral Statistics Intro lecture
Behavioral Statistics Intro lecture
 
Presentation1group b
Presentation1group bPresentation1group b
Presentation1group b
 
Choosing the Right Statistical Techniques
Choosing the Right Statistical TechniquesChoosing the Right Statistical Techniques
Choosing the Right Statistical Techniques
 
Statistical analysis
Statistical  analysisStatistical  analysis
Statistical analysis
 
Choosing the right statistics
Choosing the right statisticsChoosing the right statistics
Choosing the right statistics
 
Inferential statistics
Inferential  statisticsInferential  statistics
Inferential statistics
 
Statistical analysis using spss
Statistical analysis using spssStatistical analysis using spss
Statistical analysis using spss
 
Understanding statistics in research
Understanding statistics in researchUnderstanding statistics in research
Understanding statistics in research
 
Statistical Analysis Overview
Statistical Analysis OverviewStatistical Analysis Overview
Statistical Analysis Overview
 
Quantitative analysis using SPSS
Quantitative analysis using SPSSQuantitative analysis using SPSS
Quantitative analysis using SPSS
 
statistical analysis
statistical analysisstatistical analysis
statistical analysis
 
Psychological Statistics Chapter 1
Psychological Statistics Chapter 1Psychological Statistics Chapter 1
Psychological Statistics Chapter 1
 
Descriptive Statistics
Descriptive StatisticsDescriptive Statistics
Descriptive Statistics
 
INFERENTIAL STATISTICS: AN INTRODUCTION
INFERENTIAL STATISTICS: AN INTRODUCTIONINFERENTIAL STATISTICS: AN INTRODUCTION
INFERENTIAL STATISTICS: AN INTRODUCTION
 
Univariate, bivariate analysis, hypothesis testing, chi square
Univariate, bivariate analysis, hypothesis testing, chi squareUnivariate, bivariate analysis, hypothesis testing, chi square
Univariate, bivariate analysis, hypothesis testing, chi square
 
Advanced statistics
Advanced statisticsAdvanced statistics
Advanced statistics
 

Viewers also liked

How skewness in option prices affected Madoff strategy
How skewness in option prices affected Madoff strategyHow skewness in option prices affected Madoff strategy
How skewness in option prices affected Madoff strategyGaetan Lion
 
Unpaired t Test Family
Unpaired t Test FamilyUnpaired t Test Family
Unpaired t Test FamilyGaetan Lion
 
Experimental design data analysis
Experimental design data analysisExperimental design data analysis
Experimental design data analysismetalkid132
 
Nonparametric hypothesis testing methods
Nonparametric hypothesis testing methodsNonparametric hypothesis testing methods
Nonparametric hypothesis testing methodsGaetan Lion
 
Quantitative method compare means test (independent and paired)
Quantitative method compare means test (independent and paired)Quantitative method compare means test (independent and paired)
Quantitative method compare means test (independent and paired)Keiko Ono
 
Anova and T-Test
Anova and T-TestAnova and T-Test
Anova and T-TestAD Sarwar
 
Parametric tests
Parametric testsParametric tests
Parametric testsheena45
 
HFS3283 paired t tes-t and anova
HFS3283 paired t tes-t and anovaHFS3283 paired t tes-t and anova
HFS3283 paired t tes-t and anovawajihahwafa
 
Null hypothesis for paired sample t-test
Null hypothesis for paired sample t-testNull hypothesis for paired sample t-test
Null hypothesis for paired sample t-testKen Plummer
 
Data and its types by adeel
Data and its types by adeelData and its types by adeel
Data and its types by adeelAyaan Adeel
 
Reporting a paired sample t test
Reporting a paired sample t testReporting a paired sample t test
Reporting a paired sample t testKen Plummer
 
What is a paired samples t test
What is a paired samples t testWhat is a paired samples t test
What is a paired samples t testKen Plummer
 
What is a Wilcoxon Sign-Ranked Test (pair t non para)?
What is a Wilcoxon Sign-Ranked Test (pair t non para)?What is a Wilcoxon Sign-Ranked Test (pair t non para)?
What is a Wilcoxon Sign-Ranked Test (pair t non para)?Ken Plummer
 
Multiple Linear Regression II and ANOVA I
Multiple Linear Regression II and ANOVA IMultiple Linear Regression II and ANOVA I
Multiple Linear Regression II and ANOVA IJames Neill
 
Student's T-test, Paired T-Test, ANOVA & Proportionate Test
Student's T-test, Paired T-Test, ANOVA & Proportionate TestStudent's T-test, Paired T-Test, ANOVA & Proportionate Test
Student's T-test, Paired T-Test, ANOVA & Proportionate TestAzmi Mohd Tamil
 
Dependent T Test
Dependent T TestDependent T Test
Dependent T Testshoffma5
 
T test, independant sample, paired sample and anova
T test, independant sample, paired sample and anovaT test, independant sample, paired sample and anova
T test, independant sample, paired sample and anovaQasim Raza
 

Viewers also liked (20)

How skewness in option prices affected Madoff strategy
How skewness in option prices affected Madoff strategyHow skewness in option prices affected Madoff strategy
How skewness in option prices affected Madoff strategy
 
Unpaired t Test Family
Unpaired t Test FamilyUnpaired t Test Family
Unpaired t Test Family
 
Paired t Test
Paired t TestPaired t Test
Paired t Test
 
Parametric tests
Parametric testsParametric tests
Parametric tests
 
Experimental design data analysis
Experimental design data analysisExperimental design data analysis
Experimental design data analysis
 
Nonparametric hypothesis testing methods
Nonparametric hypothesis testing methodsNonparametric hypothesis testing methods
Nonparametric hypothesis testing methods
 
Quantitative method compare means test (independent and paired)
Quantitative method compare means test (independent and paired)Quantitative method compare means test (independent and paired)
Quantitative method compare means test (independent and paired)
 
Anova and T-Test
Anova and T-TestAnova and T-Test
Anova and T-Test
 
Parametric tests
Parametric testsParametric tests
Parametric tests
 
HFS3283 paired t tes-t and anova
HFS3283 paired t tes-t and anovaHFS3283 paired t tes-t and anova
HFS3283 paired t tes-t and anova
 
Null hypothesis for paired sample t-test
Null hypothesis for paired sample t-testNull hypothesis for paired sample t-test
Null hypothesis for paired sample t-test
 
Data and its types by adeel
Data and its types by adeelData and its types by adeel
Data and its types by adeel
 
Reporting a paired sample t test
Reporting a paired sample t testReporting a paired sample t test
Reporting a paired sample t test
 
What is a paired samples t test
What is a paired samples t testWhat is a paired samples t test
What is a paired samples t test
 
What is a Wilcoxon Sign-Ranked Test (pair t non para)?
What is a Wilcoxon Sign-Ranked Test (pair t non para)?What is a Wilcoxon Sign-Ranked Test (pair t non para)?
What is a Wilcoxon Sign-Ranked Test (pair t non para)?
 
Data types
Data typesData types
Data types
 
Multiple Linear Regression II and ANOVA I
Multiple Linear Regression II and ANOVA IMultiple Linear Regression II and ANOVA I
Multiple Linear Regression II and ANOVA I
 
Student's T-test, Paired T-Test, ANOVA & Proportionate Test
Student's T-test, Paired T-Test, ANOVA & Proportionate TestStudent's T-test, Paired T-Test, ANOVA & Proportionate Test
Student's T-test, Paired T-Test, ANOVA & Proportionate Test
 
Dependent T Test
Dependent T TestDependent T Test
Dependent T Test
 
T test, independant sample, paired sample and anova
T test, independant sample, paired sample and anovaT test, independant sample, paired sample and anova
T test, independant sample, paired sample and anova
 

Similar to SIGIR2016

Statistical analysis and interpretation
Statistical analysis and interpretationStatistical analysis and interpretation
Statistical analysis and interpretationDave Marcial
 
Statistical Analysis in Social Science Researches.pptx
Statistical Analysis in Social Science Researches.pptxStatistical Analysis in Social Science Researches.pptx
Statistical Analysis in Social Science Researches.pptxhishamhanfy
 
ecir2019tutorial-finalised
ecir2019tutorial-finalisedecir2019tutorial-finalised
ecir2019tutorial-finalisedTetsuya Sakai
 
abdi research ppt.pptx
abdi research ppt.pptxabdi research ppt.pptx
abdi research ppt.pptxAbdetaBirhanu
 
Spsshelp 100608163328-phpapp01
Spsshelp 100608163328-phpapp01Spsshelp 100608163328-phpapp01
Spsshelp 100608163328-phpapp01Henock Beyene
 
MELJUN CORTES research lectures_evaluating_data_statistical_treatment
MELJUN CORTES research lectures_evaluating_data_statistical_treatmentMELJUN CORTES research lectures_evaluating_data_statistical_treatment
MELJUN CORTES research lectures_evaluating_data_statistical_treatmentMELJUN CORTES
 
jhghgjhgjhgjhfhcgjfjhvjhjgjkggjhgjhgjhfjgjgfgfhgfhg
jhghgjhgjhgjhfhcgjfjhvjhjgjkggjhgjhgjhfjgjgfgfhgfhgjhghgjhgjhgjhfhcgjfjhvjhjgjkggjhgjhgjhfjgjgfgfhgfhg
jhghgjhgjhgjhfhcgjfjhvjhjgjkggjhgjhgjhfjgjgfgfhgfhgUMAIRASHFAQ20
 
Inferential Statistics.pptx
Inferential Statistics.pptxInferential Statistics.pptx
Inferential Statistics.pptxjonatanjohn1
 
Analysis of data thiyagu
Analysis of data  thiyaguAnalysis of data  thiyagu
Analysis of data thiyaguThiyagu K
 
Analysis of Data - Dr. K. Thiyagu
Analysis of Data - Dr. K. ThiyaguAnalysis of Data - Dr. K. Thiyagu
Analysis of Data - Dr. K. ThiyaguThiyagu K
 
Statistics for Physical Education
Statistics for Physical EducationStatistics for Physical Education
Statistics for Physical EducationParag Shah
 
11720171Chapter 9 Testing the Difference Betwee.docx
11720171Chapter 9 Testing the Difference Betwee.docx11720171Chapter 9 Testing the Difference Betwee.docx
11720171Chapter 9 Testing the Difference Betwee.docxrobert345678
 
Basics of Educational Statistics (T-test)
Basics of Educational Statistics (T-test)Basics of Educational Statistics (T-test)
Basics of Educational Statistics (T-test)HennaAnsari
 

Similar to SIGIR2016 (20)

Statistical analysis and interpretation
Statistical analysis and interpretationStatistical analysis and interpretation
Statistical analysis and interpretation
 
Statistical Analysis in Social Science Researches.pptx
Statistical Analysis in Social Science Researches.pptxStatistical Analysis in Social Science Researches.pptx
Statistical Analysis in Social Science Researches.pptx
 
sigir2018tutorial
sigir2018tutorialsigir2018tutorial
sigir2018tutorial
 
ecir2019tutorial-finalised
ecir2019tutorial-finalisedecir2019tutorial-finalised
ecir2019tutorial-finalised
 
abdi research ppt.pptx
abdi research ppt.pptxabdi research ppt.pptx
abdi research ppt.pptx
 
Spsshelp 100608163328-phpapp01
Spsshelp 100608163328-phpapp01Spsshelp 100608163328-phpapp01
Spsshelp 100608163328-phpapp01
 
MELJUN CORTES research lectures_evaluating_data_statistical_treatment
MELJUN CORTES research lectures_evaluating_data_statistical_treatmentMELJUN CORTES research lectures_evaluating_data_statistical_treatment
MELJUN CORTES research lectures_evaluating_data_statistical_treatment
 
jhghgjhgjhgjhfhcgjfjhvjhjgjkggjhgjhgjhfjgjgfgfhgfhg
jhghgjhgjhgjhfhcgjfjhvjhjgjkggjhgjhgjhfjgjgfgfhgfhgjhghgjhgjhgjhfhcgjfjhvjhjgjkggjhgjhgjhfjgjgfgfhgfhg
jhghgjhgjhgjhfhcgjfjhvjhjgjkggjhgjhgjhfjgjgfgfhgfhg
 
Inferential Statistics.pptx
Inferential Statistics.pptxInferential Statistics.pptx
Inferential Statistics.pptx
 
Analysis of data thiyagu
Analysis of data  thiyaguAnalysis of data  thiyagu
Analysis of data thiyagu
 
Analysis of Data - Dr. K. Thiyagu
Analysis of Data - Dr. K. ThiyaguAnalysis of Data - Dr. K. Thiyagu
Analysis of Data - Dr. K. Thiyagu
 
Analysis of Data - Dr. K. Thiyagu
Analysis of Data - Dr. K. ThiyaguAnalysis of Data - Dr. K. Thiyagu
Analysis of Data - Dr. K. Thiyagu
 
Hm306 week 4
Hm306 week 4Hm306 week 4
Hm306 week 4
 
Hm306 week 4
Hm306 week 4Hm306 week 4
Hm306 week 4
 
ecir2019tutorial
ecir2019tutorialecir2019tutorial
ecir2019tutorial
 
T test
T test T test
T test
 
Statistics for Physical Education
Statistics for Physical EducationStatistics for Physical Education
Statistics for Physical Education
 
11720171Chapter 9 Testing the Difference Betwee.docx
11720171Chapter 9 Testing the Difference Betwee.docx11720171Chapter 9 Testing the Difference Betwee.docx
11720171Chapter 9 Testing the Difference Betwee.docx
 
t-test vs ANOVA
t-test vs ANOVAt-test vs ANOVA
t-test vs ANOVA
 
Basics of Educational Statistics (T-test)
Basics of Educational Statistics (T-test)Basics of Educational Statistics (T-test)
Basics of Educational Statistics (T-test)
 

More from Tetsuya Sakai

More from Tetsuya Sakai (20)

NTCIR15WWW3overview
NTCIR15WWW3overviewNTCIR15WWW3overview
NTCIR15WWW3overview
 
sigir2020
sigir2020sigir2020
sigir2020
 
ipsjifat201909
ipsjifat201909ipsjifat201909
ipsjifat201909
 
sigir2019
sigir2019sigir2019
sigir2019
 
assia2019
assia2019assia2019
assia2019
 
ntcir14centre-overview
ntcir14centre-overviewntcir14centre-overview
ntcir14centre-overview
 
evia2019
evia2019evia2019
evia2019
 
Evia2017unanimity
Evia2017unanimityEvia2017unanimity
Evia2017unanimity
 
Evia2017assessors
Evia2017assessorsEvia2017assessors
Evia2017assessors
 
Evia2017dialogues
Evia2017dialoguesEvia2017dialogues
Evia2017dialogues
 
Evia2017wcw
Evia2017wcwEvia2017wcw
Evia2017wcw
 
sigir2017bayesian
sigir2017bayesiansigir2017bayesian
sigir2017bayesian
 
NL20161222invited
NL20161222invitedNL20161222invited
NL20161222invited
 
AIRS2016
AIRS2016AIRS2016
AIRS2016
 
Nl201609
Nl201609Nl201609
Nl201609
 
ictir2016
ictir2016ictir2016
ictir2016
 
ICTIR2016tutorial
ICTIR2016tutorialICTIR2016tutorial
ICTIR2016tutorial
 
On Estimating Variances for Topic Set Size Design
On Estimating Variances for Topic Set Size DesignOn Estimating Variances for Topic Set Size Design
On Estimating Variances for Topic Set Size Design
 
Topic Set Size Design with the Evaluation Measures for Short Text Conversation
Topic Set Size Design with the Evaluation Measures for Short Text ConversationTopic Set Size Design with the Evaluation Measures for Short Text Conversation
Topic Set Size Design with the Evaluation Measures for Short Text Conversation
 
assia2015sakai
assia2015sakaiassia2015sakai
assia2015sakai
 

Recently uploaded

Integration and Automation in Practice: CI/CD in Mule Integration and Automat...
Integration and Automation in Practice: CI/CD in Mule Integration and Automat...Integration and Automation in Practice: CI/CD in Mule Integration and Automat...
Integration and Automation in Practice: CI/CD in Mule Integration and Automat...Patryk Bandurski
 
Human Factors of XR: Using Human Factors to Design XR Systems
Human Factors of XR: Using Human Factors to Design XR SystemsHuman Factors of XR: Using Human Factors to Design XR Systems
Human Factors of XR: Using Human Factors to Design XR SystemsMark Billinghurst
 
Pigging Solutions in Pet Food Manufacturing
Pigging Solutions in Pet Food ManufacturingPigging Solutions in Pet Food Manufacturing
Pigging Solutions in Pet Food ManufacturingPigging Solutions
 
Pigging Solutions Piggable Sweeping Elbows
Pigging Solutions Piggable Sweeping ElbowsPigging Solutions Piggable Sweeping Elbows
Pigging Solutions Piggable Sweeping ElbowsPigging Solutions
 
Unlocking the Potential of the Cloud for IBM Power Systems
Unlocking the Potential of the Cloud for IBM Power SystemsUnlocking the Potential of the Cloud for IBM Power Systems
Unlocking the Potential of the Cloud for IBM Power SystemsPrecisely
 
SQL Database Design For Developers at php[tek] 2024
SQL Database Design For Developers at php[tek] 2024SQL Database Design For Developers at php[tek] 2024
SQL Database Design For Developers at php[tek] 2024Scott Keck-Warren
 
Beyond Boundaries: Leveraging No-Code Solutions for Industry Innovation
Beyond Boundaries: Leveraging No-Code Solutions for Industry InnovationBeyond Boundaries: Leveraging No-Code Solutions for Industry Innovation
Beyond Boundaries: Leveraging No-Code Solutions for Industry InnovationSafe Software
 
Transcript: #StandardsGoals for 2024: What’s new for BISAC - Tech Forum 2024
Transcript: #StandardsGoals for 2024: What’s new for BISAC - Tech Forum 2024Transcript: #StandardsGoals for 2024: What’s new for BISAC - Tech Forum 2024
Transcript: #StandardsGoals for 2024: What’s new for BISAC - Tech Forum 2024BookNet Canada
 
Kotlin Multiplatform & Compose Multiplatform - Starter kit for pragmatics
Kotlin Multiplatform & Compose Multiplatform - Starter kit for pragmaticsKotlin Multiplatform & Compose Multiplatform - Starter kit for pragmatics
Kotlin Multiplatform & Compose Multiplatform - Starter kit for pragmaticsAndrey Dotsenko
 
Designing IA for AI - Information Architecture Conference 2024
Designing IA for AI - Information Architecture Conference 2024Designing IA for AI - Information Architecture Conference 2024
Designing IA for AI - Information Architecture Conference 2024Enterprise Knowledge
 
Kotlin Multiplatform & Compose Multiplatform - Starter kit for pragmatics
Kotlin Multiplatform & Compose Multiplatform - Starter kit for pragmaticsKotlin Multiplatform & Compose Multiplatform - Starter kit for pragmatics
Kotlin Multiplatform & Compose Multiplatform - Starter kit for pragmaticscarlostorres15106
 
#StandardsGoals for 2024: What’s new for BISAC - Tech Forum 2024
#StandardsGoals for 2024: What’s new for BISAC - Tech Forum 2024#StandardsGoals for 2024: What’s new for BISAC - Tech Forum 2024
#StandardsGoals for 2024: What’s new for BISAC - Tech Forum 2024BookNet Canada
 
CloudStudio User manual (basic edition):
CloudStudio User manual (basic edition):CloudStudio User manual (basic edition):
CloudStudio User manual (basic edition):comworks
 
costume and set research powerpoint presentation
costume and set research powerpoint presentationcostume and set research powerpoint presentation
costume and set research powerpoint presentationphoebematthew05
 
"LLMs for Python Engineers: Advanced Data Analysis and Semantic Kernel",Oleks...
"LLMs for Python Engineers: Advanced Data Analysis and Semantic Kernel",Oleks..."LLMs for Python Engineers: Advanced Data Analysis and Semantic Kernel",Oleks...
"LLMs for Python Engineers: Advanced Data Analysis and Semantic Kernel",Oleks...Fwdays
 
Science&tech:THE INFORMATION AGE STS.pdf
Science&tech:THE INFORMATION AGE STS.pdfScience&tech:THE INFORMATION AGE STS.pdf
Science&tech:THE INFORMATION AGE STS.pdfjimielynbastida
 
Bluetooth Controlled Car with Arduino.pdf
Bluetooth Controlled Car with Arduino.pdfBluetooth Controlled Car with Arduino.pdf
Bluetooth Controlled Car with Arduino.pdfngoud9212
 

Recently uploaded (20)

Integration and Automation in Practice: CI/CD in Mule Integration and Automat...
Integration and Automation in Practice: CI/CD in Mule Integration and Automat...Integration and Automation in Practice: CI/CD in Mule Integration and Automat...
Integration and Automation in Practice: CI/CD in Mule Integration and Automat...
 
E-Vehicle_Hacking_by_Parul Sharma_null_owasp.pptx
E-Vehicle_Hacking_by_Parul Sharma_null_owasp.pptxE-Vehicle_Hacking_by_Parul Sharma_null_owasp.pptx
E-Vehicle_Hacking_by_Parul Sharma_null_owasp.pptx
 
DMCC Future of Trade Web3 - Special Edition
DMCC Future of Trade Web3 - Special EditionDMCC Future of Trade Web3 - Special Edition
DMCC Future of Trade Web3 - Special Edition
 
Human Factors of XR: Using Human Factors to Design XR Systems
Human Factors of XR: Using Human Factors to Design XR SystemsHuman Factors of XR: Using Human Factors to Design XR Systems
Human Factors of XR: Using Human Factors to Design XR Systems
 
Pigging Solutions in Pet Food Manufacturing
Pigging Solutions in Pet Food ManufacturingPigging Solutions in Pet Food Manufacturing
Pigging Solutions in Pet Food Manufacturing
 
Pigging Solutions Piggable Sweeping Elbows
Pigging Solutions Piggable Sweeping ElbowsPigging Solutions Piggable Sweeping Elbows
Pigging Solutions Piggable Sweeping Elbows
 
Unlocking the Potential of the Cloud for IBM Power Systems
Unlocking the Potential of the Cloud for IBM Power SystemsUnlocking the Potential of the Cloud for IBM Power Systems
Unlocking the Potential of the Cloud for IBM Power Systems
 
SQL Database Design For Developers at php[tek] 2024
SQL Database Design For Developers at php[tek] 2024SQL Database Design For Developers at php[tek] 2024
SQL Database Design For Developers at php[tek] 2024
 
Beyond Boundaries: Leveraging No-Code Solutions for Industry Innovation
Beyond Boundaries: Leveraging No-Code Solutions for Industry InnovationBeyond Boundaries: Leveraging No-Code Solutions for Industry Innovation
Beyond Boundaries: Leveraging No-Code Solutions for Industry Innovation
 
Vulnerability_Management_GRC_by Sohang Sengupta.pptx
Vulnerability_Management_GRC_by Sohang Sengupta.pptxVulnerability_Management_GRC_by Sohang Sengupta.pptx
Vulnerability_Management_GRC_by Sohang Sengupta.pptx
 
Transcript: #StandardsGoals for 2024: What’s new for BISAC - Tech Forum 2024
Transcript: #StandardsGoals for 2024: What’s new for BISAC - Tech Forum 2024Transcript: #StandardsGoals for 2024: What’s new for BISAC - Tech Forum 2024
Transcript: #StandardsGoals for 2024: What’s new for BISAC - Tech Forum 2024
 
Kotlin Multiplatform & Compose Multiplatform - Starter kit for pragmatics
Kotlin Multiplatform & Compose Multiplatform - Starter kit for pragmaticsKotlin Multiplatform & Compose Multiplatform - Starter kit for pragmatics
Kotlin Multiplatform & Compose Multiplatform - Starter kit for pragmatics
 
Designing IA for AI - Information Architecture Conference 2024
Designing IA for AI - Information Architecture Conference 2024Designing IA for AI - Information Architecture Conference 2024
Designing IA for AI - Information Architecture Conference 2024
 
Kotlin Multiplatform & Compose Multiplatform - Starter kit for pragmatics
Kotlin Multiplatform & Compose Multiplatform - Starter kit for pragmaticsKotlin Multiplatform & Compose Multiplatform - Starter kit for pragmatics
Kotlin Multiplatform & Compose Multiplatform - Starter kit for pragmatics
 
#StandardsGoals for 2024: What’s new for BISAC - Tech Forum 2024
#StandardsGoals for 2024: What’s new for BISAC - Tech Forum 2024#StandardsGoals for 2024: What’s new for BISAC - Tech Forum 2024
#StandardsGoals for 2024: What’s new for BISAC - Tech Forum 2024
 
CloudStudio User manual (basic edition):
CloudStudio User manual (basic edition):CloudStudio User manual (basic edition):
CloudStudio User manual (basic edition):
 
costume and set research powerpoint presentation
costume and set research powerpoint presentationcostume and set research powerpoint presentation
costume and set research powerpoint presentation
 
"LLMs for Python Engineers: Advanced Data Analysis and Semantic Kernel",Oleks...
"LLMs for Python Engineers: Advanced Data Analysis and Semantic Kernel",Oleks..."LLMs for Python Engineers: Advanced Data Analysis and Semantic Kernel",Oleks...
"LLMs for Python Engineers: Advanced Data Analysis and Semantic Kernel",Oleks...
 
Science&tech:THE INFORMATION AGE STS.pdf
Science&tech:THE INFORMATION AGE STS.pdfScience&tech:THE INFORMATION AGE STS.pdf
Science&tech:THE INFORMATION AGE STS.pdf
 
Bluetooth Controlled Car with Arduino.pdf
Bluetooth Controlled Car with Arduino.pdfBluetooth Controlled Car with Arduino.pdf
Bluetooth Controlled Car with Arduino.pdf
 

SIGIR2016