Downloaded 23 times


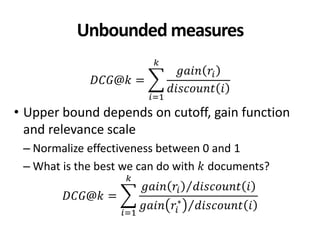
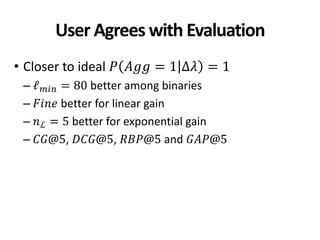
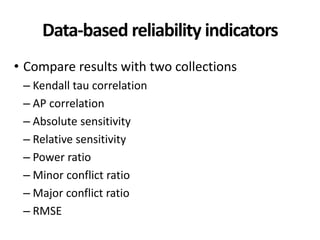
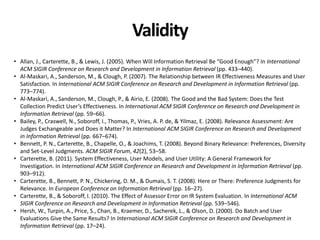
![Data
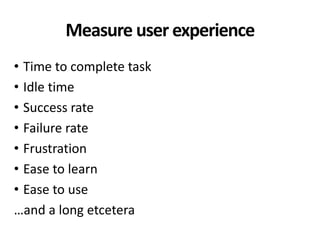
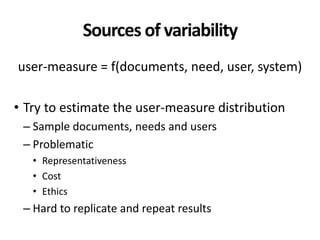
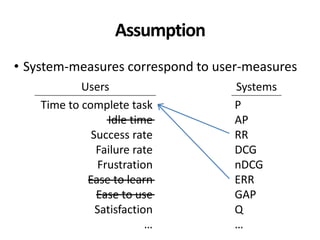
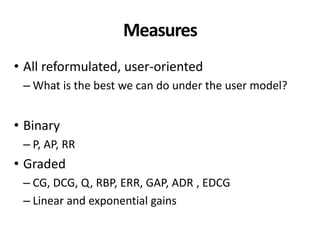
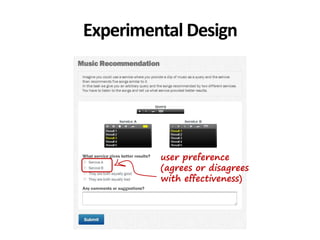
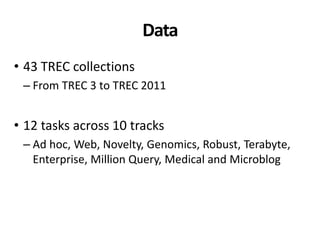
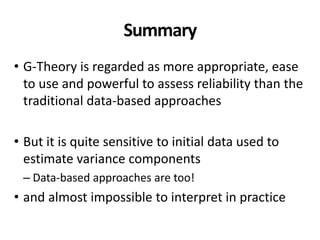
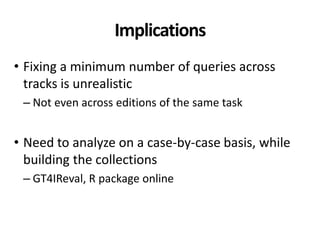
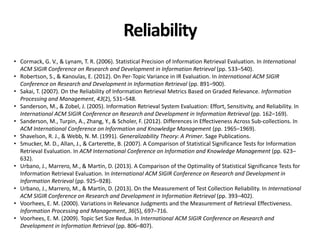
• Queries, documents and judgments from MIREX
– MIREX: TREC-like evaluation forum in Music IR
• 4,115 unique and artificial examples
– Covering full range of effectiveness
• In 10 bins 0, 0.1 , 0.1, 0.2 , … , [0.9, 1]
– At least 200 examples per measure/scale/bin
• 432 unique queries, 5,636 unique documents](https://image.slidesharecdn.com/cranfield-validity-reliability-130926113017-phpapp02/85/Validity-and-Reliability-of-Cranfield-like-Evaluation-in-Information-Retrieval-38-320.jpg)
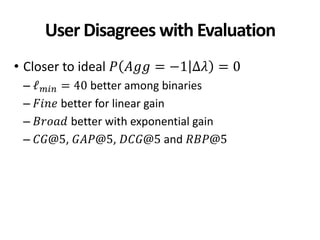

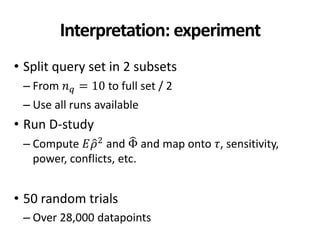
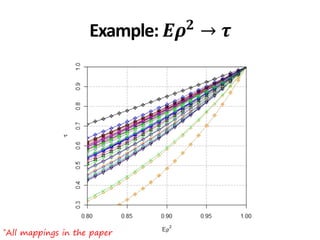
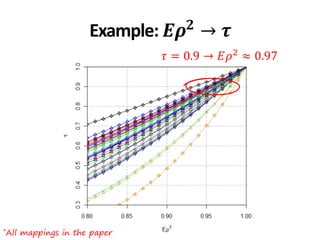
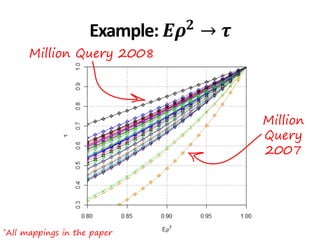
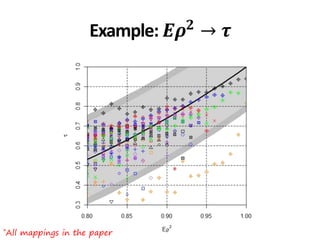
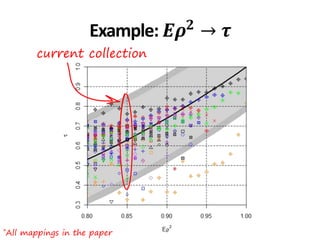
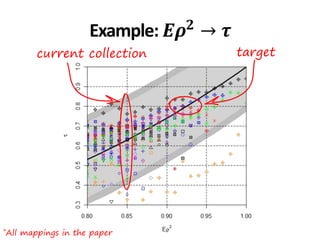
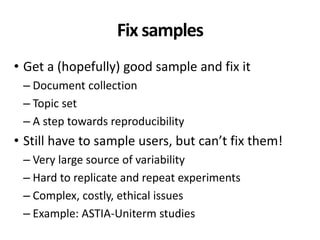
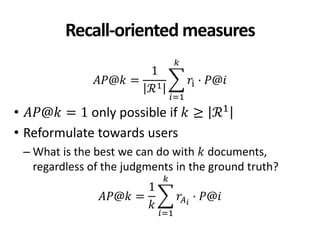
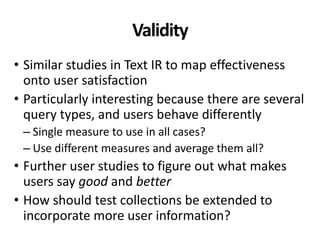
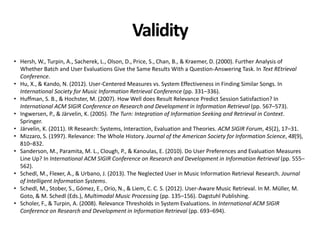
![*All collections and mappings in the paper
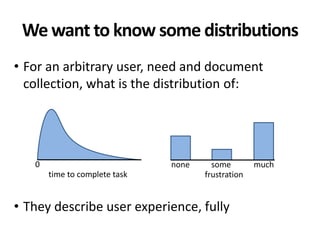
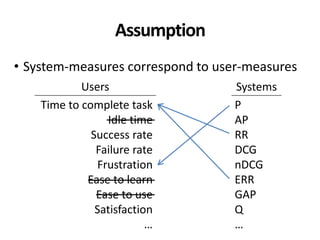
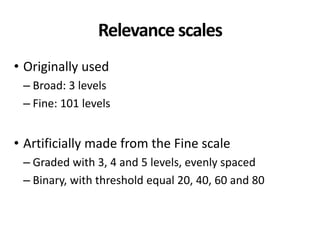
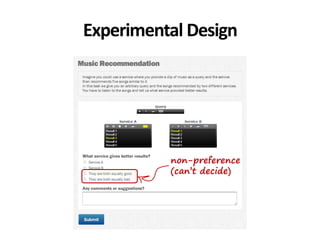
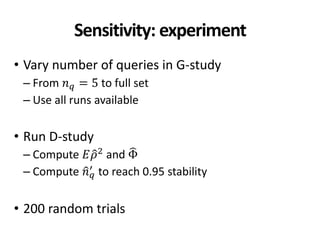
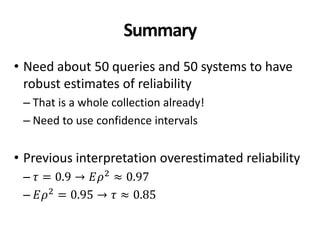
Example: Ad hoc 3-8
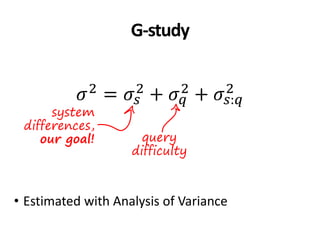
• 𝐸𝜌2
∈ 0.86,0.93 → 𝜏 ∈ [0.65,0.81]
• 𝑚𝑖𝑛𝑜𝑟 𝑐𝑜𝑛𝑓𝑙𝑖𝑐𝑡𝑠 ∈ 0.6, 8.2 %
• 𝑚𝑎𝑗𝑜𝑟 𝑐𝑜𝑛𝑓𝑙𝑖𝑐𝑡𝑠 ∈ 0.02, 1.38 %
• Queries to get 𝐸𝜌2
= 0.95: [37,233]
• Queries to get Φ = 0.95: [116,999]
• 50 queries were used](https://image.slidesharecdn.com/cranfield-validity-reliability-130926113017-phpapp02/85/Validity-and-Reliability-of-Cranfield-like-Evaluation-in-Information-Retrieval-105-320.jpg)
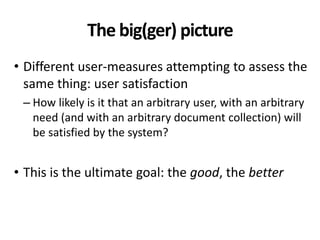
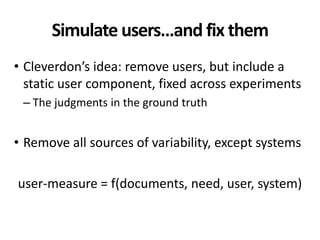
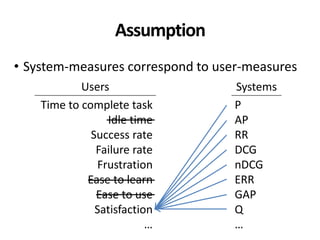
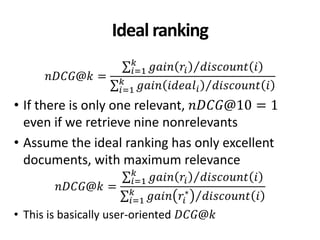
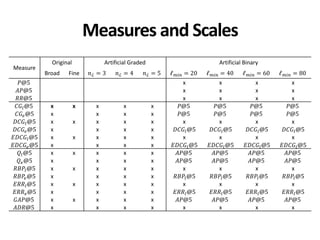
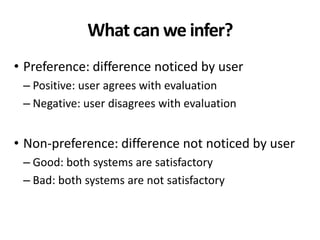
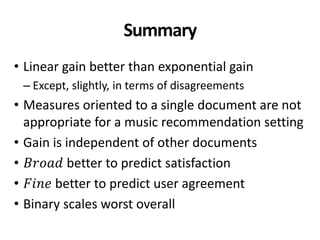
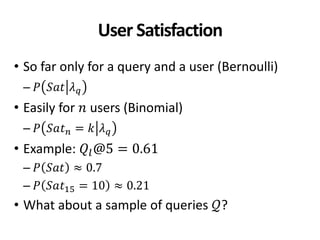
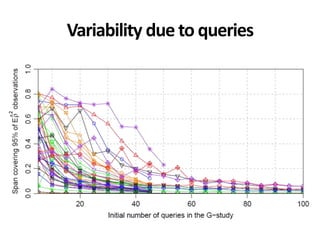
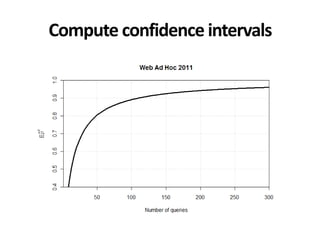
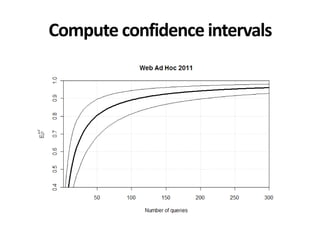
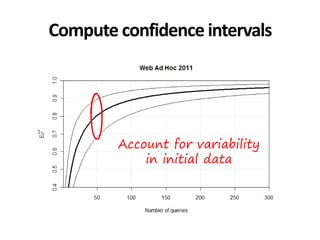
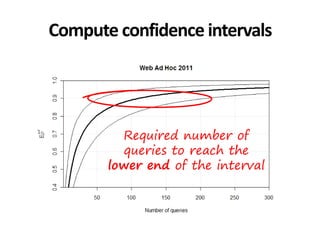
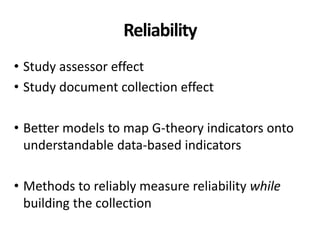
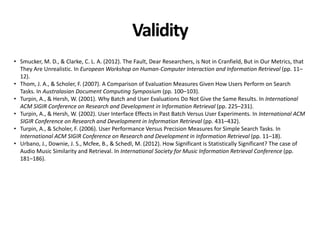
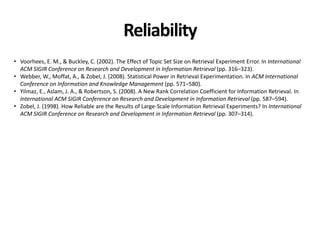
![Example: Web ad hoc
• TREC-8 to TREC-2001: WT2g and WT10g
– 𝐸𝜌2 ∈ 0.86,0.93 → 𝜏 ∈ [0.65,0.81]
– Queries to get 𝐸𝜌2 = 0.95: 40,220
• TREC-2009 to TREC-2011: ClueWeb09
– 𝐸𝜌2 ∈ 0.8,0.83 → 𝜏 ∈ [0.53,0.59]
– Queries to get 𝐸𝜌2
= 0.95: 107,438
• 50 queries were used](https://image.slidesharecdn.com/cranfield-validity-reliability-130926113017-phpapp02/85/Validity-and-Reliability-of-Cranfield-like-Evaluation-in-Information-Retrieval-106-320.jpg)
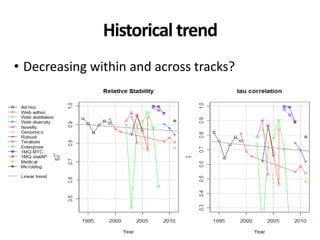
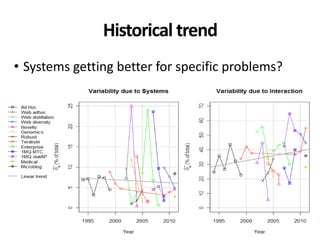
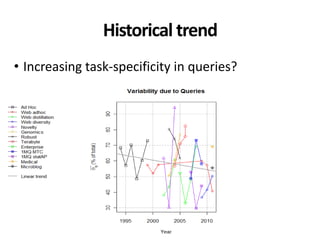
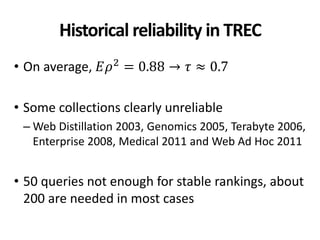


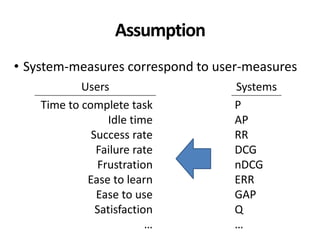
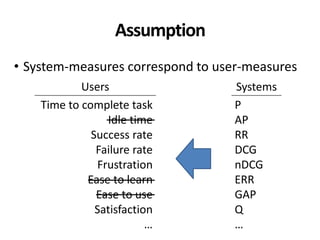
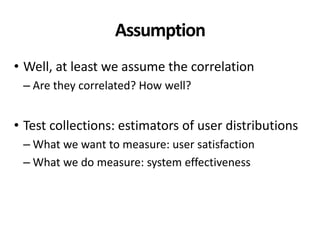
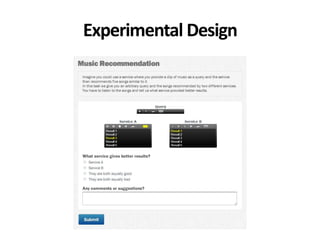
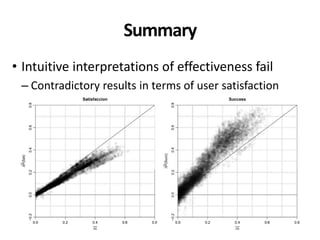
The document discusses the validity and reliability of using Cranfield-like test collections to evaluate information retrieval systems. It outlines some key assumptions made in using system-based measures as proxies for user-based measures of satisfaction. Specifically, it assumes system measures correlate with user satisfaction, but questions whether the mapping is accurate. It also notes reliability depends on test collection size and representation. The document then describes an experiment comparing user preferences to system measure scores to evaluate the validity of different measures and relevance scales in predicting user satisfaction with single or multiple retrieval systems.