Download to read offline
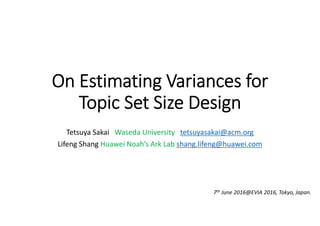
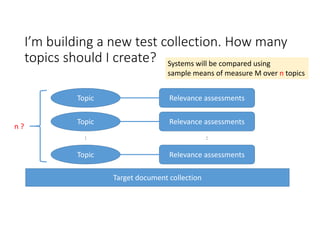
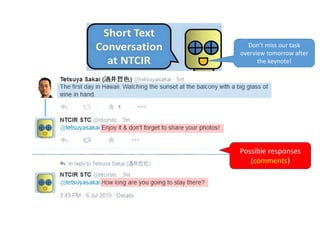
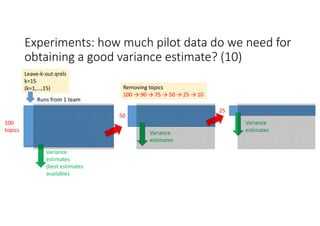
![Topic set size design [Sakai15IRJ]
http://link.springer.com/content/pdf/10.1007%2Fs10791‐015‐9273‐z.pdf
• Set n so as to ensure high statistical power for paired t‐tests
(comparing any two systems with a difference of minDt or larger)
• Set n so as to ensure high statistical power for one‐way ANOVAs
(comparing any m systems with a range of minD or larger)
• Set n so as to ensure the Confidence Interval (CI) of any system difference
is no wider than δ.
open access
Truth
H0 H1
Conclusion H0 Correct (1‐α) Type II Error (β)
H1 Type I Error (α) Correct (1‐β)
Power: ability to detect a
real difference](https://image.slidesharecdn.com/evia2016-160605235301/85/On-Estimating-Variances-for-Topic-Set-Size-Design-5-320.jpg)
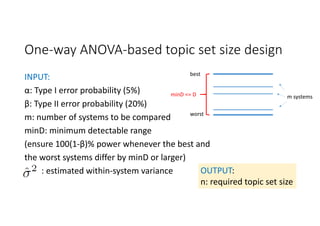
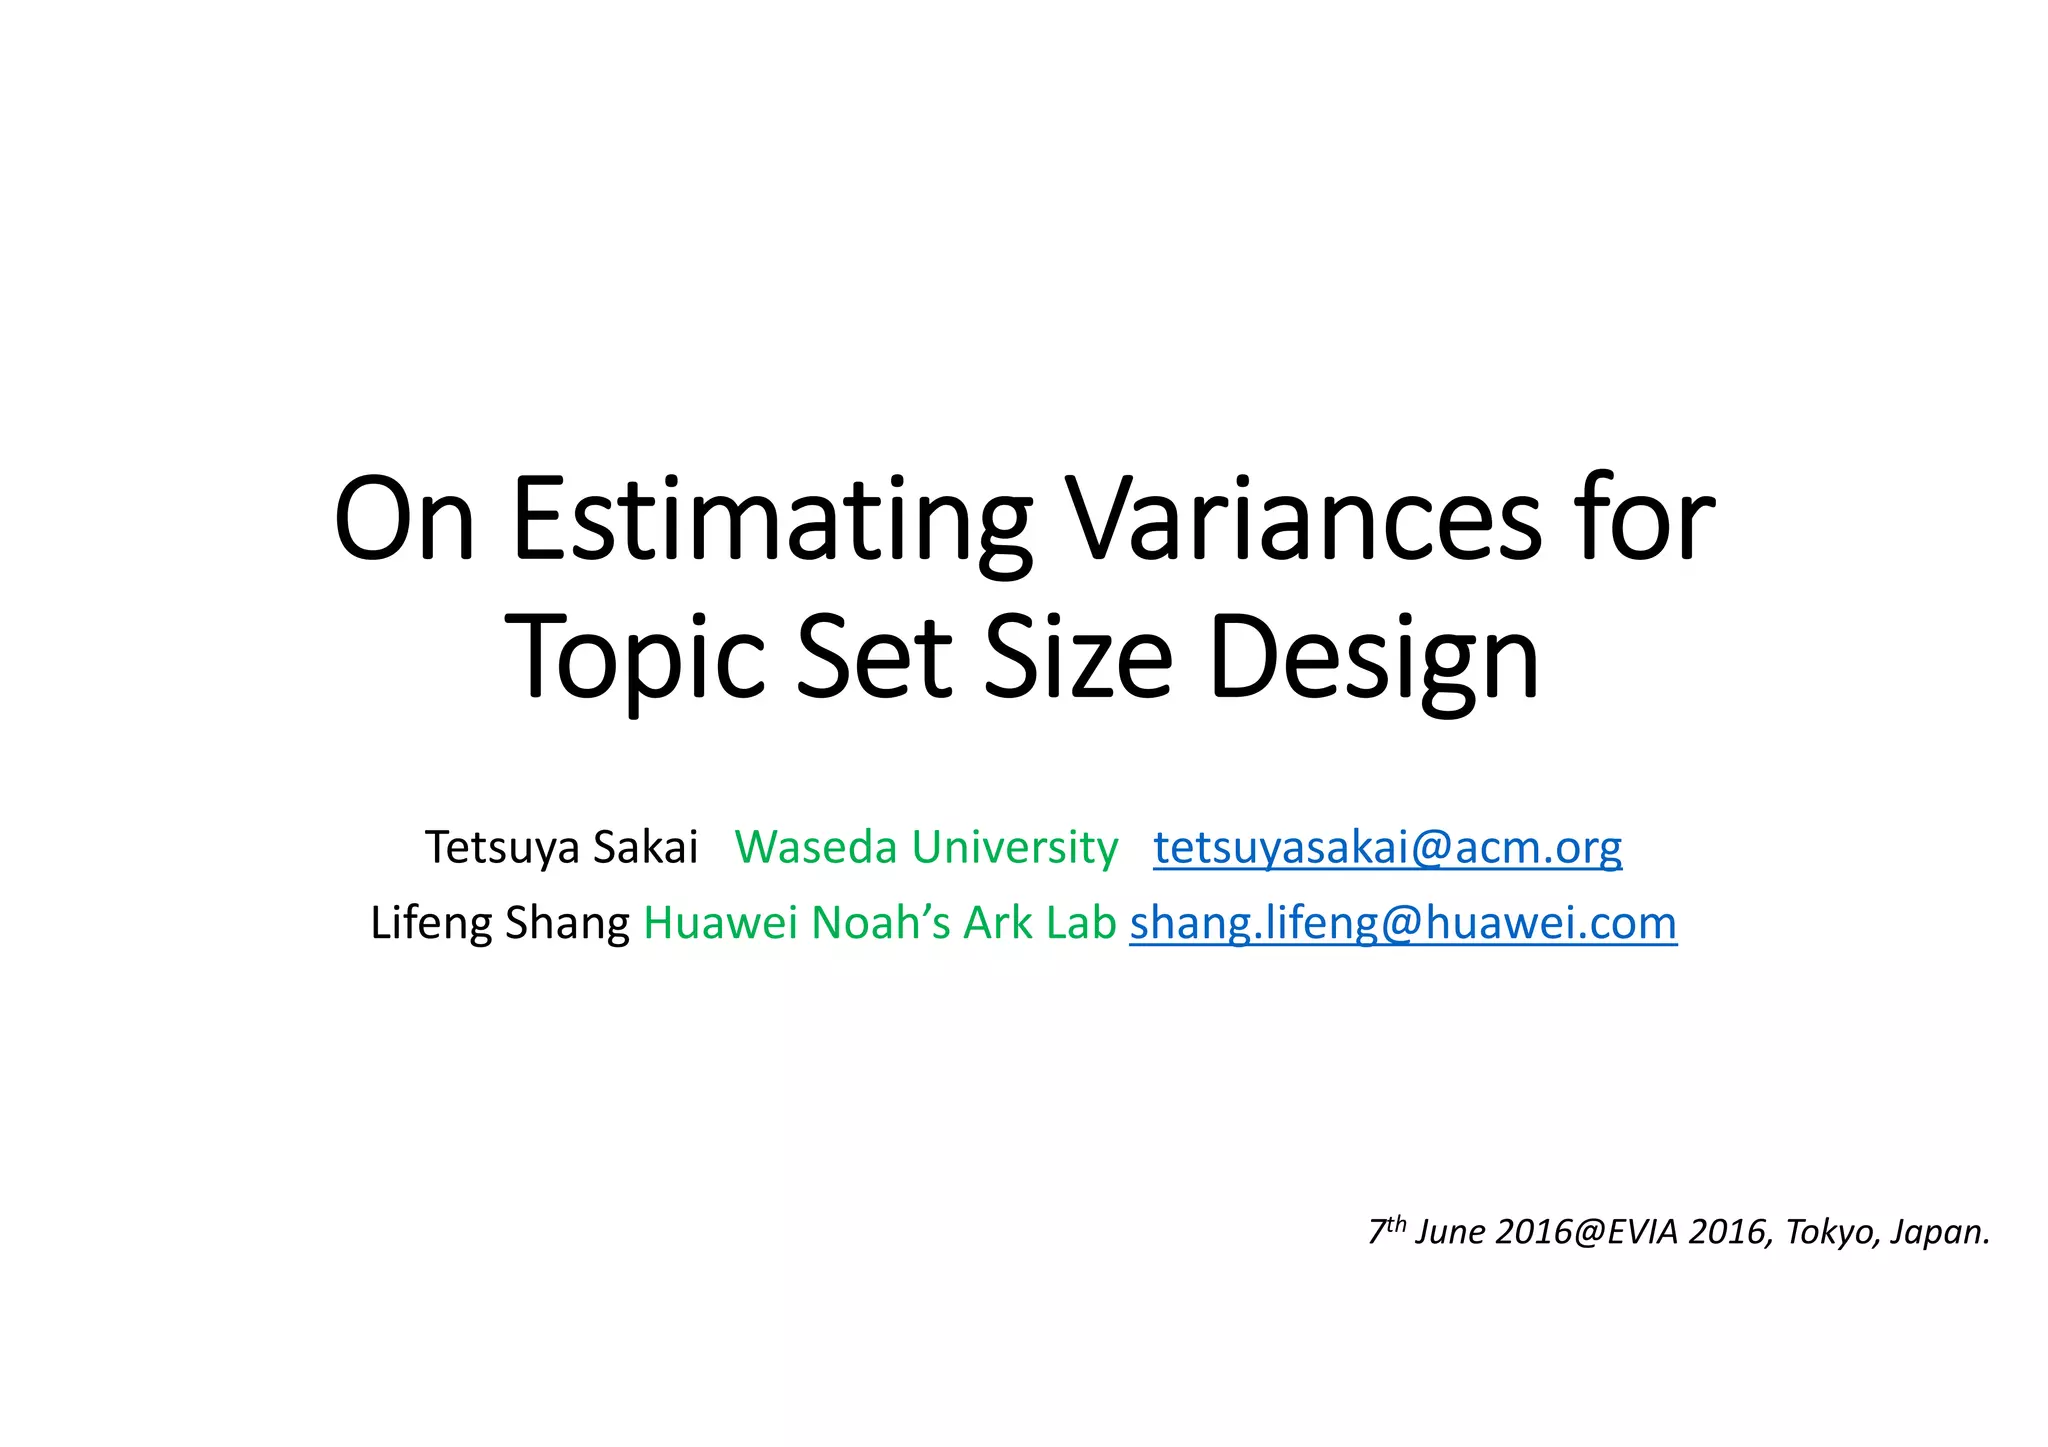
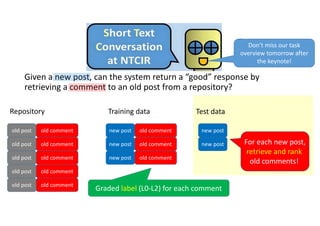
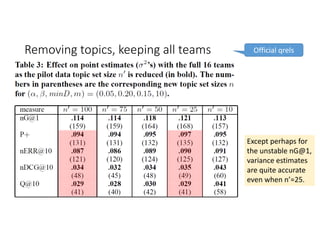
![Relationships with the other two topic set size
design methods [Sakai15IRJ]
ANOVA‐based results for m=10 can be
used instead of CI‐based results
ANOVA‐based
results for m=2
can be used
instead of t‐test‐
based results](https://image.slidesharecdn.com/evia2016-160605235301/85/On-Estimating-Variances-for-Topic-Set-Size-Design-7-320.jpg)
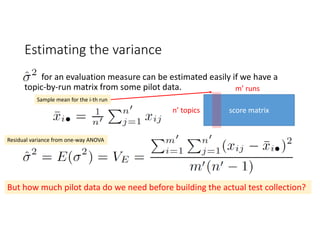
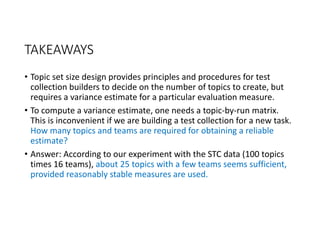
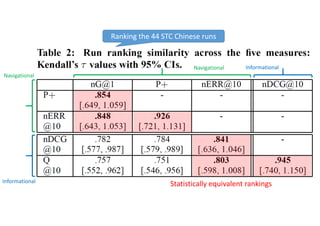
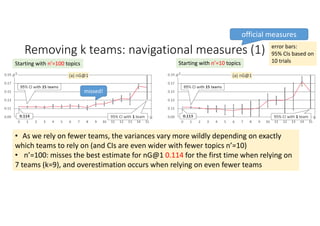
![STC Chinese subtask evaluation measure:
nG@1 (or nDCG@1 [Jarvelin+02] )
L2‐relevant
L2‐relevant
L1‐relevant
L1‐relevant
1
2
3
4
ideal
ranked list
3 points
3 points
1 points
1 points
L1‐relevant
Nonrelevant
L2‐relevant
Nonrelevant
1
2
3
4
System
output
3 points
1 point
Nonrelevantk
:
nG@1=1/3
nG@1 = 0 or 1/3 or 1
Gain Gain](https://image.slidesharecdn.com/evia2016-160605235301/85/On-Estimating-Variances-for-Topic-Set-Size-Design-12-320.jpg)
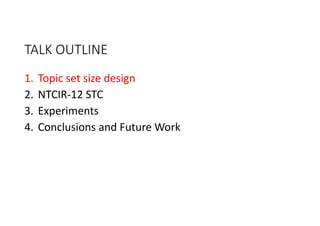
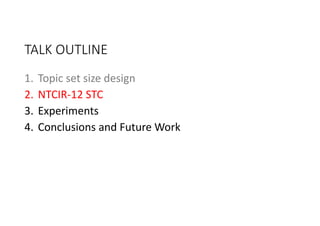
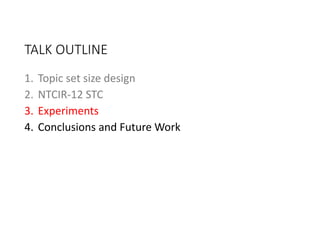
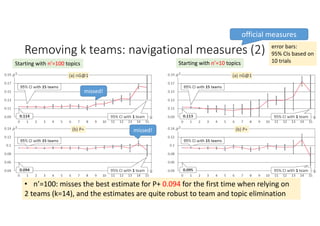
![STC Chinese subtask evaluation measure:
P+ [Sakai06AIRS]
L1‐relevant
Nonrelevant
L2‐relevant
Nonrelevant
1
2
3
4
System
output
Nonrelevantk
:
rp : most relevant
in list, nearest to
the top
No user will
go beyond rp
50% of users
50% of users
1 point
3 points
L2‐relevant
L2‐relevant
L1‐relevant
L1‐relevant
1
2
3
4
ideal
ranked list
3 points
3 points
1 point
1 point
Gain Gain
BR(3) = (2 + 4)/(3 + 7) = 0.6
BR(1) = (1 + 1)/(1 + 3) = 0.5
P+ = (BR(1) + BR(3))/ 2 = 0.5500](https://image.slidesharecdn.com/evia2016-160605235301/85/On-Estimating-Variances-for-Topic-Set-Size-Design-13-320.jpg)
![STC Chinese subtask evaluation measures:
nERR@10 [Chapelle11]
L2‐relevant
L2‐relevant
L1‐relevant
L1‐relevant
1
2
3
4
ideal
ranked list
L1‐relevant
Nonrelevant
L2‐relevant
Nonrelevant
1
2
3
4
System
output
Nonrelevantk
:
All users All users
1/4 of users
3/4 of users
3/4 of users
1/4 of users
3/4 of users
3/4 of users
1/4 of users
1/4 of users
1/4 of users
1/4 of users
3/4 of users
3/4 of users
ERR = 0.4375
ERR* = 0.8519
nERR = ERR/ERR* = 0.5136](https://image.slidesharecdn.com/evia2016-160605235301/85/On-Estimating-Variances-for-Topic-Set-Size-Design-14-320.jpg)
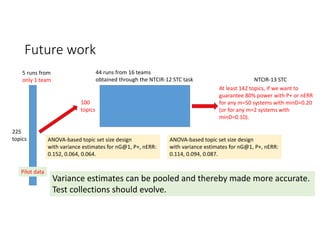
![STC Chinese subtask: the story so far [Sakai15AIRS]
https://waseda.box.com/AIRS2015
225
topics
5 runs from
only 1 team
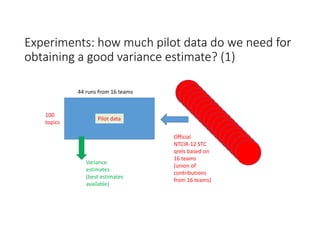
100
topics
44 runs from 16 teams
obtained through the NTCIR‐12 STC task
ANOVA‐based topic set size design
with variance estimates for nG@1, P+, nERR:
0.152, 0.064, 0.064.
Pilot data](https://image.slidesharecdn.com/evia2016-160605235301/85/On-Estimating-Variances-for-Topic-Set-Size-Design-16-320.jpg)
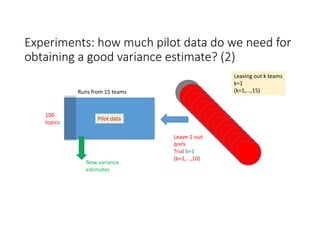

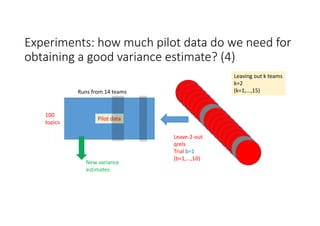
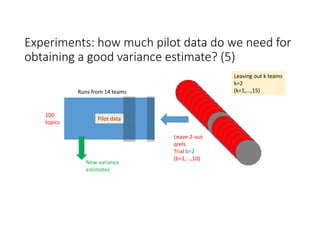
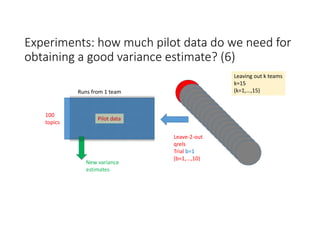
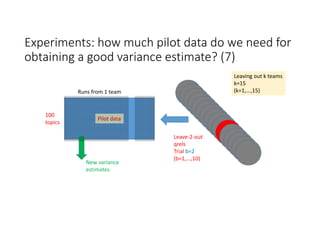
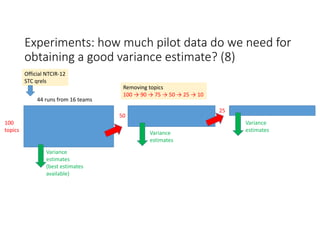
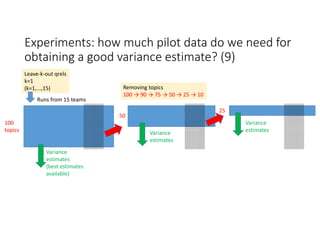
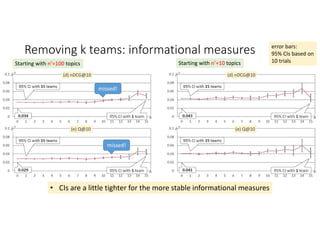
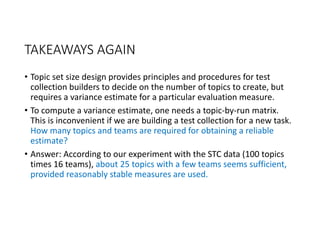

According to experiments using data from the NTCIR-12 STC task: - Variance estimates for evaluation measures were generally accurate even when using as few as 25 topics, provided reasonably stable measures were used. - As fewer teams' data was used to estimate variances, the estimates became more unstable and inaccurate, especially for less stable measures like nG@1. Using data from at least 7-9 teams seemed necessary to obtain reliable estimates. - Variance estimates were more accurate when starting with 100 topics compared to only 10 topics, and informational measures had tighter confidence intervals than navigational measures.


