Download to read offline


![Air Pollution Control 389
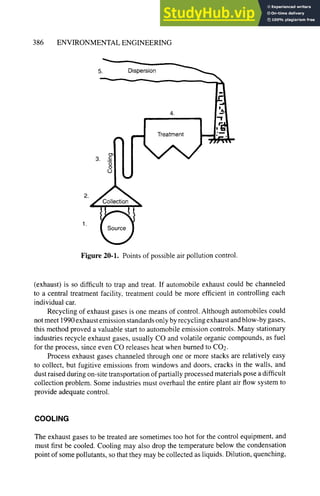
Cyclones
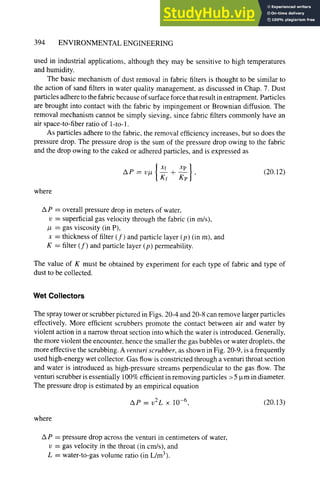
The cyclone is a popular, economical, and effective means of controlling particulates.
Cyclones alone are generally not adequate to meet stringent air pollution control regu-
lations, but serve as precleaners for control devices like fabric filters or electrostatic
precipitators. Figure 20-4 shows a simple diagram of a cyclone, and Fig. 20-5 a more
detailed picture. Dirty air enters the cyclone off-center at the bottom; a violent swirl of
air is thus created in the cone of the cyclone and particles are accelerated centrifugally
outward toward the cyclone wall. Friction at the wall slows the particles and they slide
to the bottom, where they can be collected. Clean air exits at the center of the top of the
cone. As may be seen in Fig. 20-6, cyclones are reasonably efficient for large particle
collection, and are widely used as the first stage of dust removal.
Cyclones are sized on the basis of desired centrifugal acceleration. Consider a
particle moving radially, from the central axis of the cyclone to the outside wall. The
velocity of this movement, assuming laminar flow and spherical particles, is
(Ps - P)ro)2d2
1)R -- , (20.5)
18/~
Clean air _ _]} ~31eanair
Dirty L~ag s
air
Dirty
air
Dust
Dust
Cyclone Bag filter
It? lean air t Clean air
f ] 1
Wa~eer__l./,.,,,
.,,:i:=..,.
?,,l hill I I Pipe
9
--,,in,- ,, ,,, ,, ,5 /~I
?, ':,' .., ;.,
aDiirty ] Dirty Rod
9 air
Dust &water Dust
Wet scrubber Electrostatic precipitator
Figure20-4. Four methods of controlling (trapping) particulate matter from station-
ary sources.](https://image.slidesharecdn.com/airpollutioncontrol-230806171735-65924a44/85/Air-Pollution-Control-5-320.jpg)
![392 ENVIRONMENTAL ENGINEERING
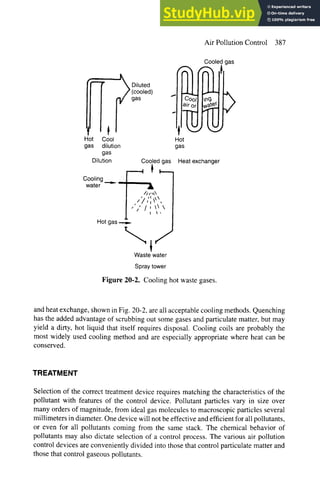
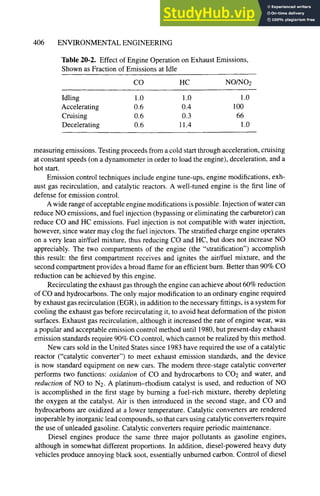
Table 20-1. Values of K for Calculating
Cyclone Pressure Drop
Cyclone diameter (in.) K
29
16
8
4
10-4
10-3
10-2
0.1
P = absolute pressure (in atm),
p = gas density (in kg/m3),
T = temperature (in K), and
K = proportionality factor, a function of cyclone diameter.
Approximate values of K are given in Table 20-1. Typical pressure drops in cyclones
are between 1 and 8 in. of water.
The collection efficiency of a cyclone can be estimated by using the concept of a
cut diameter, the particle diameter at which 50% of the particles are removed from the
gas stream by the cyclone. The cut diameter is
i 9~b ]1/2
dc -- 2rcNvi(p - Ps) ' (20.10)
where
# -- gas viscosity (in kg/m-h),
b = cyclone inlet width (in m),
N = effective number of outer turns in cyclone (usually about four),
Vi = inlet gas velocity (in m/s),
Ps = particle density (in kg/m3), and
p = gas density (in kg/m3), usually negligible compared to Ps.
Figure 20-6 shows how the cut diameter can be used to establish the collection
efficiency for particles of any diameter d. The number of turns N can also be
approximated as
7l"
N --- --(2L2 - L1) (20.11)
H
where
H = height of the inlet (in m),
L1 = length of cylinder (in m), and
L2 = length of cone (in m).](https://image.slidesharecdn.com/airpollutioncontrol-230806171735-65924a44/85/Air-Pollution-Control-8-320.jpg)
![Air Pollution Control 393
EXAMPLE20.1. A cyclone has an inlet width of 10 cm and four effective turns (N = 4).
The gas temperature is 350 K and the inlet velocity is 10 m/s. The average parti-
cle diameter is 8 Ixm and the average density is 1.5 g/cm3. What is the collection
efficiency?
The viscosity of air at 350 K is 0.0748 kg/m-h. We can assume that p is negligible
compared to Ps"
[ 9(0.0748 kg/m-h)(0.1 m)]1/2
de= 2rr (4) (10 m/s) (3600 s/h) (1500 kg/m3)
= 7.04 x 10⁻⁶m - 7.04 Ixm.
Then, using Eq. (20.10)
d g
dc 7.04
= 1.14,
and from Fig. 20-6, the expected removal efficiency is about 55%.
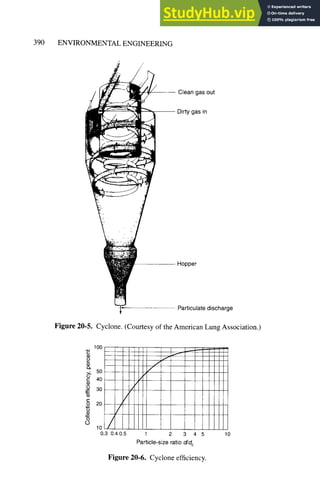
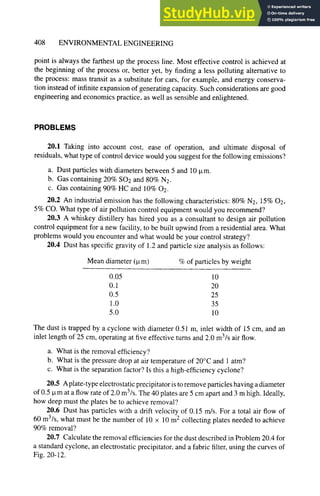
Fabric Filters
Fabric filters used for controlling particulate matter (Figs. 20-4 and 20-7) operate like
a vacuum cleaner. Dirty gas is blown or sucked through a fabric filter bag. The fabric
bag collects the dust, which is removed periodically by shaking the bag. Fabric filters
can be very efficient collectors for even submicrometer-sized particles and are widely
(,,
/ _
Clean gas out
Filter bags
Dirty gas in
Hopper
Discharge
Figure 20-7. Industrial fabric filter apparatus.
Association.)
(Courtesy of American Lung](https://image.slidesharecdn.com/airpollutioncontrol-230806171735-65924a44/85/Air-Pollution-Control-9-320.jpg)


![402 ENVIRONMENTAL ENGINEERING
SO2 from fossil-fuel burning off-gas was first controlled by trapping as calcium sulfate
in a lime-limestone mixture. This mixture was produced by calcining limestone and
injecting lime into the scrubber and adding limestone to the boiler. Although the SO2
was absorbed as CaSO3 and CaSO4, the lime-limestone absorbing material created a
solid waste disposal problem of staggering proportions.
Flue-gas desulfurization methods that trap SO2 as sulfite instead of sulfate allow
regeneration of the absorbing material, and thus mitigate the solid waste disposal
problem. A typical method is single-alkali scrubbing, for which the reactions are
SO2-~-Na2SO3 + H20 --~ 2NaHSO3
2NaHSO3 --+ Na2SO3 + H20 + SO2.
The concentrated SO2 that is recovered from this process can be used industrially in
pulp and paper manufacture and sulfuric acid manufacture. Figure 20-16 is a diagram
for single-alkali scrubbing.
A modification of this system that is both more efficient and less wasteful is
double-alkali scrubbing, in which a primary scrubbing cycle dissolves the SO2 in a
sodium hydroxide solution, forming sodium bisulfite by the reaction
502-~-NaOH --+ NaHSO3.
Addition of lime in the second step regenerates the NaOH and produces calcium
sulfite.
Clean gas
lReheatI SO2
To SO2
recovery
l and
H2OI ! J " '1
' / ~lC~ ]
[~ | ]Separat~ 1
Absorber ] !
Evaporator
Flue gas| ~ | Na2SO3(s) ].... MakeupNa2SO3
I[ lSurge 1 1 l
tan, I
NaHSO3 m
soln. IV 9 9I
/ ]Dissolving ]
'~ ,,, [ tank ]
Figure 20-16. Simplified diagram for single-alkali scrubbing of flue gas with
regeneration.](https://image.slidesharecdn.com/airpollutioncontrol-230806171735-65924a44/85/Air-Pollution-Control-18-320.jpg)


![Air Pollution Control 405
Air "~
Carburetor , I Fuel
[~'-~Fu-~el tank
~ e/~~j~t:xna,!st
CrankntaS
L ~ Tailpipe
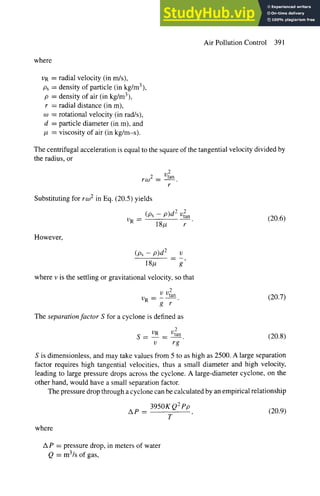
Figure 20-17. Diagram of the internal combustion engine showing four major
emission points.
Vapo__,
r Activated
carboncanister
.,
Air__ ! I 1 ] Vapor+Air Purgeair
" ~ -.---"' 11 UlVapor
1 Fue,+A,r ue'!1
PCV~T1
J ill.
valve l~/I [ ~
l~'~Fuel tank
I IExhaust ~
Crankcase~l I I II~ ~ Tailpipe
vent u.,er
Catalytic
reactor
Figure 20-18. Internal combustion engine, showing methods of controlling emissions.
trapped in an activated-carbon canister, and can be purged periodically with air, and
then burned in the engine, as shown schematically in Fig. 20-18. The crankcase vent
can be closed off from the atmosphere, and the blowby gases recycled into the intake
manifold. The positive crankcase ventilation (PCV) valve is a small check valve that
prevents buildup of pressure in the crankcase.
The exhaust accounts for about 60% of the emitted hydrocarbons and almost all of
the NO, CO, and lead, and poses the most difficult control problem of mobile sources.
Exhaust emissions depend on the engine operation, as is shown in Table 20-2. During
acceleration, the combustion is efficient, CO and HC are low, and high compression
produces a lot of NO/NO2. On the other hand, deceleration results in low NO]NO2
and high HC because of the presence of unburned fuel in the exhaust. This variation in
emissions has prompted EPA to institute a standard acceleration-deceleration cycle for](https://image.slidesharecdn.com/airpollutioncontrol-230806171735-65924a44/85/Air-Pollution-Control-21-320.jpg)


This document discusses various methods for controlling air pollution emissions from industrial processes and vehicles. It begins by explaining that air pollution control is technically difficult and expensive since the only natural mechanisms for cleaning the air are rain and deposition. It then describes five main points of control: source correction, collection of pollutants, cooling, treatment, and dispersion. Specific control methods discussed include process changes, raw material substitution, equipment modification, recycling exhaust gases, cyclones, and fabric filters. Cyclones are described in detail as a common and economical means of controlling particulate matter emissions.


