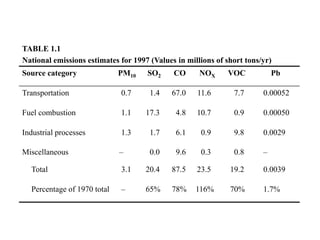
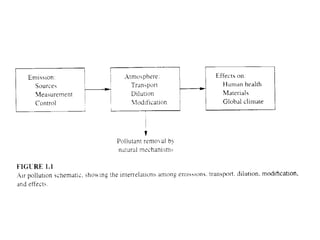
SlideShare a Scribd company logo
1
Introduction to Air
Pollution Control
朱信
Hsin Chu
Professor
Dept. of Environmental Engineering
National Cheng Kung University
2
1. Some of the History of Air Pollution Control in
the United States of America
 Although air pollution control actions go back at least
as far as the thirteenth century, most of the major
effort in the world has taken place since 1945.
 In the 1930s and 1940s, a factory smokestack issuing
a thick plume of smoke was considered a sign of
prosperity.
3
 Before 1945, industrial air pollution control efforts
were directed at controlling large-factory emissions
of pollutants that had led to conflict with neighbors of
the factories.
 Much of this did not involve governmental action, but
rather was a response to nuisance damage suits or the
threat of such suits.
4
 Between 1945 and 1969, as awareness of air pollution
problems gradually increased, some worthwhile local
efforts to control air pollution were initiated, notably
in Pittsburgh, Los Angeles, and St. Louis.
 Between 1963 and 1967 the federal government
began to oversee and coordinate local and state air
pollution control efforts.
5
 In 1969 and 1970, the United States experienced a
great environmental awakening.
 Environmental matters were scarely mentioned in
newspapers in 1968, but the same newspapers had an
environmental story every day in 1970.
6
 This period saw the passage of the National
Environmental Policy Act and the Clean Air Act of
1970, both of which have had sweeping effects and
have greatly changed american way of dealing with
air pollution.
 Similar changes took place throughout the industrial
world at about the same time, with similar effects.
7
 At first the leaders of the older “smokestack”
industries (steel, copper, some electric power) fought
the new regulations, in the courts, in the press, and in
congress.
 Twenty-five years later their successors mostly have
decided that the air pollution regulations are here to
stay and that their goals should be to influence the
regulatory process to make the regulations as clear
and practical as possible and then to comply with the
regulations in as efficient and economical a way as
possible.
8
 In the late 1980s, a new theme entered the air
pollution arena: global air pollution.
 In the 1980s, three problems emerged involving
longer-lived pollutants and pollutants that are
transported a long way before they do their damage:
acid rain
destruction of the ozone layer by chlorofluorocarbons
buildup of carbon dioxide in the atmosphere
9
 The legal and administrative structure developed in
the 1970s to deal with local air pollution problems
seems useless to deal with these international or
global problems.
 The developing countries responded later than the US,
and used a mixture of the ideas combined from the
US and the World Health Organization, which seek
similar goals by somewhat different means.
10
2. Why the Sudden Rise in Interest in
1969-1970?
 Environmental concern is often considered a luxury
only wealthy nations can afford, and the US had
become very wealthy.
 To a person whose basic physical needs are satisfied,
air pollution can be a much greater cause for concern.
11
 Furthermore, as we have learned to prevent or treat
infectious disease such as influenza, tuberculosis, etc.,
we have doubled our average life span.
 Therefore, we survive long enough to die of long-
term diseases such as arteriosclerosis, heart
malfunctions, stroke, emphysema, and cancer, all of
which are related to environmental factors, including
air pollution.
12
3. Dirty Air Removal or
Emission Control?
 Example 1
The area of the Los Angeles basin is 4,083 square
miles.
The heavily polluted air layer is assumed to be 2,000
ft thick on average.
One solution to Los Angeles’ problems would be to
pump this contaminated air away.
13
 Suppose that we wish to pump out the Los Angeles
basin every day and that the air must be pumped 50
miles to the desert near palm springs.
 Assume also that the average velocity in the pipe is
40 ft/s.
Estimate the required pipe diameter.
14
 Solution:
The flow rate required is
 The required pipe diameter is
2 2
3
9 7 3
4,083 2,000 (5,280 / )
24 3,600 /
2.63 10 7.47 10 /
AH mi ft ft mi
Q
t h s h
ft
m s
s
 

   
9
4 4 2.63 10 /
40 / 9,158 2,791
Q ft s
ft s
D ft m
 
 

   
15
 This is about six times the height of the tallest man-
made structure, and far beyond our current structural
engineering capabilities.
 Therefore, we are unlikely to solve our air pollution
problems by pumping away the polluted air.
 Instead, we must deal with those problems by
reducing emissions, the principal subject of the rest of
this course.
16
4. One Problem or a Family
of Problems?
 Next slide (Table 1.1)
Emissions estimates for the major man-made
pollutants for the US in 1997.
TABLE 1.1
National emissions estimates for 1997 (Values in millions of short tons/yr)
Source category PM10 SO2 CO NOX VOC Pb
Transportation 0.7 1.4 67.0 11.6 7.7 0.00052
Fuel combustion 1.1 17.3 4.8 10.7 0.9 0.00050
Industrial processes 1.3 1.7 6.1 0.9 9.8 0.0029
Miscellaneous – 0.0 9.6 0.3 0.8 –
Total 3.1 20.4 87.5 23.5 19.2 0.0039
Percentage of 1970 total – 65% 78% 116% 70% 1.7%
18
 The public thinks in terms of “general air pollution”
and wonders if the problem is mostly industry (them)
or autos (us).
 Engineers recognize that there is not “one” air
pollution problem but a group of related problems.
19
 From 1970 to 1997, the US has made significant progress in
reducing emissions of lead (mostly by taking lead out of
gasoline) and modest progress in reducing emissions of the
other major pollutants.
 The air pollutant emissions situation can be roughly
approximated by:
 
Air pollutant economic activity pollutant emissions
population
emissions per person per unit of economic activity
     

     
     
20
 Since the environmental awakening of 1969-1970,
the population of the US has increased by about 30%,
the economic activity per person by about 80%, and
the motor vehicle usage by about a factor of 4.
 However, the pollutant emissions per unit of
economic activity have declined steadily because of
stringent programs of emission control.
21
 Thus, in most of the US, the emissions and hence the
measured concentrations of most pollutants in the
atmosphere declined steadily between 1970 and 1997.
 There are exceptions to this decline, e.g., increases in
acid rain in the northeastern United States.
22
5. Emissions, Transport,
Receptors
 Next slide (Fig. 1.1)
A schematic of the air pollution process.
24
 In Fig. 1.1 we see a major reason why air pollution is
different from water pollution or industrial hygiene.
 If the same figure were drawn for water pollution, the
atmospheric transport box would be replaced by a
box for groundwater or stream transport.
 Those mechanisms are indeed complex, but not
nearly as complex as atmospheric transport.
25
 We would also see that the chemical or biological
form in which most water pollutants are emitted is the
one that causes harmful effects.
 The same is not true of air pollution: many of the
major pollutants are formed in the atmosphere and are
called secondary pollutants to distinguish them from
their precursors, the primary pollutants.
26
 Next slide (Fig. 1.2)
Smoothed average concentrations of four major air
pollutants for one day in Los Angeles.
 CO and NO are primary pollutants, emitted mostly by
automobiles, their peak concentrations occur during
the morning commute period.
 NO2 and O3 are secondary pollutants formed in the
atmosphere by a complex set of reactions,
summarized as:
NO + HC + O2 + sunlight → NO2 + O3 (1)
28
 The peak concentration of NO2 occurs before the
peak for O3 because the reaction sequence forms NO2
first, then O3.
 The CO concentration peak does not decline as
rapidly as the NO peak because the CO concentration
is reduced only by atmospheric mixing and dilution
whereas the NO concentration is reduced by dilution
and mixing and by the chemical reaction in Eq. (1).
29
 The afternoon commute also produces increases in
NO and CO, but the measured concentrations are not
as large as the morning peaks because the average
wind speed is higher and the atmospheric mixing is
stronger in the afternoon than in the morning.
 It has also been observed that the highest peak O3
concentration normally occurs about 30 to 60 miles
downwind of the place that had the maximum
morning emission of NO and HC because the
polluted air mass can ride the wind that far in a day.
30
 The two pollutants of greatest current health concern
are both secondary: ozone, as described above, and
fine particles.
 The very small particles that enter most deeply into
out lungs and that are believed to be most harmful are
largely formed in the atmosphere by reactions that
can be summarized as:
HC + SOX +NOX → fine particles
31
6. Units and Standards
 In this course, both English and SI (cgs) units are
used.
 A concentration expressed in parts per million (ppm)
is almost always ppm by volume or by mol if it is
concentration in a gas, and ppm by mass or weight if
it is concentration in a liquid or solid.
32
 When standard conditions for a gas are referred to,
there seems to be only one choice for pressure, the
standard atmosphere.
 Unfortunately, there is no comparable agreement as to
which temperature should be used. Vaues of 0℃,
18℃, 20℃ and 25℃ are used.
 Throughout this course, unless stated otherwise, air
and process gases are assumed to be at 1 standard
atmosphere and 20℃ (= 68oF)

More Related Content

Similar to 01-Introduction to Air Pollution Control.ppt

The Importance Of Reduce Air Pollution
The Importance Of Reduce Air PollutionThe Importance Of Reduce Air Pollution
The Importance Of Reduce Air Pollution
Paper Writing Service Superiorpapers Saint Leo
 
Air Pollution
Air PollutionAir Pollution
Air Pollution
margori
 
19 air quality
19 air quality19 air quality
19 air quality
dompiazza
 
Essay Air Pollution
Essay Air PollutionEssay Air Pollution
Essay Air Pollution
Custom Paper Services
 
Gasping for Breath: A (bogus) analysis of the health effects from ozone pollu...
Gasping for Breath: A (bogus) analysis of the health effects from ozone pollu...Gasping for Breath: A (bogus) analysis of the health effects from ozone pollu...
Gasping for Breath: A (bogus) analysis of the health effects from ozone pollu...
Marcellus Drilling News
 
Lesson4greenhousegases climate and change edexcel GCSE Geography B
Lesson4greenhousegases climate and change edexcel GCSE Geography BLesson4greenhousegases climate and change edexcel GCSE Geography B
Lesson4greenhousegases climate and change edexcel GCSE Geography B
sarah marks
 
1aap
1aap1aap
1aap
ELIMENG
 
Case studies in improving urban air quality
Case studies in improving urban air qualityCase studies in improving urban air quality
Case studies in improving urban air quality
ngocjos
 
Carbon based fuels and the environment
Carbon based fuels and the environmentCarbon based fuels and the environment
Carbon based fuels and the environment
Craig Kielb
 
Carbon based fuels and the environment
Carbon based fuels and the environmentCarbon based fuels and the environment
Carbon based fuels and the environment
Craig Kielb
 
Routes to Clean Air 2015 - Prof. Jim Longhurst
Routes to Clean Air 2015 - Prof. Jim LonghurstRoutes to Clean Air 2015 - Prof. Jim Longhurst
Routes to Clean Air 2015 - Prof. Jim Longhurst
IES / IAQM
 
Pollution
PollutionPollution
Pollution
AabidJanwari
 
Mobile Air Pollution
Mobile Air PollutionMobile Air Pollution
Mobile Air Pollution
Ed Stermer
 
1.-Air-Quality-and-Air-Pollution_24Sep2020.pptx
1.-Air-Quality-and-Air-Pollution_24Sep2020.pptx1.-Air-Quality-and-Air-Pollution_24Sep2020.pptx
1.-Air-Quality-and-Air-Pollution_24Sep2020.pptx
PriyankaSharma89719
 

Similar to 01-Introduction to Air Pollution Control.ppt (14)

The Importance Of Reduce Air Pollution
The Importance Of Reduce Air PollutionThe Importance Of Reduce Air Pollution
The Importance Of Reduce Air Pollution
 
Air Pollution
Air PollutionAir Pollution
Air Pollution
 
19 air quality
19 air quality19 air quality
19 air quality
 
Essay Air Pollution
Essay Air PollutionEssay Air Pollution
Essay Air Pollution
 
Gasping for Breath: A (bogus) analysis of the health effects from ozone pollu...
Gasping for Breath: A (bogus) analysis of the health effects from ozone pollu...Gasping for Breath: A (bogus) analysis of the health effects from ozone pollu...
Gasping for Breath: A (bogus) analysis of the health effects from ozone pollu...
 
Lesson4greenhousegases climate and change edexcel GCSE Geography B
Lesson4greenhousegases climate and change edexcel GCSE Geography BLesson4greenhousegases climate and change edexcel GCSE Geography B
Lesson4greenhousegases climate and change edexcel GCSE Geography B
 
1aap
1aap1aap
1aap
 
Case studies in improving urban air quality
Case studies in improving urban air qualityCase studies in improving urban air quality
Case studies in improving urban air quality
 
Carbon based fuels and the environment
Carbon based fuels and the environmentCarbon based fuels and the environment
Carbon based fuels and the environment
 
Carbon based fuels and the environment
Carbon based fuels and the environmentCarbon based fuels and the environment
Carbon based fuels and the environment
 
Routes to Clean Air 2015 - Prof. Jim Longhurst
Routes to Clean Air 2015 - Prof. Jim LonghurstRoutes to Clean Air 2015 - Prof. Jim Longhurst
Routes to Clean Air 2015 - Prof. Jim Longhurst
 
Pollution
PollutionPollution
Pollution
 
Mobile Air Pollution
Mobile Air PollutionMobile Air Pollution
Mobile Air Pollution
 
1.-Air-Quality-and-Air-Pollution_24Sep2020.pptx
1.-Air-Quality-and-Air-Pollution_24Sep2020.pptx1.-Air-Quality-and-Air-Pollution_24Sep2020.pptx
1.-Air-Quality-and-Air-Pollution_24Sep2020.pptx
 

Recently uploaded

Hierarchical Digital Twin of a Naval Power System
Hierarchical Digital Twin of a Naval Power SystemHierarchical Digital Twin of a Naval Power System
Hierarchical Digital Twin of a Naval Power System
Kerry Sado
 
digital fundamental by Thomas L.floydl.pdf
digital fundamental by Thomas L.floydl.pdfdigital fundamental by Thomas L.floydl.pdf
digital fundamental by Thomas L.floydl.pdf
drwaing
 
Heap Sort (SS).ppt FOR ENGINEERING GRADUATES, BCA, MCA, MTECH, BSC STUDENTS
Heap Sort (SS).ppt FOR ENGINEERING GRADUATES, BCA, MCA, MTECH, BSC STUDENTSHeap Sort (SS).ppt FOR ENGINEERING GRADUATES, BCA, MCA, MTECH, BSC STUDENTS
Heap Sort (SS).ppt FOR ENGINEERING GRADUATES, BCA, MCA, MTECH, BSC STUDENTS
Soumen Santra
 
Unbalanced Three Phase Systems and circuits.pptx
Unbalanced Three Phase Systems and circuits.pptxUnbalanced Three Phase Systems and circuits.pptx
Unbalanced Three Phase Systems and circuits.pptx
ChristineTorrepenida1
 
ACEP Magazine edition 4th launched on 05.06.2024
ACEP Magazine edition 4th launched on 05.06.2024ACEP Magazine edition 4th launched on 05.06.2024
ACEP Magazine edition 4th launched on 05.06.2024
Rahul
 
Building Electrical System Design & Installation
Building Electrical System Design & InstallationBuilding Electrical System Design & Installation
Building Electrical System Design & Installation
symbo111
 
sieving analysis and results interpretation
sieving analysis and results interpretationsieving analysis and results interpretation
sieving analysis and results interpretation
ssuser36d3051
 
Exception Handling notes in java exception
Exception Handling notes in java exceptionException Handling notes in java exception
Exception Handling notes in java exception
Ratnakar Mikkili
 
Advanced control scheme of doubly fed induction generator for wind turbine us...
Advanced control scheme of doubly fed induction generator for wind turbine us...Advanced control scheme of doubly fed induction generator for wind turbine us...
Advanced control scheme of doubly fed induction generator for wind turbine us...
IJECEIAES
 
This is my Environmental physics presentation
This is my Environmental physics presentationThis is my Environmental physics presentation
This is my Environmental physics presentation
ZainabHashmi17
 
DEEP LEARNING FOR SMART GRID INTRUSION DETECTION: A HYBRID CNN-LSTM-BASED MODEL
DEEP LEARNING FOR SMART GRID INTRUSION DETECTION: A HYBRID CNN-LSTM-BASED MODELDEEP LEARNING FOR SMART GRID INTRUSION DETECTION: A HYBRID CNN-LSTM-BASED MODEL
DEEP LEARNING FOR SMART GRID INTRUSION DETECTION: A HYBRID CNN-LSTM-BASED MODEL
gerogepatton
 
Understanding Inductive Bias in Machine Learning
Understanding Inductive Bias in Machine LearningUnderstanding Inductive Bias in Machine Learning
Understanding Inductive Bias in Machine Learning
SUTEJAS
 
一比一原版(UC Berkeley毕业证)加利福尼亚大学|伯克利分校毕业证成绩单专业办理
一比一原版(UC Berkeley毕业证)加利福尼亚大学|伯克利分校毕业证成绩单专业办理一比一原版(UC Berkeley毕业证)加利福尼亚大学|伯克利分校毕业证成绩单专业办理
一比一原版(UC Berkeley毕业证)加利福尼亚大学|伯克利分校毕业证成绩单专业办理
skuxot
 
DfMAy 2024 - key insights and contributions
DfMAy 2024 - key insights and contributionsDfMAy 2024 - key insights and contributions
DfMAy 2024 - key insights and contributions
gestioneergodomus
 
CHINA’S GEO-ECONOMIC OUTREACH IN CENTRAL ASIAN COUNTRIES AND FUTURE PROSPECT
CHINA’S GEO-ECONOMIC OUTREACH IN CENTRAL ASIAN COUNTRIES AND FUTURE PROSPECTCHINA’S GEO-ECONOMIC OUTREACH IN CENTRAL ASIAN COUNTRIES AND FUTURE PROSPECT
CHINA’S GEO-ECONOMIC OUTREACH IN CENTRAL ASIAN COUNTRIES AND FUTURE PROSPECT
jpsjournal1
 
22CYT12-Unit-V-E Waste and its Management.ppt
22CYT12-Unit-V-E Waste and its Management.ppt22CYT12-Unit-V-E Waste and its Management.ppt
22CYT12-Unit-V-E Waste and its Management.ppt
KrishnaveniKrishnara1
 
spirit beverages ppt without graphics.pptx
spirit beverages ppt without graphics.pptxspirit beverages ppt without graphics.pptx
spirit beverages ppt without graphics.pptx
Madan Karki
 
Design and Analysis of Algorithms-DP,Backtracking,Graphs,B&B
Design and Analysis of Algorithms-DP,Backtracking,Graphs,B&BDesign and Analysis of Algorithms-DP,Backtracking,Graphs,B&B
Design and Analysis of Algorithms-DP,Backtracking,Graphs,B&B
Sreedhar Chowdam
 
basic-wireline-operations-course-mahmoud-f-radwan.pdf
basic-wireline-operations-course-mahmoud-f-radwan.pdfbasic-wireline-operations-course-mahmoud-f-radwan.pdf
basic-wireline-operations-course-mahmoud-f-radwan.pdf
NidhalKahouli2
 
在线办理(ANU毕业证书)澳洲国立大学毕业证录取通知书一模一样
在线办理(ANU毕业证书)澳洲国立大学毕业证录取通知书一模一样在线办理(ANU毕业证书)澳洲国立大学毕业证录取通知书一模一样
在线办理(ANU毕业证书)澳洲国立大学毕业证录取通知书一模一样
obonagu
 

Recently uploaded (20)

Hierarchical Digital Twin of a Naval Power System
Hierarchical Digital Twin of a Naval Power SystemHierarchical Digital Twin of a Naval Power System
Hierarchical Digital Twin of a Naval Power System
 
digital fundamental by Thomas L.floydl.pdf
digital fundamental by Thomas L.floydl.pdfdigital fundamental by Thomas L.floydl.pdf
digital fundamental by Thomas L.floydl.pdf
 
Heap Sort (SS).ppt FOR ENGINEERING GRADUATES, BCA, MCA, MTECH, BSC STUDENTS
Heap Sort (SS).ppt FOR ENGINEERING GRADUATES, BCA, MCA, MTECH, BSC STUDENTSHeap Sort (SS).ppt FOR ENGINEERING GRADUATES, BCA, MCA, MTECH, BSC STUDENTS
Heap Sort (SS).ppt FOR ENGINEERING GRADUATES, BCA, MCA, MTECH, BSC STUDENTS
 
Unbalanced Three Phase Systems and circuits.pptx
Unbalanced Three Phase Systems and circuits.pptxUnbalanced Three Phase Systems and circuits.pptx
Unbalanced Three Phase Systems and circuits.pptx
 
ACEP Magazine edition 4th launched on 05.06.2024
ACEP Magazine edition 4th launched on 05.06.2024ACEP Magazine edition 4th launched on 05.06.2024
ACEP Magazine edition 4th launched on 05.06.2024
 
Building Electrical System Design & Installation
Building Electrical System Design & InstallationBuilding Electrical System Design & Installation
Building Electrical System Design & Installation
 
sieving analysis and results interpretation
sieving analysis and results interpretationsieving analysis and results interpretation
sieving analysis and results interpretation
 
Exception Handling notes in java exception
Exception Handling notes in java exceptionException Handling notes in java exception
Exception Handling notes in java exception
 
Advanced control scheme of doubly fed induction generator for wind turbine us...
Advanced control scheme of doubly fed induction generator for wind turbine us...Advanced control scheme of doubly fed induction generator for wind turbine us...
Advanced control scheme of doubly fed induction generator for wind turbine us...
 
This is my Environmental physics presentation
This is my Environmental physics presentationThis is my Environmental physics presentation
This is my Environmental physics presentation
 
DEEP LEARNING FOR SMART GRID INTRUSION DETECTION: A HYBRID CNN-LSTM-BASED MODEL
DEEP LEARNING FOR SMART GRID INTRUSION DETECTION: A HYBRID CNN-LSTM-BASED MODELDEEP LEARNING FOR SMART GRID INTRUSION DETECTION: A HYBRID CNN-LSTM-BASED MODEL
DEEP LEARNING FOR SMART GRID INTRUSION DETECTION: A HYBRID CNN-LSTM-BASED MODEL
 
Understanding Inductive Bias in Machine Learning
Understanding Inductive Bias in Machine LearningUnderstanding Inductive Bias in Machine Learning
Understanding Inductive Bias in Machine Learning
 
一比一原版(UC Berkeley毕业证)加利福尼亚大学|伯克利分校毕业证成绩单专业办理
一比一原版(UC Berkeley毕业证)加利福尼亚大学|伯克利分校毕业证成绩单专业办理一比一原版(UC Berkeley毕业证)加利福尼亚大学|伯克利分校毕业证成绩单专业办理
一比一原版(UC Berkeley毕业证)加利福尼亚大学|伯克利分校毕业证成绩单专业办理
 
DfMAy 2024 - key insights and contributions
DfMAy 2024 - key insights and contributionsDfMAy 2024 - key insights and contributions
DfMAy 2024 - key insights and contributions
 
CHINA’S GEO-ECONOMIC OUTREACH IN CENTRAL ASIAN COUNTRIES AND FUTURE PROSPECT
CHINA’S GEO-ECONOMIC OUTREACH IN CENTRAL ASIAN COUNTRIES AND FUTURE PROSPECTCHINA’S GEO-ECONOMIC OUTREACH IN CENTRAL ASIAN COUNTRIES AND FUTURE PROSPECT
CHINA’S GEO-ECONOMIC OUTREACH IN CENTRAL ASIAN COUNTRIES AND FUTURE PROSPECT
 
22CYT12-Unit-V-E Waste and its Management.ppt
22CYT12-Unit-V-E Waste and its Management.ppt22CYT12-Unit-V-E Waste and its Management.ppt
22CYT12-Unit-V-E Waste and its Management.ppt
 
spirit beverages ppt without graphics.pptx
spirit beverages ppt without graphics.pptxspirit beverages ppt without graphics.pptx
spirit beverages ppt without graphics.pptx
 
Design and Analysis of Algorithms-DP,Backtracking,Graphs,B&B
Design and Analysis of Algorithms-DP,Backtracking,Graphs,B&BDesign and Analysis of Algorithms-DP,Backtracking,Graphs,B&B
Design and Analysis of Algorithms-DP,Backtracking,Graphs,B&B
 
basic-wireline-operations-course-mahmoud-f-radwan.pdf
basic-wireline-operations-course-mahmoud-f-radwan.pdfbasic-wireline-operations-course-mahmoud-f-radwan.pdf
basic-wireline-operations-course-mahmoud-f-radwan.pdf
 
在线办理(ANU毕业证书)澳洲国立大学毕业证录取通知书一模一样
在线办理(ANU毕业证书)澳洲国立大学毕业证录取通知书一模一样在线办理(ANU毕业证书)澳洲国立大学毕业证录取通知书一模一样
在线办理(ANU毕业证书)澳洲国立大学毕业证录取通知书一模一样
 

01-Introduction to Air Pollution Control.ppt

  • 1. 1 Introduction to Air Pollution Control 朱信 Hsin Chu Professor Dept. of Environmental Engineering National Cheng Kung University
  • 2. 2 1. Some of the History of Air Pollution Control in the United States of America  Although air pollution control actions go back at least as far as the thirteenth century, most of the major effort in the world has taken place since 1945.  In the 1930s and 1940s, a factory smokestack issuing a thick plume of smoke was considered a sign of prosperity.
  • 3. 3  Before 1945, industrial air pollution control efforts were directed at controlling large-factory emissions of pollutants that had led to conflict with neighbors of the factories.  Much of this did not involve governmental action, but rather was a response to nuisance damage suits or the threat of such suits.
  • 4. 4  Between 1945 and 1969, as awareness of air pollution problems gradually increased, some worthwhile local efforts to control air pollution were initiated, notably in Pittsburgh, Los Angeles, and St. Louis.  Between 1963 and 1967 the federal government began to oversee and coordinate local and state air pollution control efforts.
  • 5. 5  In 1969 and 1970, the United States experienced a great environmental awakening.  Environmental matters were scarely mentioned in newspapers in 1968, but the same newspapers had an environmental story every day in 1970.
  • 6. 6  This period saw the passage of the National Environmental Policy Act and the Clean Air Act of 1970, both of which have had sweeping effects and have greatly changed american way of dealing with air pollution.  Similar changes took place throughout the industrial world at about the same time, with similar effects.
  • 7. 7  At first the leaders of the older “smokestack” industries (steel, copper, some electric power) fought the new regulations, in the courts, in the press, and in congress.  Twenty-five years later their successors mostly have decided that the air pollution regulations are here to stay and that their goals should be to influence the regulatory process to make the regulations as clear and practical as possible and then to comply with the regulations in as efficient and economical a way as possible.
  • 8. 8  In the late 1980s, a new theme entered the air pollution arena: global air pollution.  In the 1980s, three problems emerged involving longer-lived pollutants and pollutants that are transported a long way before they do their damage: acid rain destruction of the ozone layer by chlorofluorocarbons buildup of carbon dioxide in the atmosphere
  • 9. 9  The legal and administrative structure developed in the 1970s to deal with local air pollution problems seems useless to deal with these international or global problems.  The developing countries responded later than the US, and used a mixture of the ideas combined from the US and the World Health Organization, which seek similar goals by somewhat different means.
  • 10. 10 2. Why the Sudden Rise in Interest in 1969-1970?  Environmental concern is often considered a luxury only wealthy nations can afford, and the US had become very wealthy.  To a person whose basic physical needs are satisfied, air pollution can be a much greater cause for concern.
  • 11. 11  Furthermore, as we have learned to prevent or treat infectious disease such as influenza, tuberculosis, etc., we have doubled our average life span.  Therefore, we survive long enough to die of long- term diseases such as arteriosclerosis, heart malfunctions, stroke, emphysema, and cancer, all of which are related to environmental factors, including air pollution.
  • 12. 12 3. Dirty Air Removal or Emission Control?  Example 1 The area of the Los Angeles basin is 4,083 square miles. The heavily polluted air layer is assumed to be 2,000 ft thick on average. One solution to Los Angeles’ problems would be to pump this contaminated air away.
  • 13. 13  Suppose that we wish to pump out the Los Angeles basin every day and that the air must be pumped 50 miles to the desert near palm springs.  Assume also that the average velocity in the pipe is 40 ft/s. Estimate the required pipe diameter.
  • 14. 14  Solution: The flow rate required is  The required pipe diameter is 2 2 3 9 7 3 4,083 2,000 (5,280 / ) 24 3,600 / 2.63 10 7.47 10 / AH mi ft ft mi Q t h s h ft m s s        9 4 4 2.63 10 / 40 / 9,158 2,791 Q ft s ft s D ft m         
  • 15. 15  This is about six times the height of the tallest man- made structure, and far beyond our current structural engineering capabilities.  Therefore, we are unlikely to solve our air pollution problems by pumping away the polluted air.  Instead, we must deal with those problems by reducing emissions, the principal subject of the rest of this course.
  • 16. 16 4. One Problem or a Family of Problems?  Next slide (Table 1.1) Emissions estimates for the major man-made pollutants for the US in 1997.
  • 17. TABLE 1.1 National emissions estimates for 1997 (Values in millions of short tons/yr) Source category PM10 SO2 CO NOX VOC Pb Transportation 0.7 1.4 67.0 11.6 7.7 0.00052 Fuel combustion 1.1 17.3 4.8 10.7 0.9 0.00050 Industrial processes 1.3 1.7 6.1 0.9 9.8 0.0029 Miscellaneous – 0.0 9.6 0.3 0.8 – Total 3.1 20.4 87.5 23.5 19.2 0.0039 Percentage of 1970 total – 65% 78% 116% 70% 1.7%
  • 18. 18  The public thinks in terms of “general air pollution” and wonders if the problem is mostly industry (them) or autos (us).  Engineers recognize that there is not “one” air pollution problem but a group of related problems.
  • 19. 19  From 1970 to 1997, the US has made significant progress in reducing emissions of lead (mostly by taking lead out of gasoline) and modest progress in reducing emissions of the other major pollutants.  The air pollutant emissions situation can be roughly approximated by:   Air pollutant economic activity pollutant emissions population emissions per person per unit of economic activity                   
  • 20. 20  Since the environmental awakening of 1969-1970, the population of the US has increased by about 30%, the economic activity per person by about 80%, and the motor vehicle usage by about a factor of 4.  However, the pollutant emissions per unit of economic activity have declined steadily because of stringent programs of emission control.
  • 21. 21  Thus, in most of the US, the emissions and hence the measured concentrations of most pollutants in the atmosphere declined steadily between 1970 and 1997.  There are exceptions to this decline, e.g., increases in acid rain in the northeastern United States.
  • 22. 22 5. Emissions, Transport, Receptors  Next slide (Fig. 1.1) A schematic of the air pollution process.
  • 23.
  • 24. 24  In Fig. 1.1 we see a major reason why air pollution is different from water pollution or industrial hygiene.  If the same figure were drawn for water pollution, the atmospheric transport box would be replaced by a box for groundwater or stream transport.  Those mechanisms are indeed complex, but not nearly as complex as atmospheric transport.
  • 25. 25  We would also see that the chemical or biological form in which most water pollutants are emitted is the one that causes harmful effects.  The same is not true of air pollution: many of the major pollutants are formed in the atmosphere and are called secondary pollutants to distinguish them from their precursors, the primary pollutants.
  • 26. 26  Next slide (Fig. 1.2) Smoothed average concentrations of four major air pollutants for one day in Los Angeles.  CO and NO are primary pollutants, emitted mostly by automobiles, their peak concentrations occur during the morning commute period.  NO2 and O3 are secondary pollutants formed in the atmosphere by a complex set of reactions, summarized as: NO + HC + O2 + sunlight → NO2 + O3 (1)
  • 27.
  • 28. 28  The peak concentration of NO2 occurs before the peak for O3 because the reaction sequence forms NO2 first, then O3.  The CO concentration peak does not decline as rapidly as the NO peak because the CO concentration is reduced only by atmospheric mixing and dilution whereas the NO concentration is reduced by dilution and mixing and by the chemical reaction in Eq. (1).
  • 29. 29  The afternoon commute also produces increases in NO and CO, but the measured concentrations are not as large as the morning peaks because the average wind speed is higher and the atmospheric mixing is stronger in the afternoon than in the morning.  It has also been observed that the highest peak O3 concentration normally occurs about 30 to 60 miles downwind of the place that had the maximum morning emission of NO and HC because the polluted air mass can ride the wind that far in a day.
  • 30. 30  The two pollutants of greatest current health concern are both secondary: ozone, as described above, and fine particles.  The very small particles that enter most deeply into out lungs and that are believed to be most harmful are largely formed in the atmosphere by reactions that can be summarized as: HC + SOX +NOX → fine particles
  • 31. 31 6. Units and Standards  In this course, both English and SI (cgs) units are used.  A concentration expressed in parts per million (ppm) is almost always ppm by volume or by mol if it is concentration in a gas, and ppm by mass or weight if it is concentration in a liquid or solid.
  • 32. 32  When standard conditions for a gas are referred to, there seems to be only one choice for pressure, the standard atmosphere.  Unfortunately, there is no comparable agreement as to which temperature should be used. Vaues of 0℃, 18℃, 20℃ and 25℃ are used.  Throughout this course, unless stated otherwise, air and process gases are assumed to be at 1 standard atmosphere and 20℃ (= 68oF)