Download to read offline
![FUW Trends in Science & Technology Journal, www.ftstjournal.com
e-ISSN: 24085162; p-ISSN: 20485170; April, 2017: Vol. 2 No. 1B pp 334 – 341
334
CHEMICAL COMPOSITION OF THE RAW FRUIT COAT, SEED AND
PULP OF PASSION FRUIT (Passiflora edulis)
Emmanuel Ilesanmi Adeyeye1
* and Matthew Olaleke Aremu2
1
Department of Chemistry (Analytical Unit), Ekiti State University, PMB 5363, Ado – Ekiti, Nigeria
2
Department of Chemical Sciences, Federal University Wukari, PMB 1020, Taraba State, Nigeria
*Corresponding author: eiadeyeye@yahoo.com; adeyeyeilesanmi2012@gmail.com
Received: January 17, 2017 Accepted: March 26, 2017
Abstract: This study determined the chemical composition of the various parts of the Passiflora edulis fruit. The various
parts were separated and analyzed for –chemical composition and antinutrient contents. Calculated were mineral
safety index (MSI) and mineral ratios of some minerals; regression analyses in mineral and proximate values
between seed/juice and between inner coat/outer coat; the contribution of energy due to fat, carbohydrate and
protein to the total energy. The results showed that the most concentrated values were seen as follows: ash (seed),
moisture (juice), protein (seed), fat (outer coat), fibre (seed), carbohydrate (seed) juice (vitamin C) and outer coat
(vitamin A). Highest total energy was contributed by the seed and the least by the juice. The followings were
observed as the most concentrated values: Na (outer coat), K (seed), Ca (seed), Mg (seed), Zn (outer coat), Fe
(outer coat), Cu (seed), Mn (outer coat), Co (juice) and P (seed). No mineral met the ideal ratio as they were either
too low or too high from the ideal. No mineral had deleterious value in the MSI. All the sugar were of low levels
except maltose was greater than 1.0 in the inner coat. The rc were greater than rr in proximate composition (only in
inner coat/outer coat), (both in seed/juice and inner coat/outer coat) but rr were less than rr (seed/juice only) and in
sugar content (inner coat/outer coat).
Keywords: Analysis, composition, morphology, nutrition, Passiflora edulis
Introduction
Of the estimated 500 cultivars of Passiflora, in the family
Passifloraceae only one, P. edulis Sims, has the exclusive
designation of passion fruit, without qualification. [The
passion fruit is so called because it is one of the species of
passion flower, leading to the English translation of the Latin
genus name, Passiflora (Morton, 1987).] Within this specie,
there are two distinct forms, the standard purple, and the
yellow (Golden Passion Fruit), distinguished as P. edulis, f.
flavicarpa Deg., and differing not only in colour but in certain
other features. General names for both in Spanish are
granadilla, parcha, parchita maracuyá, or ceibey (Cuba); in
Portuguese, maracujáperoba; in French, grenadille, or
couzou. The purple form may be called purple, red, or black
granadilla, or, in Hawaii, lilikói; in Jamaica, mountain sweet
cup; in Thailand, linmangkon. The yellow form is widely
known as yellow passion fruit, is called yellow lilikoi in
Hawaii; golden passion fruit in Australia; parcha amarilla in
Venezuela. Purple passion fruit (Passiflora edulis) is
subtropical, important in some countries, while the more
tropical yellow passion fruit excels in others. Both yield
delicious juice (Morton, 1987). Some think the yellow is a
chance mutant that occurred in Australia. However, P. edulis
in its natural range is having purple or yellow fruits. Brazil
has long had a well-established passion fruit industry with
large-scale juice extraction plants. The purple passion fruit is
there preferred for consuming fresh; the yellow for juice
processing and the making of preserves. The passion fruit
name was given by Spanish missionaries to South America as
an expository aid while trying to convert the indigenous
inhabitants to Christianity (Morton, 1987).
The fruit is reported to be delicious, rich source of
antioxidants, minerals, vitamins and fibre (Morton, 1987).
The objective of this study was to determine the chemical
composition of the anatomical parts of passion fruit (seed,
juice, inner coat and outer coat). The antinutrients and sugar
contents the various parts of passion fruits were also
determined. The information would improve the existing
information on the food composition table of Passiflora edulis
F. flavicarpa Deg.
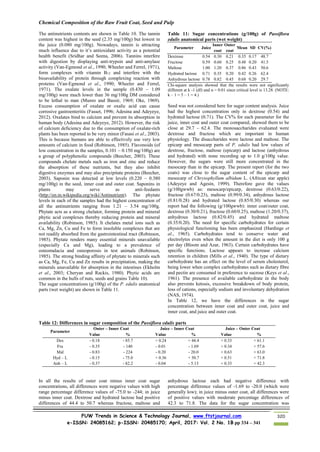
Materials and Methods
Collection of samples
Samples were collected from Ado – Ekiti in Ekiti State,
Nigeria. The fruits were washed with distilled water to
remove any adhering contaminant and then drained through
folded filter paper. The samples were identified in the
laboratory and preserved in the refrigerator prior to analysis
within two days.
Sample treatment
In the laboratory, the passion fruits (three in number) were
dissected and the pulp (juice), seeds, the outer and inner coats
(epicarp and endocarp) were separated. The coats were
separated ground in mortar with pestle. The seeds were treated
in similar way.
Sample digestion
Samples that ranged from 0.2278 to 0.9720 g were weighed
accurately prior to digestion. Two millilitres of concentrated
nitric acid was added to each sample in a beaker, covered with
watch glass and allowed to stand overnight in a fume
cupboard. The beakers were heated gently on a hot plate until
frothing stopped and no visible solid material was observed.
Heating was continued at 75o
C to near dryness. The digests
were removed and covered with glasses. Two millilitres of 50
gl-1
lanthanum chloride solution was added and the beakers
were heated for the second time until dryness. Each of the
final solutions was washed into a 25 ml standard flask with
0.1M HNO3 (10 ml) and made up to the mark with distilled
de-ionised water (Varian Techtron, 1975; Harper et al., 1989).
All the digested samples were sub-sampled into pre-cleaned
borosilicate glass containers for mineral analysis using atomic
absorption spectrophotometer.
Sample analysis
Moisture, total ash, fibre and ether extract of the samples were
determined by the methods of the AOAC (2006) Nitrogen was
determined by micro-Kjeldahl method (Pearson, 1976) and
the crude protein content was calculated as N x 6.25.
Standards of Na, K, Ca, Mg, Zn, Fe, Cu, Mn, Pb and Co
solutions of 0.2, 0.4, 0.6, 0.8 and 1.0 mgl-1
were prepared
from each of the metal solutions of 1000 mgl-1
stock
solutions. The filtrates of the digested samples were analysed
by Atomic Absorption Spectrophotometer (AAS). The
detection limit of the metals in the sample was 0.0001 mgl-1
by means of the UNICAM 929, London, atomic absorption
spectrophotometer powered by the solar software. The
Supported by](https://image.slidesharecdn.com/adeyeyeandaremu-210403210308/85/Adeyeyeand-aremu-2-320.jpg)
![Chemical Composition of the Raw Fruit Coat, Seed and Pulp
FUW Trends in Science & Technology Journal, www.ftstjournal.com
e-ISSN: 24085162; p-ISSN: 20485170; April, 2017: Vol. 2 No. 1B pp 334 – 341
338
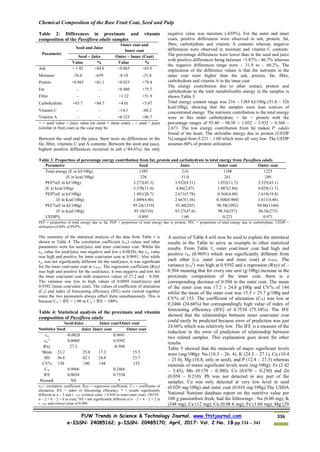
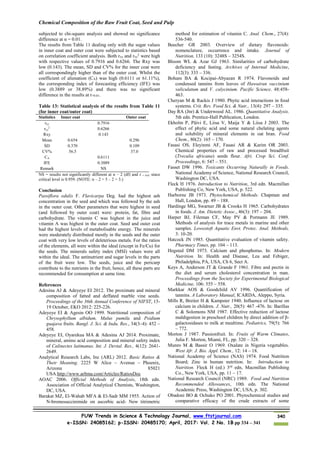
Table 8: Calculated mineral ratios inP. edulis
Parameter Ideal Seed Juice Inner coat Outer coat
Ca/Mg 7.00 1.95 14.2 51.4 11.8
Na/K 2.40 0.896 0.915 0.683 1.09
Ca/K 4.20 0.774 0.422 0.404 0.461
Na/Mg 4.00 2.26 30.9 86.9 27.8
Zn/Cu 8.00 5.50 - - 21.0
Ca/P 2.60 0.769 0.392 0.700 0.908
Fe/Cu 0.90 122 - - 345
Ca/Pb 84.0 - - - -
Fe/Pb 4.40 - - - -
Zn/Cd 500 - - - -
[K(Ca + Mg)] 2.20 1.71 4.43 4.85 4.00
The various calculated mineral ratios are depicted in Table 8.
Three categories of results were obtained. These were those
without ratio values because of incomplete data for ratio
calculation, those ratios lower than the ideal and those ratios
greater than the ideal. Mineral ratios without values were Ca/Pb,
Fe/Pb (Pb was not detected) and Zn/Cd (Cd was not determined).
The following ratios were less than the ideal ratios: Ca/P [ideal
(id) = 2.60, values = 0.392 – 0.908], Zn/Cu [id = 8.00, value =
5.50 in seed], Ca/K [id = 4.20, values = 0.404 – 0.774] and Na/K
[id = 2.40, values = 0.683 – 1.09]. Others in this category were
Ca/Mg [id = 7.00, value of 1.95 only in seed], Na/Mg [id = 4.00,
value of 2.26 only in seed] and [K(Ca + Mg)] [id = 2.20, value of
1.71 only in seed]. Ratio values greater than the ideal were Ca/Mg
(juice, inner coat and outer coat), Na/Mg (juice, inner coat and
outer coat), Zn/Cu (outer coat only), Fe/Cu (seed and outer coat)
and finally in [K(Ca + Mg)] (juice, inner coat and outer coat).
Balance in all phases of life is critically important to maintain
health. A mineral ratio is a pure number consisting of one mineral
level divided by a second mineral level. Mineral ratios are often
more important in determining nutritional deficiencies and
excesses than mineral levels alone, although both are important
and should be considered together. The importance of ratios had
been enumerated (ARL, 2012). Ratios are often more important
than levels; ratios represent homeostatic balances; ratios are
indicative of disease trends; ratios are frequently predictive of
future metabolic dysfunction or hidden metabolic dysfunctions
(Watts, 2010). Calcium and magnesium should always be in a
proper balance to one another. If this normal equilibrium is upset,
one mineral will become dominant relative to the other. In this
case, calcium was high relative to magnesium (see high Ca/Mg
ratio), which may be indicative of abnormal calcium metabolism,
this will lead to increased need for magnesium in the diet. The
mineral calcium antagonizes the retention of potassium within the
cell. Since potassium is necessary in sufficient quantity to
sensitize the tissues to the effects of thyroid hormones, a high
Ca/K ratio would suggest reduced thyroid function and/or cellular
response to thyroxine (Watts, 2010). The Ca/K ratios in this study
were low. Phosphorus is involved in all of the cellular energy
production cycles within the body. Adequate protein intake is
essential in providing needed phosphorus for increased energy
production, and reducing excess tissue calcium retention (see low
Ca/P ratio). The ratio of Na/Mg was below the normal range only
in the seed. The adrenal glands play an essential role in regulating
sodium retention and excretion. The sodium-magnesium profile is
indicative of reduced adrenal cortical function only in the seed but
not in the three subunits. Zinc and copper are intricately related to
the hormones, progesterone and estrogens, respectively. When
zinc and copper are not in normal balance with one another,
certain emotional and physical changes related to hormonal
imbalance may occur near the menstrual cycles, such as excessive
cramping, emotional mood swings, food cravings, water retention
skin, skin rashes and viral infections
(http://www.spectrumhealth.biz/hairanalysis/samplereport/minera
l ra...). The milliequivalent ratio [K/(Ca+Mg)] was less than 2.2
only in the seed (1.71). This value will not promote
hypomagnesaemia in man (NRC, 1989). The toxic minerals ratios
in samples were Ca/Pb and Fe/Pb. However, no ratio results were
observed for them because Pb was not detected.
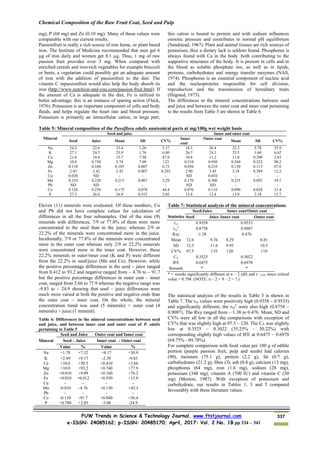
The mineral safety index (MSI) values of Na, Mg, P, Ca, Fe,
Zn and Cu of P. edulis are shown in Table 9.
The standard mineral safety index values for the elements are
Na (4.8), Mg (15), P (10), Ca (10), Fe (6.7), Zn (33) and Cu
(33) (Hathcock, 1985). The explanation of the MSI can be
understood as follows taking Ca as example: the
recommended adult intake (RAI) of Ca is 1,200 mg; its
minimum toxic dose (MTD) is 12,000 mg or 10 times the
recommended daily average (RDA) which is equivalent to
MSI of Ca (Hathcock, 1985). This explanation goes for the
other minerals whose MSI were determined. All the minerals
have their table value (TV) > calculated value (CV) giving
positive differences with corresponding low percentage
differences. The TV > CV had been observed in Fe, Cu, Zn,
Na, Mg, P and Ca in two types of Lagos lagoon fish
(Acanthurus monroviae and Lutjanus goreensis) (Adeyeye et
al., 2014). The MSI values gave an indication that none of the
minerals was high enough to the deleterious levels when
consumed in P. edulis.
Table 9: Mineral safety index (MSI) of Na, Mg, P, Ca, Fe, Zn and Cu in P. edulis
Mineral RAI (mg) TV of MSI
Calculated CV values
Seed Juice Inner coat Outer coat
Na 500 4.8 0.234 0.217 0.175 0.254
Mg 400 15 0.403 0.027 0.008 0.036
P 1200 10 0.227 0.220 0.128 0.103
Ca 1200 10 0.174 0.086 0.090 0.093
Fe 15 6.7 1.08 1.08 1.30 1.54
Zn 15 33 0.242 0.220 0.110 0.462
Cu 3 33 0.220 - - 0.110
RAI = recommended adult intake; CV = calculated MSI value; TV = Table (standard) MSI value. No MSI standard for K, Mn, Co and Pb.
Table 10: Antinutrients composition of P. edulis anatomical parts (wet weight basis)
Parameter
Seed and Juice Inner and outer coat
Seed Juice Mean SD CV(%) Inner coat Outer coat Mean SD CV(%)
Tannin (mg/100g) 2.35 0.080 1.22 1.61 132 0.650 1.33 0.990 0.481 48.6
Polyphenol (mg/100g) 1.21 0.050 0.630 0.820 130 0.550 1.23 0.890 0.481 54.0
Phytate (mg/100g) 3.54 1.21 2.38 1.65 69.4 2.10 2.57 2.34 0.332 14.2
Oxalate (mg/100g) 1.07 0.430 0.750 0.453 60.3 0.670 1.09 0.880 0.297 33.7
Saponin (g/100g) 0.380 ND - - - 0.220 0.270 0.245 0.035 14.4
Alkaloids (g/100g) 0.240 ND - - - 0.100 0.220 0.160 0.085 53.0
Flavonoid (g/100g) 0.150 0.010 0.080 0.099 124 0.020 0.040 0.030 0.014 47.1
No evidence of statistical analysis that could show differences](https://image.slidesharecdn.com/adeyeyeandaremu-210403210308/85/Adeyeyeand-aremu-6-320.jpg)

This document analyzes the chemical composition of different parts of the passion fruit (Passiflora edulis), including the seed, pulp (juice), inner coat, and outer coat. Key findings include: - The seed had the highest ash, protein, fat, fiber, and carbohydrate content as well as total energy. The juice had the highest moisture and vitamin C content. - Minerals such as sodium, potassium, calcium, magnesium, zinc, iron, copper, and manganese were most concentrated in different parts. No mineral ratios met ideal levels. - Sugars like maltose were above 1.0 in the inner coat, while others were low. Correlation analyses found


