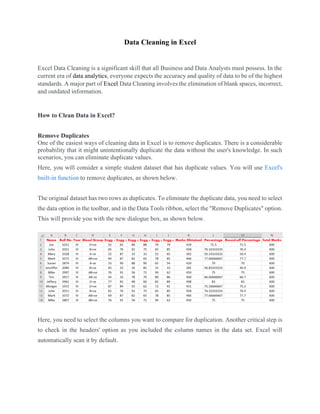
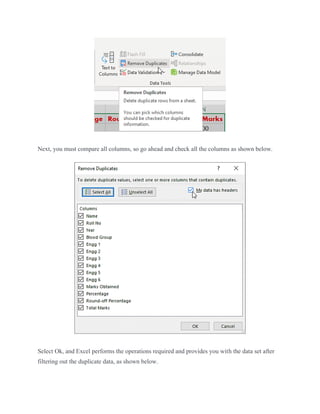
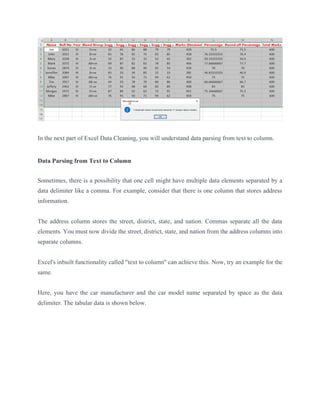
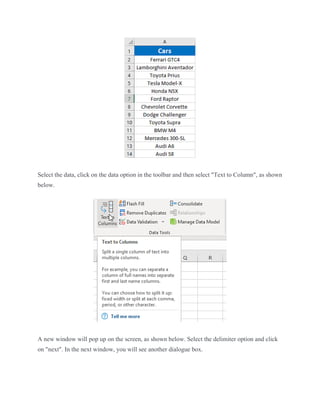
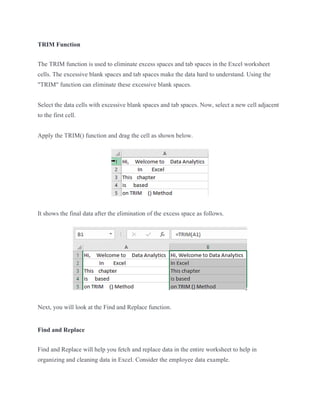
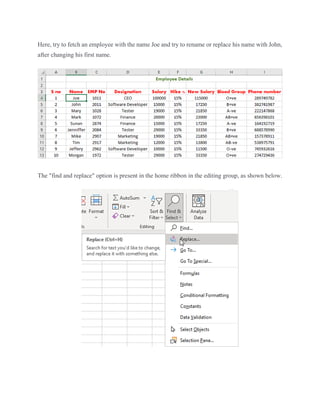
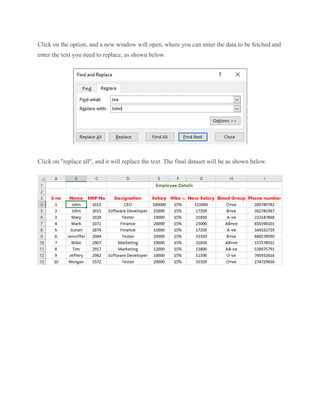
to perform 3 tasks that will generate 3 data sets, which are as follows: (a) Dataset 1: Student data; (b) Dataset 2: Car data; and (c) Dataset 3: Employee's details. Explore and simulate the built-in functions of a spreadsheet app for data cleaning.
This document provides an introduction and overview of spreadsheets and Microsoft Excel. It defines what a spreadsheet is, outlines key features and elements of Excel including cells, worksheets, formatting, formulas, functions, charts and pivot tables. It also describes various data analysis tools in Excel like sorting, filtering, conditional formatting, and how to perform tasks like what-if analysis using goal seek and scenario manager. The document is intended as a reference for using spreadsheets, especially Microsoft Excel, in a business context.
Microsoft Excel allows users to organize data into spreadsheets. It contains workbooks with multiple worksheets made of cells organized into rows and columns. Excel provides functions to perform calculations and analyze data. Users can format worksheets, insert charts and images, and print selections of cells or entire worksheets. Formulas using built-in functions can easily calculate and manipulate data in Excel.
This document provides an introduction to Microsoft Excel by covering the Excel interface, opening and saving worksheets, entering and editing data, building formulas and functions, and formatting and printing data. It explores the components of the Excel window including the standard toolbar, formatting toolbar, formula bar, name box, row and column headings, active cell, and fill handle. It also describes how to enter and edit data, move around the worksheet, copy and move data, and work with Excel documents by opening, saving, and creating new workbooks.
This document provides an overview of using Microsoft Excel to handle, graph, and analyze scientific data. It begins with basics of the Excel interface and entering data. It then demonstrates how to manipulate data through calculations, format cells, and use functions. The document shows how to create scatter plots and add regression lines to graphs. It also discusses interpolation, extrapolation, printing graphs, downloading internet data, and more advanced statistical analyses in Excel.
This document provides instructions for using Excel to calculate cash flow projections using a data list. It explains how to create a data list, add and delete rows, and use the OFFSET function to calculate a running balance that does not break when rows are deleted. The OFFSET function references cells indirectly, allowing the formula to still work correctly when the worksheet structure changes from deleted rows.
This document provides information about advanced Excel skills training. It discusses topics that will be covered including advanced formulas, tables and formatting, conditional formatting, charting, pivot tables, VBA macros, productivity tools like data tables and Solver, consolidating workbooks, fetching web data, and using Excel as a database. It also outlines lessons on basic formulas, advanced formulas, filling series automatically, and creating conditional formatting rules. The goal is to fuel participants' futures by teaching them how to use Excel's advanced features productively.
Excel 2013 is a spreadsheet program that allows users to store, organize, and analyze data. It features tools like formulas, functions, charts and pivot tables. In Excel, data is organized into cells within a worksheet. Cells can contain text, numbers, formulas or other content. Worksheets can be viewed and formatted in different layout views. Formatting options and functions allow for analysis of data through calculations and visualization. Pivot tables and charts provide interactive summaries and visual representations of worksheet data. Macros allow repetitive tasks to be automated. Advanced features include comments, filtering, sorting, tables and other analysis tools.
This document provides an overview of Microsoft Excel. It discusses that Excel is a spreadsheet application used to organize data into tables and perform calculations. Key points covered include:
- Excel uses a grid of rows and columns to display data in worksheets.
- Common tasks in Excel include entering data, formatting cells, adjusting worksheet layout, printing, using formulas and functions, and creating charts and pivot tables.
- Advanced features include conditional formatting, comments, grouping worksheets, and sharing workbooks with other users.
Ms excel basic about Data, graph and pivot table Alomgir Hossain
Microsoft Excel can be used to store, organize, and manipulate data. It allows data to be organized in workbooks containing worksheets with rows and columns made up of cells. Excel contains various built-in functions, formulas, charts, and data analysis tools. This document provides an overview of Excel's basic features and functions, how to enter and format data, use formulas and functions, sort and filter data, insert and delete rows/columns, and create basic charts and graphs. It demonstrates the core capabilities of Excel for organizing and analyzing data.
Excel is a spreadsheet program developed by Microsoft as part of its Office suite. It allows users to organize, format, and calculate data in a spreadsheet. Excel enables users to format, organize and calculate data in tabular form within electronic spreadsheets.
The document discusses statistical analysis and Excel functions for organizing and summarizing data. It provides information on entering data into Excel sheets, describes functions like SUM, AVERAGE, COUNT, and STDEV that calculate values like sums, means, numbers of data points, and standard deviations. It also discusses using Excel to group data using functions like FREQUENCY and analyzing descriptive statistics using the Data Analysis ToolPak.
This document summarizes an Excel training session that covered various Excel topics including basics, formulas, charts, printing, and mail merges. The training was led by three organizers and included an overview of Excel components and functions, hands-on exercises to create a shopping list and chart, and demonstrations of how to print worksheets, insert formulas, and use mail merges to generate reports and send emails. Additional topics discussed how Pearl and Microsoft Access relate to accessing and analyzing organizational data stored in the database.
This document provides a summary of Microsoft Excel tools and functions for beginners. It explains that Excel is a spreadsheet program used to organize and analyze data in tables consisting of rows and columns. The document then covers navigation within Excel, basic functions like sums and subtotals, filtering data, lookups, text functions, and concatenating cells. The goal is to give an overview of common Excel tools to improve daily work efficiency.
This document provides an overview of spreadsheets and Microsoft Excel. It discusses how Excel allows users to perform calculations, organize and analyze data. Common uses of spreadsheets include sales, accounting, scheduling and inventory. The document then reviews Excel basics like worksheets, cells, formatting, sorting, inserting/deleting rows and columns. It provides instructions for entering labels and values, cutting/copying/pasting, and formatting cells.
This document provides an introduction and overview of Microsoft Excel. It explains that Excel is a spreadsheet program used to organize and analyze data. It describes the basic components of an Excel workbook, including worksheets, columns, rows, and cells. The document also provides instructions for common Excel tasks like formatting text, inserting rows and columns, sorting data, using cell references in formulas, and applying functions. It includes the syntax for various functions and shortcuts keys in Excel.
This document provides an overview of how to customize the Ribbon interface in Excel 2010. It explains how to hide the Ribbon with one click. It describes how to add new tabs and groups to the Ribbon using the Customize Ribbon option in the Excel Options dialog box. Commands can then be added to these new custom tabs and groups. The document provides step-by-step instructions on how to create a new group, rename it, and add commands to it. This allows the user to customize the Ribbon with frequently used commands for improved productivity in Excel 2010.
Focusing on specific data by using filterssum5ashm
1. Excel allows users to focus on important data by limiting the data displayed through powerful filtering tools. Filters can be applied to individual columns to display only certain values.
2. Formulas like SUM and AVERAGE do not dynamically update when rows are hidden, but SUBTOTAL and AGGREGATE functions can summarize just the visible data. Finding unique values in a column can also help analyze data.
3. Validation rules restrict data entry to valid values, helping catch errors. Rules define allowed data types, values, and display custom messages to users.
MIRCROSOFT EXCEL- brief and useful for beginners by RISHABH BANSALRishabh Bansal
the above presentation gives you a brief explanation of Microsoft excel. it includes various formulas, tips, explanations and shortcut keys that are useful for a beginner.
i found it useful, i hope u will also find it useful.
if you LIKE MY PRESENTATION you could FOLLOW ME on SLIDESHARE and FACEBOOK and add your suggestions for more.
best of luck..
These are MS Excel Tips and tricks you might not know, which will advance your skills in using Excel, also these tips and tricks are the main Job exams questions
This document provides an introduction and overview of key concepts in Microsoft Excel including worksheets, cells, formatting, formulas, functions, charts, and pivot tables. It explains how to create and manage worksheets, format cells, perform calculations with formulas and functions, create charts to visualize data, build pivot tables to summarize and filter data, and consolidate data across multiple worksheets. Examples and step-by-step instructions are provided for common Excel tasks like renaming sheets, merging cells, using arithmetic and logical operators in formulas, and linking worksheets to consolidate data.
This document provides instructions on how to use various advanced Excel functions and tools, including IF functions, MATCH function, goal seek, data validation for drop down lists, two-axis charts, and the Solver tool. It explains each tool with step-by-step instructions and examples using sample sales data for a computer or fruit merchant. The document is intended to teach readers advanced Excel skills in simple terms.
This document provides an introduction to using Microsoft Excel for an accounting course. It explains basic spreadsheet concepts and Excel features such as cells, columns, rows, formatting, entering data, altering cell sizes, inserting/deleting rows and columns, and using cut, copy and paste. Students are instructed to create a proper spreadsheet for accounting purposes based on a provided guide.
Chapter 29Foundations of Family CareFamily DefinedT.docxcravennichole326
Chapter 29
Foundations of Family Care
Family
Defined:
Two or more individuals who identify themselves as family and manifest some degree of interdependence in interactions with each other and their environment
Central themes
Interdependence
Beliefs
Health Responsibilities of the Family
Development of personal identity and self-worth
Family interactions facilitate or impede members’ access to the following:
Affect
Power
Meaning
Failure to thrive
Families
Lifecycle transitions
Prenatal and postpartum visits
Changes in family structure
Values
Families acquire values about health and learn personal health practices relative to nutrition, exercise, smoking, alcohol consumption, and hygiene through their family of origin and transmit those values and beliefs
Families (cont.)
Healthcare system education
Families serve as a reference for defining illness and what should be done about it.
Provision of care
Assume major share of responsibility for intergenerational support and assistance
Two caregiving roles:
Direct care provider
Indirect care provider
Theoretical Approaches to Family
Human Ecology Theory
Nonsummativity
Family Systems Theory
Structure
Function
Self-regulation
Positive feedback
Negative feedback
Family development theory
Family development tasks
Family Assessment
Conceptual framework for family assessment
Provides direction to the collection, organization, and interpretation of data about the family’s health situation
Energy
Consciousness
Role structure
Decision-making processes
Communication patterns
Values
Family boundaries
Self-Efficacy Model
Five phases of contracting process:
Identification of family health concerns and needs
Mutual setting of goals
Delineation of alternatives
Implementation of the plan
Evaluation
YearQuarterLocationCarClassRevenue NumCars 2017Q1DowntownEconomy $912,900 6,262 2017Q1AirportEconomy $978,534 5,891 2015Q3DowntownEconomy $752,272 5,678 2016Q4AirportEconomy $896,251 5,480 2016Q1DowntownEconomy $701,460 5,151 2015Q3AirportEconomy $685,248 5,017 2016Q4DowntownEconomy $687,844 4,848 2016Q3DowntownEconomy $665,548 4,799 2016Q2DowntownEconomy $626,232 4,550 2015Q4AirportEconomy $597,979 4,343 2015Q4AirportPremium $619,900 4,221 2016Q3AirportPremium $643,168 4,164 2015Q4DowntownPremium $582,504 4,155 2017Q1AirportPremium $663,276 4,106 2017Q2AirportPremium $674,672 4,090 2016Q2AirportPremium $585,156 3,850 2017Q2DowntownEconomy $561,124 3,824 2016Q3AirportEconomy $579,947 3,740 2016Q1AirportPremium $552,324 3,695 2015Q3DowntownPremium $504,800 3,657 2015Q4DowntownEconomy $496,840 3,655 2015Q2AirportEconomy $468,791 3,541 2016Q1AirportEconomy $487,124 3,475 2015Q1AirportEconomy $438,521 3,456 2016Q2DowntownPremium $488,588 3,350 2017Q2AirportEconomy $581,071 3,349 2015Q2DowntownPremium $455,424 3,341 2016Q4AirportPremium $527,900 3,327 2015Q3AirportPremium $471,816 3,259 2016Q3DowntownPremium $483,256 3,250 2016Q1DowntownPremium $415,016 2,898 2015Q2DowntownEco ...
Conditional formatting allows cells in a spreadsheet to be formatted based on their values. This lesson teaches how to apply, modify, and delete conditional formatting rules to highlight interesting or unusual cell values and visualize data. There are several conditional formatting rules including highlighting specific cells based on values, highlighting top/bottom values, using data bars where bar length represents cell value, and applying color scales with gradients. Applying conditional formatting involves selecting cells, clicking Conditional Formatting, and choosing a rule.
The document is a tutorial for using Microsoft Excel. It provides step-by-step instructions on how to navigate the Excel interface and use basic functions. The tutorial covers topics such as navigating the Excel screen, entering formulas and data, formatting worksheets, creating charts, and using keyboard shortcuts. It also includes explanations and instructions for common Excel tasks like opening and saving files, editing data, printing worksheets, and more.
"Financial Odyssey: Navigating Past Performance Through Diverse Analytical Lens"sameer shah
Embark on a captivating financial journey with 'Financial Odyssey,' our hackathon project. Delve deep into the past performance of two companies as we employ an array of financial statement analysis techniques. From ratio analysis to trend analysis, uncover insights crucial for informed decision-making in the dynamic world of finance."
Excel 2013 is a spreadsheet program that allows users to store, organize, and analyze data. It features tools like formulas, functions, charts and pivot tables. In Excel, data is organized into cells within a worksheet. Cells can contain text, numbers, formulas or other content. Worksheets can be viewed and formatted in different layout views. Formatting options and functions allow for analysis of data through calculations and visualization. Pivot tables and charts provide interactive summaries and visual representations of worksheet data. Macros allow repetitive tasks to be automated. Advanced features include comments, filtering, sorting, tables and other analysis tools.
This document provides an overview of Microsoft Excel. It discusses that Excel is a spreadsheet application used to organize data into tables and perform calculations. Key points covered include:
- Excel uses a grid of rows and columns to display data in worksheets.
- Common tasks in Excel include entering data, formatting cells, adjusting worksheet layout, printing, using formulas and functions, and creating charts and pivot tables.
- Advanced features include conditional formatting, comments, grouping worksheets, and sharing workbooks with other users.
Ms excel basic about Data, graph and pivot table Alomgir Hossain
Microsoft Excel can be used to store, organize, and manipulate data. It allows data to be organized in workbooks containing worksheets with rows and columns made up of cells. Excel contains various built-in functions, formulas, charts, and data analysis tools. This document provides an overview of Excel's basic features and functions, how to enter and format data, use formulas and functions, sort and filter data, insert and delete rows/columns, and create basic charts and graphs. It demonstrates the core capabilities of Excel for organizing and analyzing data.
Excel is a spreadsheet program developed by Microsoft as part of its Office suite. It allows users to organize, format, and calculate data in a spreadsheet. Excel enables users to format, organize and calculate data in tabular form within electronic spreadsheets.
The document discusses statistical analysis and Excel functions for organizing and summarizing data. It provides information on entering data into Excel sheets, describes functions like SUM, AVERAGE, COUNT, and STDEV that calculate values like sums, means, numbers of data points, and standard deviations. It also discusses using Excel to group data using functions like FREQUENCY and analyzing descriptive statistics using the Data Analysis ToolPak.
This document summarizes an Excel training session that covered various Excel topics including basics, formulas, charts, printing, and mail merges. The training was led by three organizers and included an overview of Excel components and functions, hands-on exercises to create a shopping list and chart, and demonstrations of how to print worksheets, insert formulas, and use mail merges to generate reports and send emails. Additional topics discussed how Pearl and Microsoft Access relate to accessing and analyzing organizational data stored in the database.
This document provides a summary of Microsoft Excel tools and functions for beginners. It explains that Excel is a spreadsheet program used to organize and analyze data in tables consisting of rows and columns. The document then covers navigation within Excel, basic functions like sums and subtotals, filtering data, lookups, text functions, and concatenating cells. The goal is to give an overview of common Excel tools to improve daily work efficiency.
This document provides an overview of spreadsheets and Microsoft Excel. It discusses how Excel allows users to perform calculations, organize and analyze data. Common uses of spreadsheets include sales, accounting, scheduling and inventory. The document then reviews Excel basics like worksheets, cells, formatting, sorting, inserting/deleting rows and columns. It provides instructions for entering labels and values, cutting/copying/pasting, and formatting cells.
This document provides an introduction and overview of Microsoft Excel. It explains that Excel is a spreadsheet program used to organize and analyze data. It describes the basic components of an Excel workbook, including worksheets, columns, rows, and cells. The document also provides instructions for common Excel tasks like formatting text, inserting rows and columns, sorting data, using cell references in formulas, and applying functions. It includes the syntax for various functions and shortcuts keys in Excel.
This document provides an overview of how to customize the Ribbon interface in Excel 2010. It explains how to hide the Ribbon with one click. It describes how to add new tabs and groups to the Ribbon using the Customize Ribbon option in the Excel Options dialog box. Commands can then be added to these new custom tabs and groups. The document provides step-by-step instructions on how to create a new group, rename it, and add commands to it. This allows the user to customize the Ribbon with frequently used commands for improved productivity in Excel 2010.
Focusing on specific data by using filterssum5ashm
1. Excel allows users to focus on important data by limiting the data displayed through powerful filtering tools. Filters can be applied to individual columns to display only certain values.
2. Formulas like SUM and AVERAGE do not dynamically update when rows are hidden, but SUBTOTAL and AGGREGATE functions can summarize just the visible data. Finding unique values in a column can also help analyze data.
3. Validation rules restrict data entry to valid values, helping catch errors. Rules define allowed data types, values, and display custom messages to users.
MIRCROSOFT EXCEL- brief and useful for beginners by RISHABH BANSALRishabh Bansal
the above presentation gives you a brief explanation of Microsoft excel. it includes various formulas, tips, explanations and shortcut keys that are useful for a beginner.
i found it useful, i hope u will also find it useful.
if you LIKE MY PRESENTATION you could FOLLOW ME on SLIDESHARE and FACEBOOK and add your suggestions for more.
best of luck..
These are MS Excel Tips and tricks you might not know, which will advance your skills in using Excel, also these tips and tricks are the main Job exams questions
This document provides an introduction and overview of key concepts in Microsoft Excel including worksheets, cells, formatting, formulas, functions, charts, and pivot tables. It explains how to create and manage worksheets, format cells, perform calculations with formulas and functions, create charts to visualize data, build pivot tables to summarize and filter data, and consolidate data across multiple worksheets. Examples and step-by-step instructions are provided for common Excel tasks like renaming sheets, merging cells, using arithmetic and logical operators in formulas, and linking worksheets to consolidate data.
This document provides instructions on how to use various advanced Excel functions and tools, including IF functions, MATCH function, goal seek, data validation for drop down lists, two-axis charts, and the Solver tool. It explains each tool with step-by-step instructions and examples using sample sales data for a computer or fruit merchant. The document is intended to teach readers advanced Excel skills in simple terms.
This document provides an introduction to using Microsoft Excel for an accounting course. It explains basic spreadsheet concepts and Excel features such as cells, columns, rows, formatting, entering data, altering cell sizes, inserting/deleting rows and columns, and using cut, copy and paste. Students are instructed to create a proper spreadsheet for accounting purposes based on a provided guide.
Chapter 29Foundations of Family CareFamily DefinedT.docxcravennichole326
Chapter 29
Foundations of Family Care
Family
Defined:
Two or more individuals who identify themselves as family and manifest some degree of interdependence in interactions with each other and their environment
Central themes
Interdependence
Beliefs
Health Responsibilities of the Family
Development of personal identity and self-worth
Family interactions facilitate or impede members’ access to the following:
Affect
Power
Meaning
Failure to thrive
Families
Lifecycle transitions
Prenatal and postpartum visits
Changes in family structure
Values
Families acquire values about health and learn personal health practices relative to nutrition, exercise, smoking, alcohol consumption, and hygiene through their family of origin and transmit those values and beliefs
Families (cont.)
Healthcare system education
Families serve as a reference for defining illness and what should be done about it.
Provision of care
Assume major share of responsibility for intergenerational support and assistance
Two caregiving roles:
Direct care provider
Indirect care provider
Theoretical Approaches to Family
Human Ecology Theory
Nonsummativity
Family Systems Theory
Structure
Function
Self-regulation
Positive feedback
Negative feedback
Family development theory
Family development tasks
Family Assessment
Conceptual framework for family assessment
Provides direction to the collection, organization, and interpretation of data about the family’s health situation
Energy
Consciousness
Role structure
Decision-making processes
Communication patterns
Values
Family boundaries
Self-Efficacy Model
Five phases of contracting process:
Identification of family health concerns and needs
Mutual setting of goals
Delineation of alternatives
Implementation of the plan
Evaluation
YearQuarterLocationCarClassRevenue NumCars 2017Q1DowntownEconomy $912,900 6,262 2017Q1AirportEconomy $978,534 5,891 2015Q3DowntownEconomy $752,272 5,678 2016Q4AirportEconomy $896,251 5,480 2016Q1DowntownEconomy $701,460 5,151 2015Q3AirportEconomy $685,248 5,017 2016Q4DowntownEconomy $687,844 4,848 2016Q3DowntownEconomy $665,548 4,799 2016Q2DowntownEconomy $626,232 4,550 2015Q4AirportEconomy $597,979 4,343 2015Q4AirportPremium $619,900 4,221 2016Q3AirportPremium $643,168 4,164 2015Q4DowntownPremium $582,504 4,155 2017Q1AirportPremium $663,276 4,106 2017Q2AirportPremium $674,672 4,090 2016Q2AirportPremium $585,156 3,850 2017Q2DowntownEconomy $561,124 3,824 2016Q3AirportEconomy $579,947 3,740 2016Q1AirportPremium $552,324 3,695 2015Q3DowntownPremium $504,800 3,657 2015Q4DowntownEconomy $496,840 3,655 2015Q2AirportEconomy $468,791 3,541 2016Q1AirportEconomy $487,124 3,475 2015Q1AirportEconomy $438,521 3,456 2016Q2DowntownPremium $488,588 3,350 2017Q2AirportEconomy $581,071 3,349 2015Q2DowntownPremium $455,424 3,341 2016Q4AirportPremium $527,900 3,327 2015Q3AirportPremium $471,816 3,259 2016Q3DowntownPremium $483,256 3,250 2016Q1DowntownPremium $415,016 2,898 2015Q2DowntownEco ...
Conditional formatting allows cells in a spreadsheet to be formatted based on their values. This lesson teaches how to apply, modify, and delete conditional formatting rules to highlight interesting or unusual cell values and visualize data. There are several conditional formatting rules including highlighting specific cells based on values, highlighting top/bottom values, using data bars where bar length represents cell value, and applying color scales with gradients. Applying conditional formatting involves selecting cells, clicking Conditional Formatting, and choosing a rule.
The document is a tutorial for using Microsoft Excel. It provides step-by-step instructions on how to navigate the Excel interface and use basic functions. The tutorial covers topics such as navigating the Excel screen, entering formulas and data, formatting worksheets, creating charts, and using keyboard shortcuts. It also includes explanations and instructions for common Excel tasks like opening and saving files, editing data, printing worksheets, and more.
Similar to Activity-2a_Data-Preparation-in-Excel.pdf (20)
"Financial Odyssey: Navigating Past Performance Through Diverse Analytical Lens"sameer shah
Embark on a captivating financial journey with 'Financial Odyssey,' our hackathon project. Delve deep into the past performance of two companies as we employ an array of financial statement analysis techniques. From ratio analysis to trend analysis, uncover insights crucial for informed decision-making in the dynamic world of finance."
Beyond the Basics of A/B Tests: Highly Innovative Experimentation Tactics You...Aggregage
This webinar will explore cutting-edge, less familiar but powerful experimentation methodologies which address well-known limitations of standard A/B Testing. Designed for data and product leaders, this session aims to inspire the embrace of innovative approaches and provide insights into the frontiers of experimentation!
Analysis insight about a Flyball dog competition team's performanceroli9797
Insight of my analysis about a Flyball dog competition team's last year performance. Find more: https://github.com/rolandnagy-ds/flyball_race_analysis/tree/main
Predictably Improve Your B2B Tech Company's Performance by Leveraging DataKiwi Creative
Harness the power of AI-backed reports, benchmarking and data analysis to predict trends and detect anomalies in your marketing efforts.
Peter Caputa, CEO at Databox, reveals how you can discover the strategies and tools to increase your growth rate (and margins!).
From metrics to track to data habits to pick up, enhance your reporting for powerful insights to improve your B2B tech company's marketing.
- - -
This is the webinar recording from the June 2024 HubSpot User Group (HUG) for B2B Technology USA.
Watch the video recording at https://youtu.be/5vjwGfPN9lw
Sign up for future HUG events at https://events.hubspot.com/b2b-technology-usa/
Global Situational Awareness of A.I. and where its headedvikram sood
You can see the future first in San Francisco.
Over the past year, the talk of the town has shifted from $10 billion compute clusters to $100 billion clusters to trillion-dollar clusters. Every six months another zero is added to the boardroom plans. Behind the scenes, there’s a fierce scramble to secure every power contract still available for the rest of the decade, every voltage transformer that can possibly be procured. American big business is gearing up to pour trillions of dollars into a long-unseen mobilization of American industrial might. By the end of the decade, American electricity production will have grown tens of percent; from the shale fields of Pennsylvania to the solar farms of Nevada, hundreds of millions of GPUs will hum.
The AGI race has begun. We are building machines that can think and reason. By 2025/26, these machines will outpace college graduates. By the end of the decade, they will be smarter than you or I; we will have superintelligence, in the true sense of the word. Along the way, national security forces not seen in half a century will be un-leashed, and before long, The Project will be on. If we’re lucky, we’ll be in an all-out race with the CCP; if we’re unlucky, an all-out war.
Everyone is now talking about AI, but few have the faintest glimmer of what is about to hit them. Nvidia analysts still think 2024 might be close to the peak. Mainstream pundits are stuck on the wilful blindness of “it’s just predicting the next word”. They see only hype and business-as-usual; at most they entertain another internet-scale technological change.
Before long, the world will wake up. But right now, there are perhaps a few hundred people, most of them in San Francisco and the AI labs, that have situational awareness. Through whatever peculiar forces of fate, I have found myself amongst them. A few years ago, these people were derided as crazy—but they trusted the trendlines, which allowed them to correctly predict the AI advances of the past few years. Whether these people are also right about the next few years remains to be seen. But these are very smart people—the smartest people I have ever met—and they are the ones building this technology. Perhaps they will be an odd footnote in history, or perhaps they will go down in history like Szilard and Oppenheimer and Teller. If they are seeing the future even close to correctly, we are in for a wild ride.
Let me tell you what we see.
Orchestrating the Future: Navigating Today's Data Workflow Challenges with Ai...Kaxil Naik
Navigating today's data landscape isn't just about managing workflows; it's about strategically propelling your business forward. Apache Airflow has stood out as the benchmark in this arena, driving data orchestration forward since its early days. As we dive into the complexities of our current data-rich environment, where the sheer volume of information and its timely, accurate processing are crucial for AI and ML applications, the role of Airflow has never been more critical.
In my journey as the Senior Engineering Director and a pivotal member of Apache Airflow's Project Management Committee (PMC), I've witnessed Airflow transform data handling, making agility and insight the norm in an ever-evolving digital space. At Astronomer, our collaboration with leading AI & ML teams worldwide has not only tested but also proven Airflow's mettle in delivering data reliably and efficiently—data that now powers not just insights but core business functions.
This session is a deep dive into the essence of Airflow's success. We'll trace its evolution from a budding project to the backbone of data orchestration it is today, constantly adapting to meet the next wave of data challenges, including those brought on by Generative AI. It's this forward-thinking adaptability that keeps Airflow at the forefront of innovation, ready for whatever comes next.
The ever-growing demands of AI and ML applications have ushered in an era where sophisticated data management isn't a luxury—it's a necessity. Airflow's innate flexibility and scalability are what makes it indispensable in managing the intricate workflows of today, especially those involving Large Language Models (LLMs).
This talk isn't just a rundown of Airflow's features; it's about harnessing these capabilities to turn your data workflows into a strategic asset. Together, we'll explore how Airflow remains at the cutting edge of data orchestration, ensuring your organization is not just keeping pace but setting the pace in a data-driven future.
Session in https://budapestdata.hu/2024/04/kaxil-naik-astronomer-io/ | https://dataml24.sessionize.com/session/667627
1. Data Cleaning in Excel
Excel Data Cleaning is a significant skill that all Business and Data Analysts must possess. In the
current era of data analytics, everyone expects the accuracy and quality of data to be of the highest
standards. A major part of Excel Data Cleaning involves the elimination of blank spaces, incorrect,
and outdated information.
How to Clean Data in Excel?
Remove Duplicates
One of the easiest ways of cleaning data in Excel is to remove duplicates. There is a considerable
probability that it might unintentionally duplicate the data without the user's knowledge. In such
scenarios, you can eliminate duplicate values.
Here, you will consider a simple student dataset that has duplicate values. You will use Excel's
built-in function to remove duplicates, as shown below.
The original dataset has two rows as duplicates. To eliminate the duplicate data, you need to select
the data option in the toolbar, and in the Data Tools ribbon, select the "Remove Duplicates" option.
This will provide you with the new dialogue box, as shown below.
Here, you need to select the columns you want to compare for duplication. Another critical step is
to check in the headers' option as you included the column names in the data set. Excel will
automatically scan it by default.
2. Next, you must compare all columns, so go ahead and check all the columns as shown below.
Select Ok, and Excel performs the operations required and provides you with the data set after
filtering out the duplicate data, as shown below.
3. In the next part of Excel Data Cleaning, you will understand data parsing from text to column.
Data Parsing from Text to Column
Sometimes, there is a possibility that one cell might have multiple data elements separated by a
data delimiter like a comma. For example, consider that there is one column that stores address
information.
The address column stores the street, district, state, and nation. Commas separate all the data
elements. You must now divide the street, district, state, and nation from the address columns into
separate columns.
Excel's inbuilt functionality called "text to column" can achieve this. Now, try an example for the
same.
Here, you have the car manufacturer and the car model name separated by space as the data
delimiter. The tabular data is shown below.
4. Select the data, click on the data option in the toolbar and then select "Text to Column", as shown
below.
A new window will pop up on the screen, as shown below. Select the delimiter option and click
on "next". In the next window, you will see another dialogue box.
5. In the new page dialogue box, you will see an option to select the type of delimiter your data has.
In this case, you need to select the "space" as a delimiter, as shown below.
6. In the last dialogue box, select the column data format as "General", and the next step should be
to click on the finish, as shown in the following image.
The final resultant data will be available, as shown below.
7. Followed by Data parsing, you will learn how to delete all formatting.
Delete All Formatting
Another good way of cleaning data in excel is to ensure even formatting or, in some cases, even
removing the formatting. The formatting can be as simple as coloring your cells and aligning the
text in the cells. It can be a logical condition applied to your cells using Excel's conditional
formatting option from the home tab.
However, in situations where you wish to remove the formatting, you can do it in the following
ways. First, try to eliminate the regular formatting. In the previous example, you took the case of
car manufacturers and car models data tables with heading cells colored in blue, and the text was
center aligned.
Now, use the clear option to remove the formats. Select the tabular data as shown below. Select
the "home" option and go to the "editing" group in the ribbon. The "clear" option is available in
the group, as shown below.
8. Select the "clear" option and click on the "clear formats" option. This will clear all the formats
applied on the table.
The final data table will appear as shown below.
9. Now, you must learn how to eliminate conditional formatting for cleaning data in Excel. This
time, consider a different sheet. You must use the student's details sheet, which includes
conditional formatting in Excel.
To eliminate conditional formatting in Excel, select the column or table with conditional
formatting as shown below.
Then navigate to "Home", and select conditional formatting.
Then in the dialogue box, select the clear rules option. Here, you can either choose to eliminate
rules only in the selected cells or eliminate rules from the entire column.
10. After you eliminate all conditions, the resultant table would look as follows.
You can always use a shortcut method to eliminate the conditional formatting in Excel. It is by
pressing the sequential combination of the following keys as follows.
ATL + E + A + F
11. Next, you will learn about Spell Check.
Spell Check
The feature of checking the spelling is available in MS Excel as well. To check the spellings of
the words used in the spreadsheet, you can use the following method. Select the data cell, column,
or sheet where you want to perform the spell check.
Now, go to the review option as shown below.
Microsoft Excel will automatically show the correct spelling in the dialogue box, as shown
below. You can replace the words as per the requirement as shown below.
12. The final reviewed data table will like the one below.
In the next segment, you will learn about changing the text case.
Change Case - Lower/Upper/Proper
You can manipulate the data in the Excel worksheet in terms of character cases as per the
requirements. To apply case changes, you can follow the following steps.
Select the table or columns that need the case to be changed, as shown below.
13. Select the cell next to the column and apply the formula as per the requirement, as shown below.
=UPPER(cell address) - for Upper case conversion
=LOWER(cell address) - for Lower case conversion
=PROPER(cell address) - for Sentence case conversion
Now, you can drag the cell to the last row, as shown below.
14. The final data table will appear as shown below.
Now that you learned spell check, in the upcoming section of Excel Data Cleaning, you will
learn how to Highlight Errors in an Excel spreadsheet.
Highlight Errors
Highlighting errors in an Excel spreadsheet is helpful to find or sort out the erroneous data with
ease. You can do error Highlighting with the help of conditional formatting in Excel. Here, you
must consider the student data set as an example.
15. Imagine that you are interviewing all the students. There are eligibility criteria. You can shortlist
the students if they have 60% aggregate marks. Now, apply conditional formatting and sort out
the students who are eligible and not eligible.
First, select the aggregate/percentage column as shown below.
Select "Home", and in the Styles group, select conditional formatting, as shown below.
In the conditional formatting option, select the highlight option, and in the next drop-down,
select the less than an option as shown below.
16. In the settings window, you will find a slot to provide the aggregate as "60" percent and press ok.
Excel will now select and highlight cells with an aggregate of less than 60 percent. In the next
part of Excel Data Cleaning, you will understand the trim function.
17. TRIM Function
The TRIM function is used to eliminate excess spaces and tab spaces in the Excel worksheet
cells. The excessive blank spaces and tab spaces make the data hard to understand. Using the
"TRIM" function can eliminate these excessive blank spaces.
Select the data cells with excessive blank spaces and tab spaces. Now, select a new cell adjacent
to the first cell.
Apply the TRIM() function and drag the cell as shown below.
It shows the final data after the elimination of the excess space as follows.
Next, you will look at the Find and Replace function.
Find and Replace
Find and Replace will help you fetch and replace data in the entire worksheet to help in
organizing and cleaning data in Excel. Consider the employee data example.
18. Here, try to fetch an employee with the name Joe and try to rename or replace his name with John,
after changing his first name.
The "find and replace" option is present in the home ribbon in the editing group, as shown below.
19. Click on the option, and a new window will open, where you can enter the data to be fetched and
enter the text you need to replace, as shown below.
Click on "replace all", and it will replace the text. The final dataset will be as shown below.