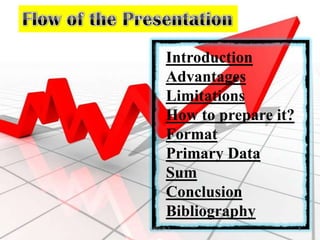
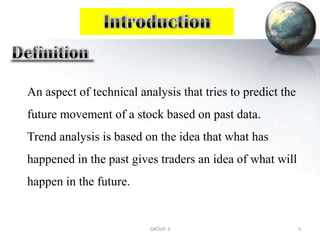
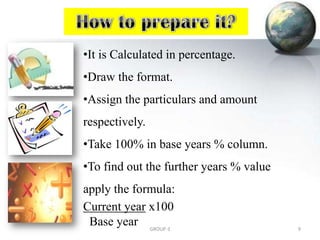
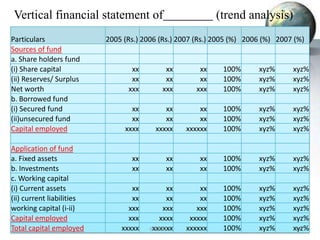
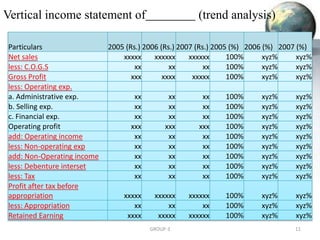
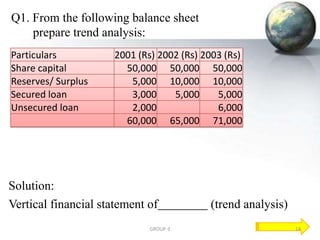
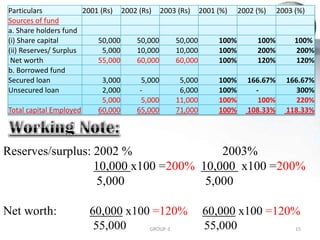
,
capital budgeting
,
concept of capital budgeting
,
the capital budgeting process
,
significance of capital budgeting
,
classification of investment project proposals
,
techniques of capital budgeting
,
types of project
,
capital budgeting
,
concept of capital budgeting
,
the capital budgeting process
,
significance of capital budgeting
,
classification of investment project proposals
,
techniques of capital budgeting
,
types of project
Meaning
Purpose
Forms of presenting comparative statement
Comparative Balance Sheet
Advantage of comparative balance sheet
Format of comparative balance sheet
Illustration
Exercise
Comparative statements of profit & loss
Objective of comparative statement of profit & loss
Format of comparative statement of profit & loss
Illustration
Exercise
Cost Volume Profit (CVP).
Introduction
Fixed costs
Variable costs
Semi variable costs
Contribution margin
Break even point
PV Ratio
BEP ANalysis.
break even point
Cost-volume-Profit.
Quantitative management is not a modern business idea but a management theory that came into existence after World War II. Business owners initially used it in Japan to pick up the pieces of the devastation caused by the war and started taking baby steps toward reconstruction. It focuses on the following elements of business operations:
Customer satisfaction
Business value enhancement
Empowerment of employees
Creating synergy among teams
Creating quality products
Preventing defects
Being responsible for quality
Focusing on continuous improvement
Leveraging statistical measurement
Remaining focused on the processes
Commitment to refinement and learning
Quantitative techniques in management as a collection of mathematical and statistical tools. They’re known by different names, such as management science or operation research. In modern business methods, statistical techniques are also viewed as a part of quantitative management techniques.
When appropriately used, quantitative approaches to management can become a powerful means of analysis, leading to effective decision-making. These techniques help resolve complex business problems by leveraging systematic and scientific methods.
Meaning
Purpose or utility of common size statement
Common Size Balance sheet
Purpose of common size balance sheet
Format of common size balance sheet
Illustration
Exercise
Common Size Statement of profit & loss
Purpose of common size statement of profit & loss
Format of common size statement of profit & loss
Illustration
Exercise
Activity based costing is considered to be useful only for Manufacturing Organizations whereas reality is that it is equally usefull to Service providers
Meaning
Purpose
Forms of presenting comparative statement
Comparative Balance Sheet
Advantage of comparative balance sheet
Format of comparative balance sheet
Illustration
Exercise
Comparative statements of profit & loss
Objective of comparative statement of profit & loss
Format of comparative statement of profit & loss
Illustration
Exercise
Cost Volume Profit (CVP).
Introduction
Fixed costs
Variable costs
Semi variable costs
Contribution margin
Break even point
PV Ratio
BEP ANalysis.
break even point
Cost-volume-Profit.
Quantitative management is not a modern business idea but a management theory that came into existence after World War II. Business owners initially used it in Japan to pick up the pieces of the devastation caused by the war and started taking baby steps toward reconstruction. It focuses on the following elements of business operations:
Customer satisfaction
Business value enhancement
Empowerment of employees
Creating synergy among teams
Creating quality products
Preventing defects
Being responsible for quality
Focusing on continuous improvement
Leveraging statistical measurement
Remaining focused on the processes
Commitment to refinement and learning
Quantitative techniques in management as a collection of mathematical and statistical tools. They’re known by different names, such as management science or operation research. In modern business methods, statistical techniques are also viewed as a part of quantitative management techniques.
When appropriately used, quantitative approaches to management can become a powerful means of analysis, leading to effective decision-making. These techniques help resolve complex business problems by leveraging systematic and scientific methods.
Meaning
Purpose or utility of common size statement
Common Size Balance sheet
Purpose of common size balance sheet
Format of common size balance sheet
Illustration
Exercise
Common Size Statement of profit & loss
Purpose of common size statement of profit & loss
Format of common size statement of profit & loss
Illustration
Exercise
Activity based costing is considered to be useful only for Manufacturing Organizations whereas reality is that it is equally usefull to Service providers
basic financial analysis, framework for ratio analysis, types of ratio analysis, liquidity ratios, debt ratios, equity ratios, activity ratios, profit ratio, index analysis, common size financial statements
READ THIS FIRST CaseUVa Health System The LATC Hospital ProjectWk.docxcatheryncouper
READ THIS FIRST CaseUVa Health System: The LATC Hospital ProjectWk 4 is the second of two weeks on CAPITAL BUDGETING Study the Wk 3
Solution
s Template before proceeding into Wk 4.Learning Objectives(repeated from Wk3 Assignment Template)You will learn the three steps in capital budgeting:SEE THE FLOW DIAGRAM - YOU ARE NOW WORKING ON THE GREEN-COLORED ANALYSIS.1Identify relevant incremental cash flows2Calculate cost of capital (k-wacc) to use as the discount rate3Calculate the metrics of capital budgeting: Net Present Value, Profitability Index, Internal Rate of Return, and Payback Period. Then, you will apply the metrics and information in the case study to make a recommendationabout which of the two projects to accept.The essence of the capital budgeting process is to make sure, before an investment is made,that its prospective rate of return is high enough to justify the investment,i.e., that the project is CREATES value, not DESTROYS value.Directions(some repeating from Wk3 Assignment Template)1Make a quick scan through the LTAC case and the exhibits. 2Listen to the Intro Audio3Cohen Finance Workbook chapter 4 is a review of Time Value of Money, which you covered in a previous course.Review it as necessary, but defer the review until you look at the TVM applications in chapter 5 beginning on p 79.You need to know TVM to understand the capital budgeting metrics of NPV, PI, and IRR. Make sure youhave that context in mind before reviewing the TVM chapter 4 (only if you need to).4Read the case again, to grasp all the details, especially the Mulroney memo to her boss.5To understand how a capital budgeting template works, follow the step-by-step procedure in the book, pages 61-706Scan pages 70-76 on weighted average cost of capital. No need to emphasize at this point because discount rates are given in the case.7Read pages 79-84 on NPV, PI, IRR, PP.8Pages 83-85 show a worked-out example of a capital budgeting decision.QuestionsIf you work with a group, write answers on your own, independently. Group answers violate academic integrity requirements. 1See Q1 tab.Scroll down until you see the questions.Capital Budgeting TemplateThe template calculates FREE CASH FLOW=[EBIT-TAX+DEPREC]+/-CHANGE NWC+/-CAPEX.2See Q2 tab.Scroll down until you see the questions.K-wacc The 1st term is income statement data; the 2nd & 3rd terms are balance sheet data.3See Q3 tab.Scroll down until you see the questions.Sensitivity AnalysisLEARN THIS FORMULA (EQUATION) COLD!Expect to revisit these calculations and decisions in Wk7.
Q1 Capital Budgeting TemplateUNIVERSITY OF VIRGINIA MEDICAL CENTERLong Term Acute Care HospitalFree Cash Flow ProjectionsRevenue and Cost AssumptionsResults-No NWC RecoveryResults-NWC RecoveryNumber of Beds50NPV$5,687NPV$10,425(000 ommited)Year 1 Utilization 26%IRR17.6%IRR21.2%Year 2 Utilization 60%Annual Increase in Utilization4%Operating Expense (% of Revenue)7.0%K-wacc10%Year12345678910VOLUMEPatient Day Capacity 18,25018,25018,25018,250 ...
Dick’s Sporting Goods
Manami Maehama
Professor Martin
Horizontal & Vertical Analysis
Balance Sheet
Cash & Short Term Investments
Cash and Short Term investments is the sum of two balance sheet line items: cash
and equivalents and short term investments in marketable securities.
3 ways to improve:
1. Lease, Don’t Buy.
2. Offer Discounts on Loans
3. Conduct Customer Credit Checks
Assets Horizontal
2016 2017 2018 2019 2020 2021
119M (39%) 165M (-39%) 101M (13%) 114M (-39%) 70M (-6.5%) 69M
Total Accounts Receivable
Total Accounts receivable is the balance of money due to a firm for goods or
services delivered or used but not yet paid for by customers.
3 ways to improve :
1. Move fast on past-due receivables.
2. Consider offering an early payment discount
3. Consider offering a payment plan
ASSET Horizontal
2016 2017 2018 2019 2020 2021
67M (16%) 78M (-17%) 65M (-32%) 44M (34%) 59M (0.25%) 59M
Inventories
Inventory is the term for the goods available for sale and raw materials used to
produce goods available for sale.
3 ways to improve :
1. Avoid dead stock.
2. Save on storage costs
3. Regular auditing
ASSET Horizontal
2016 2017 2018 2019 2020 2021
2B (0%) 2B (0%) 2B (0%) 2B (0%) 2B (0%) 2B
Total Current Assets
Total current assets represent all the assets of a company that are expected to be conveniently
sold, consumed, utilized or exhausted through the standard business operations, which can lead to
their conversion to a cash value over the next one year period.
3 ways to improve :
1. Pay off Current Liabilities.
2. Sell-off Unproductive Assets.
3. Improve Current Asset by Rising Shareholders Funds
ASSET Horizontal
2016 2017 2018 2019 2020 2021
2B (0%) 2B (0%) 2B (0%) 2B (0%) 2B (0%) 2B
Net Property, Plant & Equipment
Net Property, Plant, and Equipment is the value of all buildings, land, furniture, and
other physical capital that a business has purchased to run its business.
3 ways to improve :
1. Ins and outs of depreciation
2. Use an accelerated method that takes most most of the depreciation up front
3. Subtract depreciation over time
ASSET Horizontal
2016 2017 2018 2019 2020 2021
1B (100%) 2B (0%) 2B (0%) 2B (100%) 4B (50%) 5B
Intangible Assets
An intangible asset is an asset that is not physical in nature.
3 ways to improve:
1. Identify Your Intangible Asset
2. Standardize Systems and Processes
3. Develop Your Intangibles
ASSET Horizontal
2016 2017 2018 2019 2020 2021
310M (24%) 385M (0.5%) 387M (-2%) 380M (-10%) 340M (3%) 340M
Net Goodwill
Goodwill is an intangible asset that is associated with the purchase of one
company by another.
3 ways to improve:
1. Cash-Flow Statement Basics
2. Investing Cash Flow
3. Financing Cash Flow
ASSET Horizontal
2016 2017 2018 2019 2020 2021
200M (23%) 245M (2%) 250M (0%) 250M (-2%) 245M (6%) 245M
Other Assets
Other assets are a grouping of accounts that are listed as a se ...
Dick’s Sporting Goods
Manami Maehama
Professor Martin
Horizontal & Vertical Analysis
Balance Sheet
Cash & Short Term Investments
Cash and Short Term investments is the sum of two balance sheet line items: cash
and equivalents and short term investments in marketable securities.
3 ways to improve:
1. Lease, Don’t Buy.
2. Offer Discounts on Loans
3. Conduct Customer Credit Checks
Assets Horizontal
2016 2017 2018 2019 2020 2021
119M (39%) 165M (-39%) 101M (13%) 114M (-39%) 70M (-6.5%) 69M
Total Accounts Receivable
Total Accounts receivable is the balance of money due to a firm for goods or
services delivered or used but not yet paid for by customers.
3 ways to improve :
1. Move fast on past-due receivables.
2. Consider offering an early payment discount
3. Consider offering a payment plan
ASSET Horizontal
2016 2017 2018 2019 2020 2021
67M (16%) 78M (-17%) 65M (-32%) 44M (34%) 59M (0.25%) 59M
Inventories
Inventory is the term for the goods available for sale and raw materials used to
produce goods available for sale.
3 ways to improve :
1. Avoid dead stock.
2. Save on storage costs
3. Regular auditing
ASSET Horizontal
2016 2017 2018 2019 2020 2021
2B (0%) 2B (0%) 2B (0%) 2B (0%) 2B (0%) 2B
Total Current Assets
Total current assets represent all the assets of a company that are expected to be conveniently
sold, consumed, utilized or exhausted through the standard business operations, which can lead to
their conversion to a cash value over the next one year period.
3 ways to improve :
1. Pay off Current Liabilities.
2. Sell-off Unproductive Assets.
3. Improve Current Asset by Rising Shareholders Funds
ASSET Horizontal
2016 2017 2018 2019 2020 2021
2B (0%) 2B (0%) 2B (0%) 2B (0%) 2B (0%) 2B
Net Property, Plant & Equipment
Net Property, Plant, and Equipment is the value of all buildings, land, furniture, and
other physical capital that a business has purchased to run its business.
3 ways to improve :
1. Ins and outs of depreciation
2. Use an accelerated method that takes most most of the depreciation up front
3. Subtract depreciation over time
ASSET Horizontal
2016 2017 2018 2019 2020 2021
1B (100%) 2B (0%) 2B (0%) 2B (100%) 4B (50%) 5B
Intangible Assets
An intangible asset is an asset that is not physical in nature.
3 ways to improve:
1. Identify Your Intangible Asset
2. Standardize Systems and Processes
3. Develop Your Intangibles
ASSET Horizontal
2016 2017 2018 2019 2020 2021
310M (24%) 385M (0.5%) 387M (-2%) 380M (-10%) 340M (3%) 340M
Net Goodwill
Goodwill is an intangible asset that is associated with the purchase of one
company by another.
3 ways to improve:
1. Cash-Flow Statement Basics
2. Investing Cash Flow
3. Financing Cash Flow
ASSET Horizontal
2016 2017 2018 2019 2020 2021
200M (23%) 245M (2%) 250M (0%) 250M (-2%) 245M (6%) 245M
Other Assets
Other assets are a grouping of accounts that are listed as a se.
Extra Credit Assignment, Econ 140 (3)Choose any topic discussed.docxnealwaters20034
Extra Credit Assignment, Econ 140 (3%)
Choose any topic discussed in the managerial economics class and write a 3 – 5 page essay with the following specifications.
1. Typed – Double spaced
2. Font Size - 12
3. Margins – 1 inch (top, bottom, right and left)
The paper should consist of the following:
(a) A discussion on your selected topic covering the main points.
(b) At least one news article related to the chosen topic, showing the application of the concept in the real world. You can easily find such news articles on google.
(c) Write in your own words what you’ve understood from the article(s) and how this relates to what you have learned in the Econ 140 class.
(d) Download (or scan) the articles and upload them along with your paper. The articles will not be included in the page count.
Other Requirements:
· Title of the paper and Your Name (Top corner of the first page)
· References (These should be on the last page of the assignment)
You can earn a maximum of 3% on this assignment. The grading TA’s decision regarding your assignment grade will be final; the assignment is not subject to grade-disputes. The assignments will be randomly distributed among the TAs for grading purpose.
(Keep in mind that late submissions or submissions via email will not be graded.)
1
Front Page
2
Memo
TO:
FROM:
DATE:
SUBJECT:
<text follows>
3
Table of contents
Appendix 1: Pro Forma FCF Page 4
Appendix 2 : Weighted Average Cost of Capital Page 5
Appendix 3 : Balance Sheets Page 6
Appendix 4 : Income Statements Page 8
Appendix 5 : Statements of Cash Flows Page 10
Appendix 6 : 10K Data Collection Page 11
Appendix 7: Market Return and Beta Page 12
4
Pro Format FCF
Value Drivers
Sales Growth 4.07%
Directly related to sales
Operating Expens es (excluding depreciation) 89.86%
Operating Current Assets 17.16%
Operating Current Liabilities 14.31%
Capital Expenditures 4.22%
Not directly related to sales
Depreciation Rate 6.09%
Interest Rate on Debt 5.53%
Interest Rate on ST Inves tments 1.73% <-- 1-year treasury yield (https://www.federalreserve.gov/releases/h15/)
Tax Rate 36.34%
Long term growth rate 0.00%
Unlevered Free Cash Flows Jan-20 Jan-21 Jan-22 Jan-23 Jan-24 Jan-25 Jan-26 Jan-27 Jan-28 Jan-29
Sales $17,255,546 $17,958,617 $18,690,334 $19,451,865 $20,244,425 $21,069,276 $21,927,736 $22,821,174 $23,751,014 $24,718,741
Operating Expenses $15,506,519 $16,138,326 $16,795,877 $17,480,219 $18,192,444 $18,933,688 $19,705,135 $20,508,013 $21,343,605 $22,213,242
Depreciation $620,940 $665,274 $711,414 $759,435 $809,412 $861,425 $915,557 $971,895 $1,030,529 $1,091,552
Earnings Before Interest And Taxes $1,128,087 $1,155,017 $1,183,043 $1,212,212 $1,242,569 $1,274,163 $1,307,044 $1,341,265 $1,376,881 $1,413,947
Taxes $409,958 $419,745 $429,930 $440,530 $451,562 $463,044 $474,993 $487,429 $500,372 $513,842
Net Income $718,129 $735,272 $753,114 $771,682 $791,.
How to automate an options day trading strategyQuantInsti
Complete code and webinar recording - https://blog.quantinsti.com/algo-trading-epat-projects-8-february-2022/
-----------------------------------------
The aim of the project is to automate a strategy as simple as an Intraday straddle/strangle which requires complex backtesting and quantitative analysis to ascertain statistical significance and quantitative edge in trading. Index options are back-tested for straddles and strangles with varying strike differences and stop losses using Python and Excel.
The Strategy involves shorting a Straddle or Strangle at a fixed time in the morning, placing a stop loss for both legs and squaring off all or remaining positions at a fixed time before market close.
No positions will be carried over as it is an Intraday strategy that helps in avoiding any big gaps in overnight positions. This strategy can be classified as both Non-Directional and Trend Following as it performs well in either case and it struggles only when the index is extremely choppy and moves in a zig-zag way hitting both stop losses.
-----------------------------------------
About the Presenter:
Ujjwal Agrawal (A Quantitative Trader and A Business Owner from India)
Ujjwal Agrawal is a CFA (Chartered Financial Analyst) Level 3 candidate and has a bachelor’s degree in Mechanical Engineering from Pune University. He is a business owner in the Agri Processing Industry in Odisha and has been trading in the Indian Markets for the past 4 years. Managing a business and trading full time becomes difficult at times and this led him towards automating his trading setups.
Completing the EPAT course and with the help of unconditional support from the QuantInsti team, Ujjwal has now completely automated his trading setups and devotes his full time towards his businesses.
His project “Intraday Straddles” was the first setup to be fully automated among many and now he researches and combines uncorrelated setups to generate decent returns with minimum drawdowns.
-----------------------------------------
Link to our Blog: https://blog.quantinsti.com/
Like us on Facebook @ https://www.facebook.com/quantinsti/
Follow us on Twitter @ https://twitter.com/QuantInsti
Follow us on LinkedIn @ https://www.linkedin.com/school/quantinsti/
Follow us on Instagram @ https://www.instagram.com/quantinstian/
E-mail us @ sales@quantinsti.com
-----------------------------------------
Data Quality Considerations for CECL MeasurementLibby Bierman
This webinar covers how institutions should be getting their data ready for the Current Expected Credit Loss Model, CECL, which will be the new standard for the ALLL or allowance for loan and lease losses.
Find out more at alll.com.
Lecture slide titled Fraud Risk Mitigation, Webinar Lecture Delivered at the Society for West African Internal Audit Practitioners (SWAIAP) on Wednesday, November 8, 2023.
2. Elemental Economics - Mineral demand.pdfNeal Brewster
After this second you should be able to: Explain the main determinants of demand for any mineral product, and their relative importance; recognise and explain how demand for any product is likely to change with economic activity; recognise and explain the roles of technology and relative prices in influencing demand; be able to explain the differences between the rates of growth of demand for different products.
Yes of course, you can easily start mining pi network coin today and sell to legit pi vendors in the United States.
Here the what'sapp contact of my personal vendor.
+12349014282
#pi network #pi coins #legit #passive income
#US
where can I find a legit pi merchant onlineDOT TECH
Yes. This is very easy what you need is a recommendation from someone who has successfully traded pi coins before with a merchant.
Who is a pi merchant?
A pi merchant is someone who buys pi network coins and resell them to Investors looking forward to hold thousands of pi coins before the open mainnet.
I will leave the what'sapp contact of my personal pi merchant to trade with
+12349014282
What website can I sell pi coins securely.DOT TECH
Currently there are no website or exchange that allow buying or selling of pi coins..
But you can still easily sell pi coins, by reselling it to exchanges/crypto whales interested in holding thousands of pi coins before the mainnet launch.
Who is a pi merchant?
A pi merchant is someone who buys pi coins from miners and resell to these crypto whales and holders of pi..
This is because pi network is not doing any pre-sale. The only way exchanges can get pi is by buying from miners and pi merchants stands in between the miners and the exchanges.
How can I sell my pi coins?
Selling pi coins is really easy, but first you need to migrate to mainnet wallet before you can do that. I will leave the what'sapp contact of my personal pi merchant to trade with.
+12349014282
how to sell pi coins in South Korea profitably.DOT TECH
Yes. You can sell your pi network coins in South Korea or any other country, by finding a verified pi merchant
What is a verified pi merchant?
Since pi network is not launched yet on any exchange, the only way you can sell pi coins is by selling to a verified pi merchant, and this is because pi network is not launched yet on any exchange and no pre-sale or ico offerings Is done on pi.
Since there is no pre-sale, the only way exchanges can get pi is by buying from miners. So a pi merchant facilitates these transactions by acting as a bridge for both transactions.
How can i find a pi vendor/merchant?
Well for those who haven't traded with a pi merchant or who don't already have one. I will leave the what'sapp number of my personal pi merchant who i trade pi with.
Message: +12349014282 VIA Whatsapp.
#pi #sell #nigeria #pinetwork #picoins #sellpi #Nigerian #tradepi #pinetworkcoins #sellmypi
Financial Assets: Debit vs Equity Securities.pptxWrito-Finance
financial assets represent claim for future benefit or cash. Financial assets are formed by establishing contracts between participants. These financial assets are used for collection of huge amounts of money for business purposes.
Two major Types: Debt Securities and Equity Securities.
Debt Securities are Also known as fixed-income securities or instruments. The type of assets is formed by establishing contracts between investor and issuer of the asset.
• The first type of Debit securities is BONDS. Bonds are issued by corporations and government (both local and national government).
• The second important type of Debit security is NOTES. Apart from similarities associated with notes and bonds, notes have shorter term maturity.
• The 3rd important type of Debit security is TRESURY BILLS. These securities have short-term ranging from three months, six months, and one year. Issuer of such securities are governments.
• Above discussed debit securities are mostly issued by governments and corporations. CERTIFICATE OF DEPOSITS CDs are issued by Banks and Financial Institutions. Risk factor associated with CDs gets reduced when issued by reputable institutions or Banks.
Following are the risk attached with debt securities: Credit risk, interest rate risk and currency risk
There are no fixed maturity dates in such securities, and asset’s value is determined by company’s performance. There are two major types of equity securities: common stock and preferred stock.
Common Stock: These are simple equity securities and bear no complexities which the preferred stock bears. Holders of such securities or instrument have the voting rights when it comes to select the company’s board of director or the business decisions to be made.
Preferred Stock: Preferred stocks are sometime referred to as hybrid securities, because it contains elements of both debit security and equity security. Preferred stock confers ownership rights to security holder that is why it is equity instrument
<a href="https://www.writofinance.com/equity-securities-features-types-risk/" >Equity securities </a> as a whole is used for capital funding for companies. Companies have multiple expenses to cover. Potential growth of company is required in competitive market. So, these securities are used for capital generation, and then uses it for company’s growth.
Concluding remarks
Both are employed in business. Businesses are often established through debit securities, then what is the need for equity securities. Companies have to cover multiple expenses and expansion of business. They can also use equity instruments for repayment of debits. So, there are multiple uses for securities. As an investor, you need tools for analysis. Investment decisions are made by carefully analyzing the market. For better analysis of the stock market, investors often employ financial analysis of companies.
Abhay Bhutada Leads Poonawalla Fincorp To Record Low NPA And Unprecedented Gr...Vighnesh Shashtri
Under the leadership of Abhay Bhutada, Poonawalla Fincorp has achieved record-low Non-Performing Assets (NPA) and witnessed unprecedented growth. Bhutada's strategic vision and effective management have significantly enhanced the company's financial health, showcasing a robust performance in the financial sector. This achievement underscores the company's resilience and ability to thrive in a competitive market, setting a new benchmark for operational excellence in the industry.
5. An aspect of technical analysis that tries to predict the
future movement of a stock based on past data.
Trend analysis is based on the idea that what has
happened in the past gives traders an idea of what will
happen in the future.
5GROUP-3
6. •When one wants to use historical data to
predict future.
•When one wants to Compare the current values
with the past values.
6GROUP-3
7. •Trend shows the direction of the change.
•Trend are easy to calculate, interpret and understand.
•It is a quick method of analysis.
•It is more accurate.
•It reveals potentially fruitful areas of audit investigation.
•It is being readily accepted due to its widespread use
7GROUP-3
8. •Choice of base year.
•No. of years
•Different accounting policies.
•It provides little insight into the root causes of variation
•It is being heavily influenced by the choice of the base
fiscal period
8GROUP-3
9. •It is Calculated in percentage.
•Draw the format.
•Assign the particulars and amount
respectively.
•Take 100% in base years % column.
•To find out the further years % value
apply the formula:
Current year x100
Base year 9GROUP-3
10. Vertical financial statement of (trend analysis)
Particulars 2005 (Rs.) 2006 (Rs.) 2007 (Rs.) 2005 (%) 2006 (%) 2007 (%)
Sources of fund
a. Share holders fund
(i) Share capital xx xx xx 100% xyz% xyz%
(ii) Reserves/ Surplus xx xx xx 100% xyz% xyz%
Net worth xxx xxx xxx 100% xyz% xyz%
b. Borrowed fund
(i) Secured fund xx xx xx 100% xyz% xyz%
(ii)unsecured fund xx xx xx 100% xyz% xyz%
Capital employed xxxx xxxxx xxxxxx 100% xyz% xyz%
Application of fund
a. Fixed assets xx xx xx 100% xyz% xyz%
b. Investments xx xx xx 100% xyz% xyz%
c. Working capital
(i) Current assets xx xx xx 100% xyz% xyz%
(ii) current liabilities xx xx xx 100% xyz% xyz%
working capital (i-ii) xxx xxx xxx 100% xyz% xyz%
Capital employed xxx xxxx xxxxx 100% xyz% xyz%
Total capital employed xxxxx xxxxxx xxxxxx 100% xyz% xyz%10GROUP-3
11. Vertical income statement of (trend analysis)
Particulars 2005 (Rs.) 2006 (Rs.) 2007 (Rs.) 2005 (%) 2006 (%) 2007 (%)
Net sales xxxxx xxxxxx xxxxxx 100% xyz% xyz%
less: C.O.G.S xx xx xx 100% xyz% xyz%
Gross Profit xxx xxxx xxxxx 100% xyz% xyz%
less: Operating exp.
a. Administrative exp. xx xx xx 100% xyz% xyz%
b. Selling exp. xx xx xx 100% xyz% xyz%
c. Financial exp. xx xx xx 100% xyz% xyz%
Operating profit xxx xxx xxx 100% xyz% xyz%
add: Operating income xx xx xx 100% xyz% xyz%
less: Non-operating exp xx xx xx 100% xyz% xyz%
add: Non-Operating income xx xx xx 100% xyz% xyz%
less: Debenture interset xx xx xx 100% xyz% xyz%
less: Tax xx xx xx 100% xyz% xyz%
Profit after tax before
appropriation xxxxx xxxxxx xxxxxx 100% xyz% xyz%
less: Appropriation xx xx xx 100% xyz% xyz%
Retained Earning xxxx xxxxx xxxxxx 100% xyz% xyz%
11GROUP-3
12. Data of- Rassaz Multiplex
Given by- Mr. Ritesh,
Accountant
Contact no.- 28114682
12GROUP-3
13. Q1. Which kind of financial statement does your
institute follw? (i.e Horizontal or Vertical)
Vertical
Q2. Why vertical statement?
It reports each amount as a percentage of
another item.
Q3. Which format does your institute opt in vertical
statement?
comparative
Q4. Why comparative and not the others?
It is Easy to compare with previous year item.
13GROUP-3
14. Particulars 2001 (Rs) 2002 (Rs) 2003 (Rs)
Share capital 50,000 50,000 50,000
Reserves/ Surplus 5,000 10,000 10,000
Secured loan 3,000 5,000 5,000
Unsecured loan 2,000 6,000
60,000 65,000 71,000
Q1. From the following balance sheet
prepare trend analysis:
Solution:
Vertical financial statement of (trend analysis)
14GROUP-3
15. Particulars 2001 (Rs) 2002 (Rs) 2003 (Rs) 2001 (%) 2002 (%) 2003 (%)
Sources of fund
a. Share holders fund
(i) Share capital 50,000 50,000 50,000 100% 100% 100%
(ii) Reserves/ Surplus 5,000 10,000 10,000 100% 200% 200%
Net worth 55,000 60,000 60,000 100% 120% 120%
b. Borrowed fund
Secured loan 3,000 5,000 5,000 100% 166.67% 166.67%
Unsecured loan 2,000 - 6,000 100% - 300%
5,000 5,000 11,000 100% 100% 220%
Total capital Employed 60,000 65,000 71,000 100% 108.33% 118.33%
Reserves/surplus: 2002 % 2003%
10,000 x100 =200% 10,000 x100 =200%
5,000 5,000
Net worth: 60,000 x100 =120% 60,000 x100 =120%
55,000 55,000 15GROUP-3