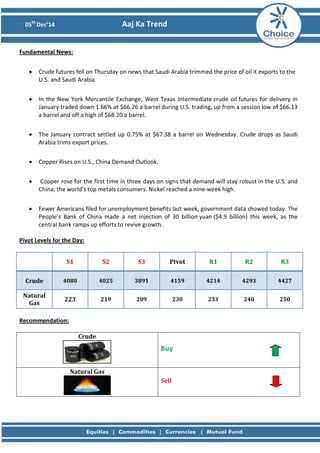
05th
Dec’14 Aaj Ka Trend
Bullions
MCX Gold Feb Daily Chart
Technical View:
On daily timeframe prices are trading near the downtrend line which suggests break of the mentioned
trend line could head prices higher towards 27200 levels. Yesterday’s trading session prices remained in
narrow range and have formed Doji on daily timeframe. The momentum indicator, RSI is near 60 levels
above which prices would gain momentum. COMEX Gold prices have crucial support at 1190$ levels.
MCX Silver Mar Daily Chart
Technical View:
Silver prices are trading in a range where upper and lower band remains at 37500 – 36900 levels. On daily
timeframe, prices are trading in bullish flag formation which suggests break of 37900 would test 38600
levels. COMEX Silver can test 17.85$ levels as long as 16.00$ levels are protected on down side. On hourly
timeframe the momentum indicator, RSI is at 60 levels which would give positive confirmation for prices.
05th
Dec’14 Aaj Ka Trend
Fundamental News:
• Gold steady as euro gains on ECB move, U.S. data cap gains.
• Gold futures held to steady to lower on Thursday after the European Central Bank held off on
introducing fresh stimulus measures, which sent the euro gaining and the dollar falling
• Gold and the dollar tend to trade inversely with one another, but an upbeat report on U.S. jobless
claims kept gold's gains in check, sending the precious metal into negative territory at times
• On the Comex division of the New York Mercantile Exchange, gold futures for February delivery
were down 0.09% at $1,207.60, up from a session low of $1,201.50 and off a high of $1,213.50
Pivot Levelsfor the Day:
S1 S2 S3 Pivot R1 R2 R3
Gold 26249 26148 25936 26360 26461 26572 26784
Silver 36173 35839 35263 36415 36749 36991 37567
Recommendation:
Gold
Buy
Silver
Buy
05th
Dec’14 Aaj Ka Trend
Base Metals
MCX Copper Feb Hourly Chart
Technical Views:
It can be observed from the above chart that prices have broken it’s previous intermediate high of 404
levels while the momentum indicator, RSI has also gone above 60 levels which would add bullishness to
the prices. On hourly timeframe of COMEX Copper prices have given hourly close above 2.902$ levels
which happens to be the crucial resistance for COMEX Copper prices. For now we expect once prices
breaches 404.50 levels, it can easily test 407/410 levels while downside remains protected at 400 levels
on closing basis.
MCX Aluminum Dec Hourly Chart
MCX Lead Dec Hourly Chart
MCX Nickel Dec Daily Chart
MCX Zinc Dec Hourly Chart
05th
Dec’14 Aaj Ka Trend
Fundamental News:
• Copper Rises on U.S., China Demand Outlook.
• Copper rose for the first time in three days on signs that demand will stay robust in the U.S. and
China, the world’s top metals consumers. Nickel reached a nine-week high.
• Fewer Americans filed for unemployment benefits last week, government data showed today. The
People’s Bank of China made a net injection of 30 billion yuan ($4.9 billion) this week, as the
central bank ramps up efforts to revive growth
Pivot Levels for the Day:
S1 S2 S3 Pivot R1 R2 R3
Copper 400.3 396.7 390.3 403.1 406.7 409.5 415.9
Aluminum 122.1 121.2 119.8 122.6 123.5 124.0 125.4
Lead 125.9 125.5 124.6 126.4 126.8 127.3 128.2
Nickel 1042.2 1025.4 998.9 1051.9 1068.7 1078.4 1104.9
Zinc 137.7 137.0 135.7 138.4 139.0 139.7 141.1
Recommendation:
Copper Buy
Aluminum Buy
Lead
Neutral
Nickel Buy
Zinc
Buy above 139
05th
Dec’14 Aaj Ka Trend
Energy
MCX Crude Dec Hourly Chart:
Technical Views:
From the above chart it can be observed that prices have retraced 61.8% of the previous up move from
3980-4315 levels. The current down move from 4315 – 4110 look corrective in nature where prices have
attained a-b-c equality. For now, we expect prices could now head towards 4230/4270 levels as long as
4100 levels are protected on downside on hourly closing basis. On daily timeframe hammer before few
trading session would add bullishness to the prices.
MCX Natural Gas Dec Hourly Chart:
Technical Views:
Natural gas prices drifted lower following the natural gas inventory. The momentum indicator, RSI is also
below 40 levels which indicate lack of momentum in prices. For now 224 looks on card as long as 230
levels are capped on higher side. While breach of 224 could drift prices further lower towards 216 levels.
05th
Dec’14 Aaj Ka Trend
Fundamental News:
• Crude futures fell on Thursday on news that Saudi Arabia trimmed the price of oil it exports to the
U.S. and Saudi Arabia.
• In the New York Mercantile Exchange, West Texas Intermediate crude oil futures for delivery in
January traded down 1.66% at $66.26 a barrel during U.S. trading, up from a session low of $66.13
a barrel and off a high of $68.20 a barrel.
• The January contract settled up 0.75% at $67.38 a barrel on Wednesday. Crude drops as Saudi
Arabia trims export prices.
• Copper Rises on U.S., China Demand Outlook.
• Copper rose for the first time in three days on signs that demand will stay robust in the U.S. and
China, the world’s top metals consumers. Nickel reached a nine-week high.
• Fewer Americans filed for unemployment benefits last week, government data showed today. The
People’s Bank of China made a net injection of 30 billion yuan ($4.9 billion) this week, as the
central bank ramps up efforts to revive growth.
Pivot Levels for the Day:
S1 S2 S3 Pivot R1 R2 R3
Crude 4080 4025 3891 4159 4214 4293 4427
Natural
Gas
223 219 209 230 233 240 250
Recommendation:
Crude
Buy
Natural Gas
Sell
05th
Dec’14 Aaj Ka Trend
SumeetBagadia (Associate Director) sumeet.bagadia@choiceindia.com
Ritesh Patel (Research Associate) ritesh.patel@choiceindia.com
DeveyaGaglani (Research Advisor) deveya.gaglani@chocieindia.com
For Private Circulation Only Website: www.choiceindia.com
https://twitter.com/ChoiceBroking
http://www.slideshare.net/choiceindiabroking
https://www.youtube.com/user/ChoiceBroking
https://plus.google.com/115293033595831069270/posts
https://www.facebook.com/pages/Choice-Equity-Broking-Pvt-Ltd/352491718249644
https://www.linkedin.com/company/choice-international-limited?trk=parent_company_logo
05th
Dec’14 Aaj Ka Trend
This is solely for information of clients of Choice Broking and does not construe to be an
investment advice. It is also not intended as an offer or solicitation for the purchase and sale of any
financial instruments. Any action taken by you on the basis of the information contained herein is
your responsibility alone and Choice Broking its subsidiaries or its employees or associates will not
be liable in any manner for the consequences of such action taken by you. We have exercised due
diligence in checking the correctness and authenticity of the information contained in this
recommendation, but Choice Broking or any of its subsidiaries or associates or employees shall not
be in any way responsible for any loss or damage that may arise to any person from any
inadvertent error in the information contained in this recommendation or any action taken on
basis of this information. Technical analysis studies market psychology, price patterns and volume
levels. It is used to forecast future price and market movements. Technical analysis is
complementary to fundamental analysis and news sources. The recommendations issued herewith
might be contrary to recommendations issued by Choice Broking in the company research
undertaken as the recommendations stated in this report is derived purely from technical analysis.
Choice Broking has based this document on information obtained from sources it believes to be
reliable but which it has not independently verified; Choice Broking makes no guarantee,
representation or warranty and accepts no responsibility or liability as to its accuracy or
completeness. The opinions contained within the report are based upon publicly available
information at the time of publication and are subject to change without notice. The information
and any disclosures provided herein are in summary form and have been prepared for
informational purposes. The recommendations and suggested price levels are intended purely for
trading purposes. The recommendations are valid for the day of the report however trading trends
and volumes might vary substantially on an intraday basis and the recommendations may be
subject to change. The information and any disclosures provided herein may be considered
confidential. Any use, distribution, modification, copying, forwarding or disclosure by any person is
strictly prohibited. The information and any disclosures provided herein do not constitute a
solicitation or offer to purchase or sell any security or other financial product or instrument. The
current performance may be unaudited. Past performance does not guarantee future returns.
There can be no assurance that investments will achieve any targeted rates of return, and there is
no guarantee against the loss of your entire investment.
POTENTIAL CONFLICT OF INTEREST DISCLOSURE (as on date of report) Disclosure of interest
statement – • Analyst interest of the stock /Instrument(s): - No. • Firm interest of the stock /
Instrument (s): - No.
Disclaimer

Aaj ka trend

  • 1.
    05th Dec’14 Aaj KaTrend Bullions MCX Gold Feb Daily Chart Technical View: On daily timeframe prices are trading near the downtrend line which suggests break of the mentioned trend line could head prices higher towards 27200 levels. Yesterday’s trading session prices remained in narrow range and have formed Doji on daily timeframe. The momentum indicator, RSI is near 60 levels above which prices would gain momentum. COMEX Gold prices have crucial support at 1190$ levels. MCX Silver Mar Daily Chart Technical View: Silver prices are trading in a range where upper and lower band remains at 37500 – 36900 levels. On daily timeframe, prices are trading in bullish flag formation which suggests break of 37900 would test 38600 levels. COMEX Silver can test 17.85$ levels as long as 16.00$ levels are protected on down side. On hourly timeframe the momentum indicator, RSI is at 60 levels which would give positive confirmation for prices.
  • 2.
    05th Dec’14 Aaj KaTrend Fundamental News: • Gold steady as euro gains on ECB move, U.S. data cap gains. • Gold futures held to steady to lower on Thursday after the European Central Bank held off on introducing fresh stimulus measures, which sent the euro gaining and the dollar falling • Gold and the dollar tend to trade inversely with one another, but an upbeat report on U.S. jobless claims kept gold's gains in check, sending the precious metal into negative territory at times • On the Comex division of the New York Mercantile Exchange, gold futures for February delivery were down 0.09% at $1,207.60, up from a session low of $1,201.50 and off a high of $1,213.50 Pivot Levelsfor the Day: S1 S2 S3 Pivot R1 R2 R3 Gold 26249 26148 25936 26360 26461 26572 26784 Silver 36173 35839 35263 36415 36749 36991 37567 Recommendation: Gold Buy Silver Buy
  • 3.
    05th Dec’14 Aaj KaTrend Base Metals MCX Copper Feb Hourly Chart Technical Views: It can be observed from the above chart that prices have broken it’s previous intermediate high of 404 levels while the momentum indicator, RSI has also gone above 60 levels which would add bullishness to the prices. On hourly timeframe of COMEX Copper prices have given hourly close above 2.902$ levels which happens to be the crucial resistance for COMEX Copper prices. For now we expect once prices breaches 404.50 levels, it can easily test 407/410 levels while downside remains protected at 400 levels on closing basis. MCX Aluminum Dec Hourly Chart MCX Lead Dec Hourly Chart MCX Nickel Dec Daily Chart MCX Zinc Dec Hourly Chart
  • 4.
    05th Dec’14 Aaj KaTrend Fundamental News: • Copper Rises on U.S., China Demand Outlook. • Copper rose for the first time in three days on signs that demand will stay robust in the U.S. and China, the world’s top metals consumers. Nickel reached a nine-week high. • Fewer Americans filed for unemployment benefits last week, government data showed today. The People’s Bank of China made a net injection of 30 billion yuan ($4.9 billion) this week, as the central bank ramps up efforts to revive growth Pivot Levels for the Day: S1 S2 S3 Pivot R1 R2 R3 Copper 400.3 396.7 390.3 403.1 406.7 409.5 415.9 Aluminum 122.1 121.2 119.8 122.6 123.5 124.0 125.4 Lead 125.9 125.5 124.6 126.4 126.8 127.3 128.2 Nickel 1042.2 1025.4 998.9 1051.9 1068.7 1078.4 1104.9 Zinc 137.7 137.0 135.7 138.4 139.0 139.7 141.1 Recommendation: Copper Buy Aluminum Buy Lead Neutral Nickel Buy Zinc Buy above 139
  • 5.
    05th Dec’14 Aaj KaTrend Energy MCX Crude Dec Hourly Chart: Technical Views: From the above chart it can be observed that prices have retraced 61.8% of the previous up move from 3980-4315 levels. The current down move from 4315 – 4110 look corrective in nature where prices have attained a-b-c equality. For now, we expect prices could now head towards 4230/4270 levels as long as 4100 levels are protected on downside on hourly closing basis. On daily timeframe hammer before few trading session would add bullishness to the prices. MCX Natural Gas Dec Hourly Chart: Technical Views: Natural gas prices drifted lower following the natural gas inventory. The momentum indicator, RSI is also below 40 levels which indicate lack of momentum in prices. For now 224 looks on card as long as 230 levels are capped on higher side. While breach of 224 could drift prices further lower towards 216 levels.
  • 6.
    05th Dec’14 Aaj KaTrend Fundamental News: • Crude futures fell on Thursday on news that Saudi Arabia trimmed the price of oil it exports to the U.S. and Saudi Arabia. • In the New York Mercantile Exchange, West Texas Intermediate crude oil futures for delivery in January traded down 1.66% at $66.26 a barrel during U.S. trading, up from a session low of $66.13 a barrel and off a high of $68.20 a barrel. • The January contract settled up 0.75% at $67.38 a barrel on Wednesday. Crude drops as Saudi Arabia trims export prices. • Copper Rises on U.S., China Demand Outlook. • Copper rose for the first time in three days on signs that demand will stay robust in the U.S. and China, the world’s top metals consumers. Nickel reached a nine-week high. • Fewer Americans filed for unemployment benefits last week, government data showed today. The People’s Bank of China made a net injection of 30 billion yuan ($4.9 billion) this week, as the central bank ramps up efforts to revive growth. Pivot Levels for the Day: S1 S2 S3 Pivot R1 R2 R3 Crude 4080 4025 3891 4159 4214 4293 4427 Natural Gas 223 219 209 230 233 240 250 Recommendation: Crude Buy Natural Gas Sell
  • 7.
    05th Dec’14 Aaj KaTrend SumeetBagadia (Associate Director) sumeet.bagadia@choiceindia.com Ritesh Patel (Research Associate) ritesh.patel@choiceindia.com DeveyaGaglani (Research Advisor) deveya.gaglani@chocieindia.com For Private Circulation Only Website: www.choiceindia.com https://twitter.com/ChoiceBroking http://www.slideshare.net/choiceindiabroking https://www.youtube.com/user/ChoiceBroking https://plus.google.com/115293033595831069270/posts https://www.facebook.com/pages/Choice-Equity-Broking-Pvt-Ltd/352491718249644 https://www.linkedin.com/company/choice-international-limited?trk=parent_company_logo
  • 8.
    05th Dec’14 Aaj KaTrend This is solely for information of clients of Choice Broking and does not construe to be an investment advice. It is also not intended as an offer or solicitation for the purchase and sale of any financial instruments. Any action taken by you on the basis of the information contained herein is your responsibility alone and Choice Broking its subsidiaries or its employees or associates will not be liable in any manner for the consequences of such action taken by you. We have exercised due diligence in checking the correctness and authenticity of the information contained in this recommendation, but Choice Broking or any of its subsidiaries or associates or employees shall not be in any way responsible for any loss or damage that may arise to any person from any inadvertent error in the information contained in this recommendation or any action taken on basis of this information. Technical analysis studies market psychology, price patterns and volume levels. It is used to forecast future price and market movements. Technical analysis is complementary to fundamental analysis and news sources. The recommendations issued herewith might be contrary to recommendations issued by Choice Broking in the company research undertaken as the recommendations stated in this report is derived purely from technical analysis. Choice Broking has based this document on information obtained from sources it believes to be reliable but which it has not independently verified; Choice Broking makes no guarantee, representation or warranty and accepts no responsibility or liability as to its accuracy or completeness. The opinions contained within the report are based upon publicly available information at the time of publication and are subject to change without notice. The information and any disclosures provided herein are in summary form and have been prepared for informational purposes. The recommendations and suggested price levels are intended purely for trading purposes. The recommendations are valid for the day of the report however trading trends and volumes might vary substantially on an intraday basis and the recommendations may be subject to change. The information and any disclosures provided herein may be considered confidential. Any use, distribution, modification, copying, forwarding or disclosure by any person is strictly prohibited. The information and any disclosures provided herein do not constitute a solicitation or offer to purchase or sell any security or other financial product or instrument. The current performance may be unaudited. Past performance does not guarantee future returns. There can be no assurance that investments will achieve any targeted rates of return, and there is no guarantee against the loss of your entire investment. POTENTIAL CONFLICT OF INTEREST DISCLOSURE (as on date of report) Disclosure of interest statement – • Analyst interest of the stock /Instrument(s): - No. • Firm interest of the stock / Instrument (s): - No. Disclaimer