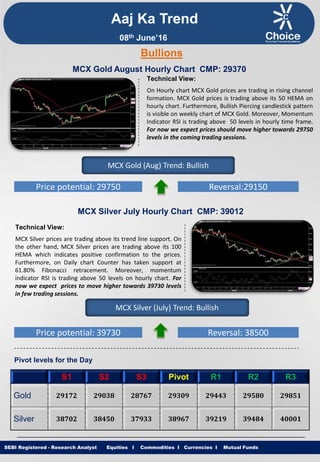
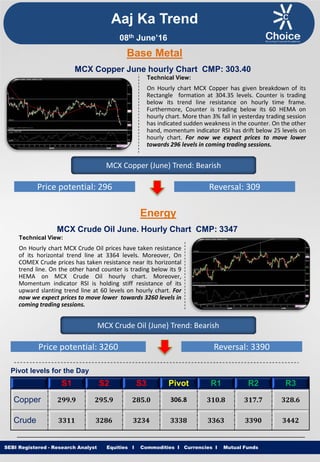
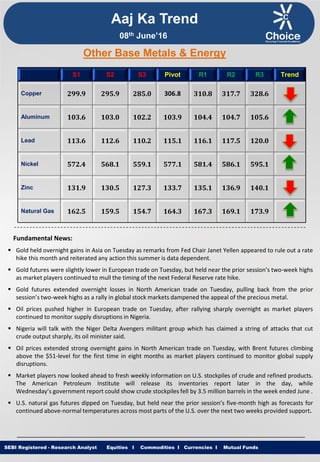
Equities I Commodities I Currencies I Mutual Funds
Aaj Ka Trend
Technical View:
On Hourly chart MCX Gold prices are trading in rising channel
formation. MCX Gold prices is trading above its 50 HEMA on
hourly chart. Furthermore, Bullish Piercing candlestick pattern
is visible on weekly chart of MCX Gold. Moreover, Momentum
Indicator RSI is trading above 50 levels in hourly time frame.
For now we expect prices should move higher towards 29750
levels in the coming trading sessions.
SEBI Registered - Research Analyst Equities I Commodities I Currencies I Mutual Funds
Bullions
MCX Gold August Hourly Chart CMP: 29370
MCX Gold (Aug) Trend: Bullish
Price potential: 29750 Reversal:29150
MCX Silver July Hourly Chart CMP: 39012
Technical View:
MCX Silver prices are trading above its trend line support. On
the other hand, MCX Silver prices are trading above its 100
HEMA which indicates positive confirmation to the prices.
Furthermore, on Daily chart Counter has taken support at
61.80% Fibonacci retracement. Moreover, momentum
indicator RSI is trading above 50 levels on hourly chart. For
now we expect prices to move higher towards 39730 levels
in few trading sessions.
MCX Silver (July) Trend: Bullish
Price potential: 39730 Reversal: 38500
Pivot levels for the Day
S1 S2 S3 Pivot R1 R2 R3
Gold 29172 29038 28767 29309 29443 29580 29851
Silver 38702 38450 37933 38967 39219 39484 40001
08th June’16
Equities I Commodities I Currencies I Mutual Funds
Technical View:
On Hourly chart MCX Copper has given breakdown of its
Rectangle formation at 304.35 levels. Counter is trading
below its trend line resistance on hourly time frame.
Furthermore, Counter is trading below its 60 HEMA on
hourly chart. More than 3% fall in yesterday trading session
has indicated sudden weakness in the counter. On the other
hand, momentum indicator RSI has drift below 25 levels on
hourly chart. For now we expect prices to move lower
towards 296 levels in coming trading sessions.
SEBI Registered - Research Analyst Equities I Commodities I Currencies I Mutual Funds
MCX Copper June hourly Chart CMP: 303.40
MCX Copper (June) Trend: Bearish
Price potential: 296 Reversal: 309
MCX Crude Oil June. Hourly Chart CMP: 3347
Technical View:
On Hourly chart MCX Crude Oil prices have taken resistance
of its horizontal trend line at 3364 levels. Moreover, On
COMEX Crude prices has taken resistance near its horizontal
trend line. On the other hand counter is trading below its 9
HEMA on MCX Crude Oil hourly chart. Moreover,
Momentum indicator RSI is holding stiff resistance of its
upward slanting trend line at 60 levels on hourly chart. For
now we expect prices to move lower towards 3260 levels in
coming trading sessions.
MCX Crude Oil (June) Trend: Bearish
Price potential: 3260 Reversal: 3390
Pivot levels for the Day
S1 S2 S3 Pivot R1 R2 R3
Copper 299.9 295.9 285.0 306.8 310.8 317.7 328.6
Crude 3311 3286 3234 3338 3363 3390 3442
Base Metal
Energy
Aaj Ka Trend
08th June’16
Equities I Commodities I Currencies I Mutual FundsSEBI Registered - Research Analyst Equities I Commodities I Currencies I Mutual Funds
Other Base Metals & Energy
S1 S2 S3 Pivot R1 R2 R3 Trend
Copper 299.9 295.9 285.0 306.8 310.8 317.7 328.6
Aluminum 103.6 103.0 102.2 103.9 104.4 104.7 105.6
Lead 113.6 112.6 110.2 115.1 116.1 117.5 120.0
Nickel 572.4 568.1 559.1 577.1 581.4 586.1 595.1
Zinc 131.9 130.5 127.3 133.7 135.1 136.9 140.1
Natural Gas 162.5 159.5 154.7 164.3 167.3 169.1 173.9
Fundamental News:
 Gold held overnight gains in Asia on Tuesday as remarks from Fed Chair Janet Yellen appeared to rule out a rate
hike this month and reiterated any action this summer is data dependent.
 Gold futures were slightly lower in European trade on Tuesday, but held near the prior session’s two-week highs
as market players continued to mull the timing of the next Federal Reserve rate hike.
 Gold futures extended overnight losses in North American trade on Tuesday, pulling back from the prior
session’s two-week highs as a rally in global stock markets dampened the appeal of the precious metal.
 Oil prices pushed higher in European trade on Tuesday, after rallying sharply overnight as market players
continued to monitor supply disruptions in Nigeria.
 Nigeria will talk with the Niger Delta Avengers militant group which has claimed a string of attacks that cut
crude output sharply, its oil minister said.
 Oil prices extended strong overnight gains in North American trade on Tuesday, with Brent futures climbing
above the $51-level for the first time in eight months as market players continued to monitor global supply
disruptions.
 Market players now looked ahead to fresh weekly information on U.S. stockpiles of crude and refined products.
The American Petroleum Institute will release its inventories report later in the day, while
Wednesday’s government report could show crude stockpiles fell by 3.5 million barrels in the week ended June .
 U.S. natural gas futures dipped on Tuesday, but held near the prior session’s five-month high as forecasts for
continued above-normal temperatures across most parts of the U.S. over the next two weeks provided support.
Aaj Ka Trend
08th June’16
Equities I Commodities I Currencies I Mutual FundsSEBI Registered - Research Analyst Equities I Commodities I Currencies I Mutual Funds
International Market
Commodity Closing Price
Gold 1247.60
Silver 16.46
Crude Oil 50.38
Brent Crude Oil 51.40
Natural Gas 2.49
COMEX/NYMEX/ICE ( Precious Metals & Energy) Currency & Commodity Index
Currency (Spot) Current Price
USD / INR 66.77
Dollar Index 93.84
EUR / USD 1.1356
CRB Index* 192.42
Closing as on 07.06.16 *Closing as on 07.06.16
LME (Base Metals) ( $ per tones)
Commodity Closing Price
Copper 4567
Aluminum 1564
Zinc 2002
Lead 1709
Nickel 8585
SHFE (Base Metals) (Yuan per tones)
Commodity Closing Price
Copper 35330
Aluminum 11760
Zinc 15575
Lead 12740
Closing as on 07.06.16 Closing as on 07.06.16
LME INVENTORY DATA
Aaj Ka Trend
01-June-16 02-June-16 03-June-16 06-June-16 07-June-16
Aluminium -8925 -4500 -7540 -6600 -6650
Copper 2625 -825 150 20725 21825
Lead -100 -100 -100 50 50
Nickel -258 -1500 -2892 -1365 738
Zinc -250 -1725 2100 -950 -800
08th June’16
Equities I Commodities I Currencies I Mutual Funds
This is solely for information of clients of Choice Broking and does not construe to be an investment advice. It is also not intended as an offer or solicitation
for the purchase and sale of any financial instruments. Any action taken by you on the basis of the information contained herein is your responsibility alone
and Choice Broking its subsidiaries or its employees or associates will not be liable in any manner for the consequences of such action taken by you. We
have exercised due diligence in checking the correctness and authenticity of the information contained in this recommendation, but Choice Broking or any of
its subsidiaries or associates or employees shall not be in any way responsible for any loss or damage that may arise to any person from any inadvertent
error in the information contained in this recommendation or any action taken on basis of this information. Technical analysis studies market psychology,
price patterns and volume levels. It is used to forecast future price and market movements. Technical analysis is complementary to fundamental analysis
and news sources. The recommendations issued herewith might be contrary to recommendations issued by Choice Broking in the company research
undertaken as the recommendations stated in this report is derived purely from technical analysis. Choice Broking has based this document on information
obtained from sources it believes to be reliable but which it has not independently verified; Choice Broking makes no guarantee, representation or warranty
and accepts no responsibility or liability as to its accuracy or completeness. The opinions contained within the report are based upon publicly available
information at the time of publication and are subject to change without notice. The information and any disclosures provided herein are in summary form
and have been prepared for informational purposes. The recommendations and suggested price levels are intended purely for trading purposes. The
recommendations are valid for the day of the report however trading trends and volumes might vary substantially on an intraday basis and the
recommendations may be subject to change. The information and any disclosures provided herein may be considered confidential. Any use, distribution,
modification, copying, forwarding or disclosure by any person is strictly prohibited. The information and any disclosures provided herein do not constitute a
solicitation or offer to purchase or sell any security or other financial product or instrument. The current performance may be unaudited. Past performance
does not guarantee future returns. There can be no assurance that investments will achieve any targeted rates of return, and there is no guarantee against
the loss of your entire investment.
POTENTIAL CONFLICT OF INTEREST DISCLOSURE (as on date of report) Disclosure of interest statement – • Analyst interest of the stock
/Instrument(s): - No. • Firm interest of the stock / Instrument (s): - No.
Disclaimer
Contact Us
Amit Pathania
Research Associate
amit.pathania@choiceindia.com
Rohan Patil
Research Associate
rohan.patil@choiceindia.com
www.choiceindia.comcustomercare@choiceindia.com
SEBI Registered - Research Analyst Equities I Commodities I Currencies I Mutual Funds
Aaj Ka Trend
08th June’16
Neeraj Yadav
Research Advisor
neeraj.yadav@choiceindia.com
Anish Vyas
Senior Research Associate
anish.vyas@choiceindia.com
Anish Vyas
Digitally signed by Anish Vyas
DN: cn=Anish Vyas, o=Choice Merchandise
Broking Pvt. Ltd, ou=Sr. Research Associate,
email=anish.vyas@choiceindia.com, c=IN
Date: 2016.06.08 08:29:17 +05'30'

Aaj ka trend 08.06.16

  • 1.
    Equities I CommoditiesI Currencies I Mutual Funds Aaj Ka Trend Technical View: On Hourly chart MCX Gold prices are trading in rising channel formation. MCX Gold prices is trading above its 50 HEMA on hourly chart. Furthermore, Bullish Piercing candlestick pattern is visible on weekly chart of MCX Gold. Moreover, Momentum Indicator RSI is trading above 50 levels in hourly time frame. For now we expect prices should move higher towards 29750 levels in the coming trading sessions. SEBI Registered - Research Analyst Equities I Commodities I Currencies I Mutual Funds Bullions MCX Gold August Hourly Chart CMP: 29370 MCX Gold (Aug) Trend: Bullish Price potential: 29750 Reversal:29150 MCX Silver July Hourly Chart CMP: 39012 Technical View: MCX Silver prices are trading above its trend line support. On the other hand, MCX Silver prices are trading above its 100 HEMA which indicates positive confirmation to the prices. Furthermore, on Daily chart Counter has taken support at 61.80% Fibonacci retracement. Moreover, momentum indicator RSI is trading above 50 levels on hourly chart. For now we expect prices to move higher towards 39730 levels in few trading sessions. MCX Silver (July) Trend: Bullish Price potential: 39730 Reversal: 38500 Pivot levels for the Day S1 S2 S3 Pivot R1 R2 R3 Gold 29172 29038 28767 29309 29443 29580 29851 Silver 38702 38450 37933 38967 39219 39484 40001 08th June’16
  • 2.
    Equities I CommoditiesI Currencies I Mutual Funds Technical View: On Hourly chart MCX Copper has given breakdown of its Rectangle formation at 304.35 levels. Counter is trading below its trend line resistance on hourly time frame. Furthermore, Counter is trading below its 60 HEMA on hourly chart. More than 3% fall in yesterday trading session has indicated sudden weakness in the counter. On the other hand, momentum indicator RSI has drift below 25 levels on hourly chart. For now we expect prices to move lower towards 296 levels in coming trading sessions. SEBI Registered - Research Analyst Equities I Commodities I Currencies I Mutual Funds MCX Copper June hourly Chart CMP: 303.40 MCX Copper (June) Trend: Bearish Price potential: 296 Reversal: 309 MCX Crude Oil June. Hourly Chart CMP: 3347 Technical View: On Hourly chart MCX Crude Oil prices have taken resistance of its horizontal trend line at 3364 levels. Moreover, On COMEX Crude prices has taken resistance near its horizontal trend line. On the other hand counter is trading below its 9 HEMA on MCX Crude Oil hourly chart. Moreover, Momentum indicator RSI is holding stiff resistance of its upward slanting trend line at 60 levels on hourly chart. For now we expect prices to move lower towards 3260 levels in coming trading sessions. MCX Crude Oil (June) Trend: Bearish Price potential: 3260 Reversal: 3390 Pivot levels for the Day S1 S2 S3 Pivot R1 R2 R3 Copper 299.9 295.9 285.0 306.8 310.8 317.7 328.6 Crude 3311 3286 3234 3338 3363 3390 3442 Base Metal Energy Aaj Ka Trend 08th June’16
  • 3.
    Equities I CommoditiesI Currencies I Mutual FundsSEBI Registered - Research Analyst Equities I Commodities I Currencies I Mutual Funds Other Base Metals & Energy S1 S2 S3 Pivot R1 R2 R3 Trend Copper 299.9 295.9 285.0 306.8 310.8 317.7 328.6 Aluminum 103.6 103.0 102.2 103.9 104.4 104.7 105.6 Lead 113.6 112.6 110.2 115.1 116.1 117.5 120.0 Nickel 572.4 568.1 559.1 577.1 581.4 586.1 595.1 Zinc 131.9 130.5 127.3 133.7 135.1 136.9 140.1 Natural Gas 162.5 159.5 154.7 164.3 167.3 169.1 173.9 Fundamental News:  Gold held overnight gains in Asia on Tuesday as remarks from Fed Chair Janet Yellen appeared to rule out a rate hike this month and reiterated any action this summer is data dependent.  Gold futures were slightly lower in European trade on Tuesday, but held near the prior session’s two-week highs as market players continued to mull the timing of the next Federal Reserve rate hike.  Gold futures extended overnight losses in North American trade on Tuesday, pulling back from the prior session’s two-week highs as a rally in global stock markets dampened the appeal of the precious metal.  Oil prices pushed higher in European trade on Tuesday, after rallying sharply overnight as market players continued to monitor supply disruptions in Nigeria.  Nigeria will talk with the Niger Delta Avengers militant group which has claimed a string of attacks that cut crude output sharply, its oil minister said.  Oil prices extended strong overnight gains in North American trade on Tuesday, with Brent futures climbing above the $51-level for the first time in eight months as market players continued to monitor global supply disruptions.  Market players now looked ahead to fresh weekly information on U.S. stockpiles of crude and refined products. The American Petroleum Institute will release its inventories report later in the day, while Wednesday’s government report could show crude stockpiles fell by 3.5 million barrels in the week ended June .  U.S. natural gas futures dipped on Tuesday, but held near the prior session’s five-month high as forecasts for continued above-normal temperatures across most parts of the U.S. over the next two weeks provided support. Aaj Ka Trend 08th June’16
  • 4.
    Equities I CommoditiesI Currencies I Mutual FundsSEBI Registered - Research Analyst Equities I Commodities I Currencies I Mutual Funds International Market Commodity Closing Price Gold 1247.60 Silver 16.46 Crude Oil 50.38 Brent Crude Oil 51.40 Natural Gas 2.49 COMEX/NYMEX/ICE ( Precious Metals & Energy) Currency & Commodity Index Currency (Spot) Current Price USD / INR 66.77 Dollar Index 93.84 EUR / USD 1.1356 CRB Index* 192.42 Closing as on 07.06.16 *Closing as on 07.06.16 LME (Base Metals) ( $ per tones) Commodity Closing Price Copper 4567 Aluminum 1564 Zinc 2002 Lead 1709 Nickel 8585 SHFE (Base Metals) (Yuan per tones) Commodity Closing Price Copper 35330 Aluminum 11760 Zinc 15575 Lead 12740 Closing as on 07.06.16 Closing as on 07.06.16 LME INVENTORY DATA Aaj Ka Trend 01-June-16 02-June-16 03-June-16 06-June-16 07-June-16 Aluminium -8925 -4500 -7540 -6600 -6650 Copper 2625 -825 150 20725 21825 Lead -100 -100 -100 50 50 Nickel -258 -1500 -2892 -1365 738 Zinc -250 -1725 2100 -950 -800 08th June’16
  • 5.
    Equities I CommoditiesI Currencies I Mutual Funds This is solely for information of clients of Choice Broking and does not construe to be an investment advice. It is also not intended as an offer or solicitation for the purchase and sale of any financial instruments. Any action taken by you on the basis of the information contained herein is your responsibility alone and Choice Broking its subsidiaries or its employees or associates will not be liable in any manner for the consequences of such action taken by you. We have exercised due diligence in checking the correctness and authenticity of the information contained in this recommendation, but Choice Broking or any of its subsidiaries or associates or employees shall not be in any way responsible for any loss or damage that may arise to any person from any inadvertent error in the information contained in this recommendation or any action taken on basis of this information. Technical analysis studies market psychology, price patterns and volume levels. It is used to forecast future price and market movements. Technical analysis is complementary to fundamental analysis and news sources. The recommendations issued herewith might be contrary to recommendations issued by Choice Broking in the company research undertaken as the recommendations stated in this report is derived purely from technical analysis. Choice Broking has based this document on information obtained from sources it believes to be reliable but which it has not independently verified; Choice Broking makes no guarantee, representation or warranty and accepts no responsibility or liability as to its accuracy or completeness. The opinions contained within the report are based upon publicly available information at the time of publication and are subject to change without notice. The information and any disclosures provided herein are in summary form and have been prepared for informational purposes. The recommendations and suggested price levels are intended purely for trading purposes. The recommendations are valid for the day of the report however trading trends and volumes might vary substantially on an intraday basis and the recommendations may be subject to change. The information and any disclosures provided herein may be considered confidential. Any use, distribution, modification, copying, forwarding or disclosure by any person is strictly prohibited. The information and any disclosures provided herein do not constitute a solicitation or offer to purchase or sell any security or other financial product or instrument. The current performance may be unaudited. Past performance does not guarantee future returns. There can be no assurance that investments will achieve any targeted rates of return, and there is no guarantee against the loss of your entire investment. POTENTIAL CONFLICT OF INTEREST DISCLOSURE (as on date of report) Disclosure of interest statement – • Analyst interest of the stock /Instrument(s): - No. • Firm interest of the stock / Instrument (s): - No. Disclaimer Contact Us Amit Pathania Research Associate amit.pathania@choiceindia.com Rohan Patil Research Associate rohan.patil@choiceindia.com www.choiceindia.comcustomercare@choiceindia.com SEBI Registered - Research Analyst Equities I Commodities I Currencies I Mutual Funds Aaj Ka Trend 08th June’16 Neeraj Yadav Research Advisor neeraj.yadav@choiceindia.com Anish Vyas Senior Research Associate anish.vyas@choiceindia.com Anish Vyas Digitally signed by Anish Vyas DN: cn=Anish Vyas, o=Choice Merchandise Broking Pvt. Ltd, ou=Sr. Research Associate, email=anish.vyas@choiceindia.com, c=IN Date: 2016.06.08 08:29:17 +05'30'