Download to read offline
![IOSR Journal of Electrical and Electronics Engineering (IOSR-JEEE)
e-ISSN: 2278-1676,p-ISSN: 2320-3331, Volume 10, Issue 2 Ver. III (Mar – Apr. 2015), PP 01-05
www.iosrjournals.org
DOI: 10.9790/1676-10230105 www.iosrjournals.org 1 | Page
Online Model Based Control of Pv-Converter Unit for Maximum
Power Point Tracking
Samuel Hyginus1
, Geetha Kiranmayee Sathi2
(Design Engineer, Sustain Energy Solutions Ltd, United Kingdom)
(Graduate Electrical Engineer, Hyder Consulting, United Kingdom)
Abstract: Partial Shading is an important issue in PV Panels. It occurs due to the non-uniform illumination of
a PV Panel or a part of it. This decreases the overall output of the PV Panel. As a result of partial shading, the
unshaded cells cause a reverse bias on the shaded cell and hence large power is dissipated on the shaded cells,
thus overheating the shaded cell which results in glass crack or melting/degradation of the solar cell. This is
called Hot-spot. Here different control strategies are analysed and investigated for maximum power point
tracking capabilities for maximum power generation of the photovoltaic panel under partial shading conditions.
An online model based control of PV-Converter unit is presented in this project. This will involve practical tests
as well as simulations done in MATLAB and SIMULINK.
Keywords: Partial Shading, Photo Voltaic, Hot-spots, Maximum Power Point Tracking, Buck Converter
I. Introduction
There is a great substantial rise in the global energy demand over the past few years. This is limited due
to the enormous shortage in the conventional energy reserves and this is mainly accelerated due to the
environmental issues that are often caused by mankind. It is the duty of every man to make the effect use of the
energy available keeping in mind the future generation. Another fact that has led to the growth in energy
demand is the rise in population. In addition to this, the amount of carbon dioxide produced has increased
drastically and this has contributed a lot to global warming. This situation should be dealt wisely in terms of
increasing the ways of generating energy from many different alternative technologies in an environment
friendly manner [1].
Partial shading issues in PV panels are posing a great challenge in the solar PV industry. This problem
has been a topic of discussion for past few years in this field of study. As a result of partial shading, the
performance of the PV panels is reduced to a great extend thus hindering the extraction of electricity generated
by solar PV cells during uneven solar irradiation. The non-uniform illumination of solar irradiation on PV
panels leads to the reverse bias of the shaded cell thus causing the shaded cell to behave like a load. This way
large amount of heat is dissipated on the shaded cell thus degrading the overall PV panel by creating glass
cracks on the surface of the panel called hotspots. The overall PV system is irreversibly damaged and thereby
this issue is a major concern in the PV industry [2].
Previously the above problem was overcome by using by-pass and blocking diodes to each PV panel
which is connected in series or parallel respectively. The method introduced in this article however does not
eliminate partial shading but has the ability to reduce the effect of partial shading to a great extent. A new
Maximum Power Point Tracking (MPPT) model has been designed such that a logarithmic equation is
developed for calculating the maximum power point voltage under different weather conditions i.e. irradiance
and temperature. This method is described in detail in the following chapters to come.
II. Pv Panels Under Partial Shading
Partial shading is an issue which arises from the non-uniform illumination of sunlight over the PV
Panel surface due to obstacles like a shadow from a building, cloud, a bird, a tree leaf that’s present on the panel
surface etc. These obstacles can be sectioned into two types, static and dynamic. Static obstacle can be
explained as stationary dirt and dynamic obstacle can be labelled as a moving object like a moving cloud. As a
result of the shadow caused by these obstacles on the panel surface, the overall output of the panel is highly
affected in terms of both the efficiency and performance of the PV panel. During this condition, the photo
voltaic solar cell which is shaded behaves as a load to the entire panel and hence heat is dissipated on this cell
causing the glass to crack and thereby creating hotspots which damage the PV system [3].
The different levels of irradiation on the panel can be uniform over the complete surface of the PV
module or non-uniform i.e. a part of the panel may be partially shaded whether it is a PV array, multiple array or
module etc. When a string of PV cells having more than one bypass diodes are considered having irradiance
with different light intensities, multiple maximum power peaks can be observed. This can affect the different
MPPT techniques used for extracting maximum power from each panel individually. Extensive Research is](https://image.slidesharecdn.com/a010230105-160705061656/85/A010230105-1-320.jpg)
![Online Model Based Control of Pv-Converter Unit for Maximum Power Point Tracking
DOI: 10.9790/1676-10230105 www.iosrjournals.org 2 | Page
being carried out for eliminating this problem and one of the solutions include calculating the MPPT for voltage
and power of a given shadow pattern and intensity. This study is carried out for evaluation the overall
performance of the PV system under such partial shading conditions [4, 5].
III. New Model For Mpp Voltage Prediction
Maximum efficiency is obtained from a PV system by achieving a proper match of various parameters
like PV generating systems, irradiation variations along with different changes in temperature. Hence this way,
the maximum power is harnessed from the PV panel using different control strategies by altering the above
given parameters. This is called maximum power point tracking of the PV system [6].
This section introduces a new design model which is used for the prediction of the maximum power
point voltage under different conditions of irradiance and temperature. The value of this MPP voltage is directly
calculated from the values of the irradiance and cell temperature measurements using the method explained
below. Firstly, the PV panel is simulated for different values of irradiance from 10 to 100 at a given reference
temperature. This way the panel is simulated in the same conditions but with a different temperature now. The
different values of irradiance, cell temperature, PV current, PV voltage and the respective maximum power
points are noted down respectively.
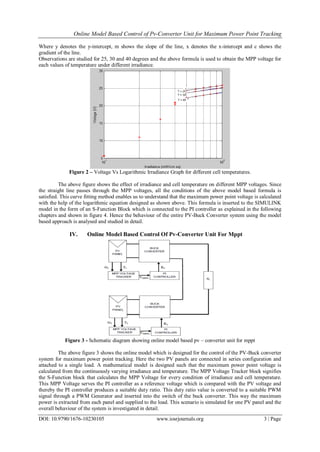
Figure 1 – Predicted MPP Voltage Vs Irradiance for 250
C and 300
C
The above voltage vs irradiance graph shows the different predicted MPP voltages for two temperatures of 25
and 30 and this data is obtained from the Simulink model. In this plot, the x-axis denotes the irradiance in
logarithmic format and y-axis denotes the voltage. Using the observation made from the above graph, a new
logarithmic relation between the maximum power point voltage and irradiance is established.
The maximum power point Voltage, VMPP is expressed as
The above equation consists of various terms such as m which denotes the slope, G showing the irradiance,
is the initial voltage, k indicating the temperature gradient, which refers the cell temperature and the
reference temperature, .
The slope m is calculated as,
is calculated as the initial voltage at that reference temperature which is considered.
K shows the temperature coefficient such that the maximum power point voltage is shifting per degree Celsius.
This is calculated as
denotes the difference in temperature i.e.
shows the difference between the cell temperature and the reference temperature.
The cell temperature is expressed as,
refers to the ambient temperature.
This equation (3.5.1) is design in such a way that it follows the equation of the straight line which is stated as,](https://image.slidesharecdn.com/a010230105-160705061656/85/A010230105-2-320.jpg)
![Online Model Based Control of Pv-Converter Unit for Maximum Power Point Tracking
DOI: 10.9790/1676-10230105 www.iosrjournals.org 5 | Page
VI. Conclusion
The study of partial shading has been the main topic of interest in this report. The fundamentals of PV
and their operation were studied and analysed through various research papers. The concept of partial shading
has brought out a great challenge in the solar PV industry and extensive research in carried out in this field till
date and will continue to in the years to come. A model based PV-Converter unit is designed for MPPT. In this
model, the MPP voltage is determined by a formula which is formulated by using the values from the Voltage
Vs Irradiance characteristics in a logarithmic format. T`his technique has proved to be very useful for rapid
change in weather conditions in terms of temperature change and irradiance. Since the model is working and the
MPP voltage is calculated when the PV is in operation, this system is termed as the online model based PV-
Converter Unit for MPPT.
Looking at the future scope for this model developed, a no. of methods can be implemented to enhance
the operation of the PV system. The designed online can be attached to a multilevel inverter for connection to
the utility grid. This method can be implemented on a large scale by attaching n number of PV panels in series
and overall behaviour of the system can be investigated under partial shading conditions. Different multilevel
inverters can be analysed to make sure the power is delivered with less harmonics. Due to the continuous supply
of current from the PV to the input of the Buck converter, this capacitor can be replaced by a super- capacitor
(SC). Super-capacitor has the flexible property of charging and discharging and this can be of application to
Flexible AC Transmission Systems (FACTS).
References
[1]. S.C.W. Krauter, Solar Electric Power Generation - Photovoltaic Energy Systems: Modeling of Optical and Thermal Performance,
Electrical Yield, Energy Balance, Effect on reduction of Greenhouse Gas Emissions. Berlin: Springer-Verlag, 2006.
[2]. L. Gao, R. A. Dougal, S. Liu, and A. P. Iotova, "Parallel-Connected Solar PV System to Address Partial and Rapidly Fluctuating
Shadow Conditions," IEEE Transactions on Industrial Electronics, vol.56, no.5, pp.1548-1556, 2009
[3]. Markvart T.: “Solar Electricity”, John Wiley & Sons, 1994
[4]. J. Nelson, The physics of solar cells, London: Imperial College Press, 2003.
[5]. H. Kawamura, K. Naka, N. Yonekura, S. Yamanaka, H. Kawamura, H. Ohno, and K. Naito, “Simulation of I–V characteristics of a
PV module with shaded PV cells,” Solar Energy Mater. Solar Cells, vol. 75, no. 3/4, pp. 613–621, Feb. 2003.
[6]. C. Ben Salah, M. Ouali, “Comparision of Fuzzy Logic and Neural Network in Maximum Power Point Tracker for PV Systems,”
Electric Power Systems Research, Vol. 81, pp. 43-50, July 2010.](https://image.slidesharecdn.com/a010230105-160705061656/85/A010230105-5-320.jpg)

This document summarizes research on developing an online model-based control system for a photovoltaic (PV) converter unit to track the maximum power point under varying conditions like partial shading. It presents a new model that uses a logarithmic equation to predict the maximum power point voltage based on irradiance and temperature measurements. The model was tested in simulations where it accurately adjusted the PV voltage to match the predicted maximum power point voltage in response to changes in irradiance and temperature. This online model-based approach shows potential for improving PV power extraction under non-uniform conditions like partial shading.


![5G Explained! A High Level Overview [Introduction]](https://cdn.slidesharecdn.com/ss_thumbnails/5gexplainedahighleveloverview-260119165306-cc137a3e-thumbnail.jpg?width=640&height=640&fit=bounds)


