This study investigates the impact of partial shading on photovoltaic (PV) modules and presents a novel variable step size perturb and observe (P&O) algorithm with a checking mechanism to improve maximum power point tracking (MPPT) efficiency. The research highlights the challenges posed by partial shading, such as reduced voltage and current output and the existence of multiple maximum power points, complicating traditional MPPT methods. Utilizing MATLAB simulations and experimental validation, the proposed algorithm aims to enhance power extraction from PV systems under varying irradiation conditions.
![International Journal of Electrical and Computer Engineering (IJECE)
Vol. 7, No. 1, February 2017, pp. 29~40
ISSN: 2088-8708, DOI: 10.11591/ijece.v7i1.pp29-40 29
Journal homepage: http://iaesjournal.com/online/index.php/IJECE
A Study of Shading Effect on Photovoltaic Modules with
Proposed P&O Checking Algorithm
Rozana Alik1
, Awang Jusoh2
, Tole Sutikno3
1,2
Faculty of Electrical Engineering, Universiti Teknologi Malaysia, 81310 Skudai, Malaysia
3
Department of Electrical Engineering, Universitas Ahmad Dahlan, Yogyakarta, Indonesia
Article Info ABSTRACT
Article history:
Received Nov 9, 2016
Revised Jan 15, 2017
Accepted Jan 29, 2017
Sun irradiation levels and associated temperature changes are the main
factors that influence the conversion of solar energy into electricity. Most
energy is produced during a hot sunny day as the sun irradiation is at the
maximum level and uniform throughout the solar photovoltaic (PV).
However, most solar PV were frequently get shadowed, completely or
partially, by the neighbouring buildings, trees and passing clouds.
Consequently, the solar PV has lower voltage and current output, hence,
multiple maximum power points (MPP) are existed on the PV curve, which
could cause confusion to the conventional Maximum Power Point Tracker
(MPPT) to track the true MPP for the PV system. Thus, it is important to
examine the impacts of partial shading on the solar PV in order to extract the
maximum possible power. This paper presents a MATLAB-based modelling
for simulation and experimental setup to study the I-V and P-V
characteristics of a solar module under a non-uniform irradiation due to
partial shading condition (PSC). Furthermore, this study is also proposed an
effective method (a variable step size of P&O with checking algorithm) that
is low cost and higher tracking efficiency. Thus, this study is essential in
improving and evaluating any new MPPT algorithm under the PSC.
Keyword:
Irradiance
Partial shading
PV system
Solar PV
Copyright © 2017 Institute of Advanced Engineering and Science.
All rights reserved.
Corresponding Author:
Rozana Alik,
Faculty of Electrical Engineering,
Universiti Teknologi Malaysia,
81310 Skunai, Malaysia.
Email: rozana26@live.utm.my
1. INTRODUCTION
Most of energy experts believe that more than 50% of world’s electricity in year 2050 are generated
by renewable energies and 10% of it are coming from solar-power technology [1]. The application of solar
energy in power generation has attracted the research attention due to its cleanness, efficient, and
environmental renewable and sustainable energy resource [2]. It is known that Malaysia was located at the
equator of the earth and receive particularly abundant of solar source. An average daily radiation that
received by Malaysia is approximately in between 4.21kWh/m2
to 5.56kWh/m2
. The total installed PV
capacity by 2010 was 20493MW which expected to reach the 23099MW of maximum-demand capacity in
2020 [3].
The solar-power technology are increasingly utilized in several applications such as water pumping,
electrical vehicles, PV power plants and hybrid systems as well as, military and space applications [4], [5].
However, extracting maximum power from PV array is a challenging task as the output of solar PV is
varying according to the temperature and solar insolation [6]. Based on the observation made, the distinction
of output power caused by temperature is not obvious compared with the solar PV that been exposed to the
different level irradiance. Furthermore, the extraction of maximum output power became harder when](https://image.slidesharecdn.com/04-200928025746/75/A-Study-of-Shading-Effect-on-Photovoltaic-Modules-with-Proposed-P-O-Checking-Algorithm-1-2048.jpg)
![ ISSN: 2088-8708
IJECE Vol. 7, No. 1, February 2017 : 29 – 40
30
partially of PV array is shaded due to some part of sun rays are being blocked by dust, cloud, trees and
nearby buildings [7-9].
Partial shading is a critical condition in photovoltaic arrays operation. The shaded cells will most
likely be driven to operate at reverse-biased voltage as the unshaded cells will force their own current
because of receiving lower irradiance compared to the others [10]. Consequently, the shaded cells will
produce high resistance which consume more power and reduces the load current. This has caused the cell’s
temperature to increase, called ‘hot spot phenomenon’. This heat might damage the shaded cells under
certain conditions. Besides, non-uniform irradiance would cause multiple peak points on the Power-Voltage
(PV) characteristics [11].
Maximum power point tracking (MPPT) is one of an effective control method to extract and
maintain the maximum available power from the solar PV [11-13]. More than 30 distinct MPPT techniques
have been introduced and applied all over the world [14]. Each technique has their own features which differ
in terms of complexity, cost, efficiency, sensor used and tracking accuracy especially when the temperature
or irradiation varies [15]. Most tracking controller nowadays are using Perturb and Observe (P&O) as the
MPPT algorithm due to its simplicity of implementation and independence to PV array parameters [15-21].
Nevertheless, the conventional P&O MPPT have two major drawbacks; steady state oscillation due to fixed
step size and incapability to track the global MPP during partial shading condition. There were numbers of
other methods that also available, for example, Fractional Short Circuit Current (SCC) [22] that envisages the
optimal current by using short circuit current and Fractional Open Circuit Voltage (OCV) [23] that estimates
the optimal voltage by providing open circuit voltage for the tracking process. Besides, several researchers
were suggesting the soft computing methods such as Artificial Neural Network (ANN) [24-26], Fuzzy Logic
Control (FLC) [27] and Particle Swarm Optimization (PSO) [28] since most of these techniques were capable
in ensuring a good performance in atmospheric conditions. However, the efficiency of these methods were
mainly depending on the user’s knowledge. The users require to have at least background knowledge about
solar PV configuration in order to effectively utilize the optimization technique, especially the PSO method.
Therefore, the significant of this study is to understand the impacts of partial shading on the series
connected cells (PV modules) and examine the PV characteristics under partial shading condition. The model
was simulated using MATLAB/Simulink simulation model and the study was validated with experimental
results of 50W commercial module. This paper also presents a variable step size of P&O with checking
algorithm to overcome the disadvantages of conventional P&O MPPT for partially shaded solar PV. This
paper is organized as follows: Section 2 presents explanation on the theory of shading effect for PV module.
Section 3 elaborates the characteristics of PV model as well as the I-V characteristic under uniform and non-
uniform irradiation. The importance and advantages of the proposed algorithm will be explained in Section 4.
Section 5 provides the simulation and experimental methodology to explain the shading effect practically.
Next, Section 6 presents simulation and experimental results for shading effects on PV module. This Section
also presents the simulation results and analysis for PV and load outputs when PV system is connected with
variable step size P&O MPPT and proposed algorithm under partial shading condition. Finally, Section 7
highlights the significant points of this study.
2. PARTIAL SHADING CONDITION
It is infrequent to have uniform and constant irradiation all the times in real life. The radiation
intensity would be vary and some solar PV could be partially shaded causing less efficiency to the PV
system. Figure 1 illustrates an example of module that contain two strings; each string has three solar cells
connected in series.
Figure 1. Example of Solar Module Configuration under Partial Shading Condition
Bypass
diode
String 1
String 2
500W/m2
Bypass
diode
1000W/m2
1000W/m2
1000W/m2
1000W/m2
1000W/m2](https://image.slidesharecdn.com/04-200928025746/75/A-Study-of-Shading-Effect-on-Photovoltaic-Modules-with-Proposed-P-O-Checking-Algorithm-2-2048.jpg)
![IJECE ISSN: 2088-8708
A Study of Shading Effect on Photovoltaic Modules with Proposed P&O Checking Algorithm (Rozana Alik)
31
Basically, when one of solar cell in the string is having lesser amount of irradiance, it would produce
smaller current compared to the unshaded cells. Since the solar cells are in series connection, every cells
should have the same amount of current. Thus, the unshaded cells will impose the shaded cells to yield more
current than their short circuit current and causing the shaded cells to operate at a negative voltage.
Consequently, a net voltage loss occurred in the system and the shaded cells will act as a load which is
absorbing power instead of producing power to the system. As a result, the partially shaded string will
become open circuit and the bypass diode will be active to allow the current flow, hence the module would
have lower current and power output compare to the other modules that have uniform insolation [4], [6], [8].
As the shaded cells are dissipating power and heat, the temperature of the shaded cells would
increase and lead to local heating, thermal stress as well as resulting in total failure to the solar PV [29].
Besides, these phenomenon also caused the characteristic curves to become nonlinear curves and have
multiple peak points which will be explained in detail in the next Section [30].
3. PHOTOVOLTAIC (PV) CHARACTERISTICS
Photovoltaic (PV) cells can be connected in series or parallel configuration, group as a module and
combined to form panels. The panels are connected together to build up the entire PV array [31].
Theoretically, the ideal solar cell can be modelled as current source in anti-parallel with a diode as shown in
Figure 2. The direct current would be generated as the cell is been exposed to the light. A shunt resistor and
series resistor are included to improve the solar cell model [32].
The PV characteristic equation based on the Figure 2 can be represent as in Equation (1). The
equation explains the electrical behaviour and defines the relationship between voltage and current supplied
by the PV module [33], [34]:
Figure 2. Theoretical circuit for solar cell
( (
( )
⁄ ) ) (
( )
⁄ ) (1)
where Ns= number of cells in series, Iph = current produced by the photoelectric effect, Is = reverse saturation
current, Rs = inherent resistance in series, Rsh= inherent resistance in parallel, k = Boltzmann’s constant,
α= ideality factor modified, T = cell’s temperature
In relation to the assumption, the complete behaviour of solar cell is described by five parameters,
Ns, Iph, Is, Rs and Rsh. Both Iph and Is, which vary based on the environmental conditions (irradiation and
temperature) [35]. Iph depends on solar irradiation (G) and temperature (T) while Is changes based on the
temperature (T) as depicted in the equations below,
[ ( )] ⁄ (2)
( )
(
( )
)
⁄ (3)
where ki= short circuit current temperature coefficient, kv = open circuit voltage temperature coefficient,
Iph = current produced by the photoelectric effect, I*sc = short circuit current at standard test condition (STC),](https://image.slidesharecdn.com/04-200928025746/75/A-Study-of-Shading-Effect-on-Photovoltaic-Modules-with-Proposed-P-O-Checking-Algorithm-3-2048.jpg)
![ ISSN: 2088-8708
IJECE Vol. 7, No. 1, February 2017 : 29 – 40
32
V*oc = open circuit voltage at standard test condition (STC), G* = 1000W/m2
, T* = cell temperature,
vt = thermal voltage.
In addition, it is compulsory to know the operating voltage and current (I-V and P-V curve) for
certain states that the solar PV can work in order to control and evaluate the solar cell performance [31].
Figure 3(a) and (b) depict the characteristic curves for I-V and P-V for a given radiation intensity (G)
respectively. The module appeared to have varied output power as the irradiation is changing. Besides, it
should be noted that the module would has zero current (no load or in vacuum) at the open circuit voltage
(Voc) point and zero voltage (short circuit load) at the short circuit current (Isc) point. These characteristic
curves would also depend on the cell’s temperature as referred to Equation (1). This paper is neglecting the
effect of the cell’s temperature and has been assumed to be standard temperature, 25 ºC. The maximum
power point for each curve is different according to various level of irradiation. Hence, it is important to
ensure the solar PV to work at this point for the best efficiency.
(a) (b)
Figure 3. Characteristic Curves under different Irradiation: (a) I-V Curve, (b) P-V Curve
4. PROPOSED MPPT ALGORITHM
Researchers nowadays are trying hard to find solution on overcoming the problems created by
partially shaded of solar PV. Thus, it is very important to compare and analyse the existing technique in order
to find most suitable and reliable method. Reference [37] proposed a modified P&O algorithm that used 85%
of the open circuit voltage (Voc) as the voltage reference (Vref) and the perturb voltage (ΔV) is large enough
so that the curve can be scanned faster and easier. The authors managed to reduce the tracking time by 90%
compared to conventional method. Yet, this method has been verified with PV array configuration which
suits only for grid connection application.
Meanwhile, reference [38] introduced a perturbative method that used a pair of voltage and current
sensors. The simulation results showed the overall efficiency has increased up to above 95%. Nonetheless,
this method requires two sensors to operate which cost more than other method. By using second stage
evaluation (checking system) as stated in reference [39], the P&O method have become more effective and
accurate. The experimental results show that the system is capable to find the real MPP in any condition and
the system speed performance increases. However, the results show some steady state oscillation problem
which lead to lower efficiency. Moreover, reference [15] proposed a fuzzy logic control to create variety step
size convergence for the P&O tracker. As the results, the improve P&O MPPT has boost up the steady state
and performance of the PV system but still unable to track the real MPP when solar PV undergo partial
shading condition.
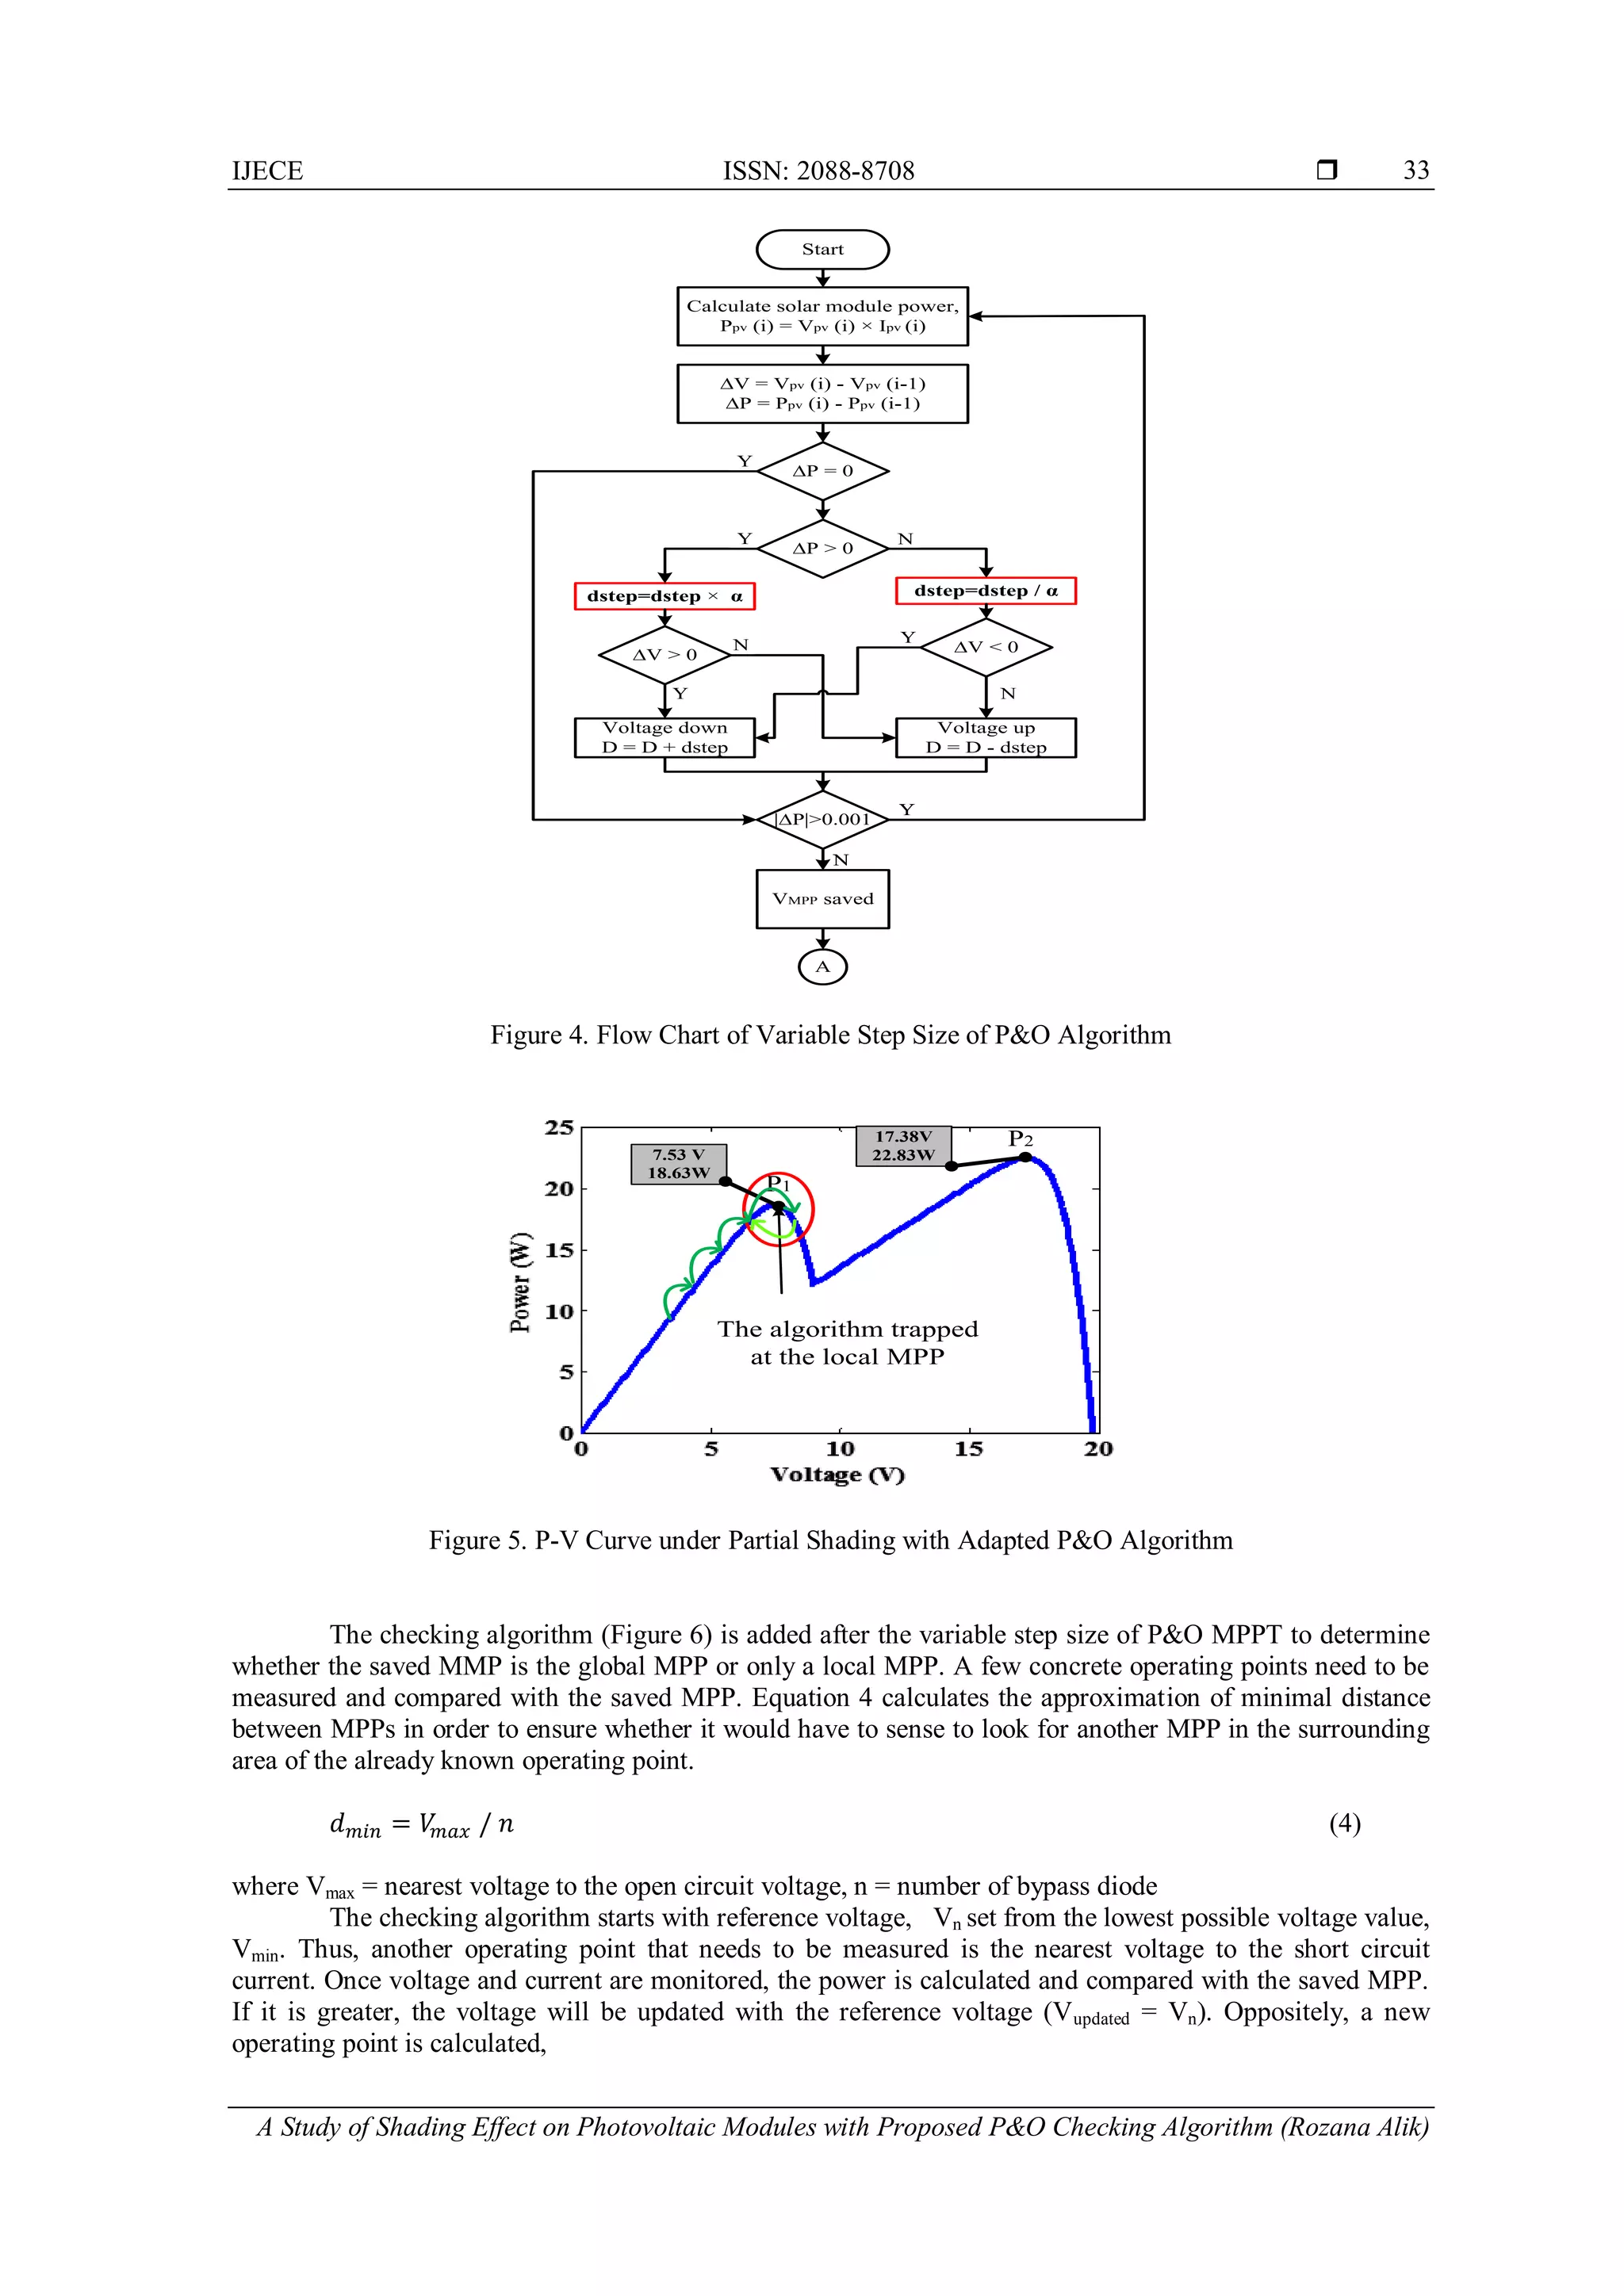
The main idea of this proposed method is combining a variable step size of P&O algorithm [40] and
checking algorithm [39]. Figure 4 shows the variable step size of P&O algorithm where the conventional
P&O algorithm is modified to have variable step size instead of constant step size so that the response time
would be increase and the oscillation rate at the output side would be lower. As the absolute ∆P is lower than
0.001, indicate that one peak point has been reached and tracked. Yet, it is still unable to track the global
MPP which usually get confused and trapped at the local MPP as shown in Figure 5. Therefore, the algorithm
need to be modified again in order to ensure the algorithm is tracking the real MPP.](https://image.slidesharecdn.com/04-200928025746/75/A-Study-of-Shading-Effect-on-Photovoltaic-Modules-with-Proposed-P-O-Checking-Algorithm-4-2048.jpg)
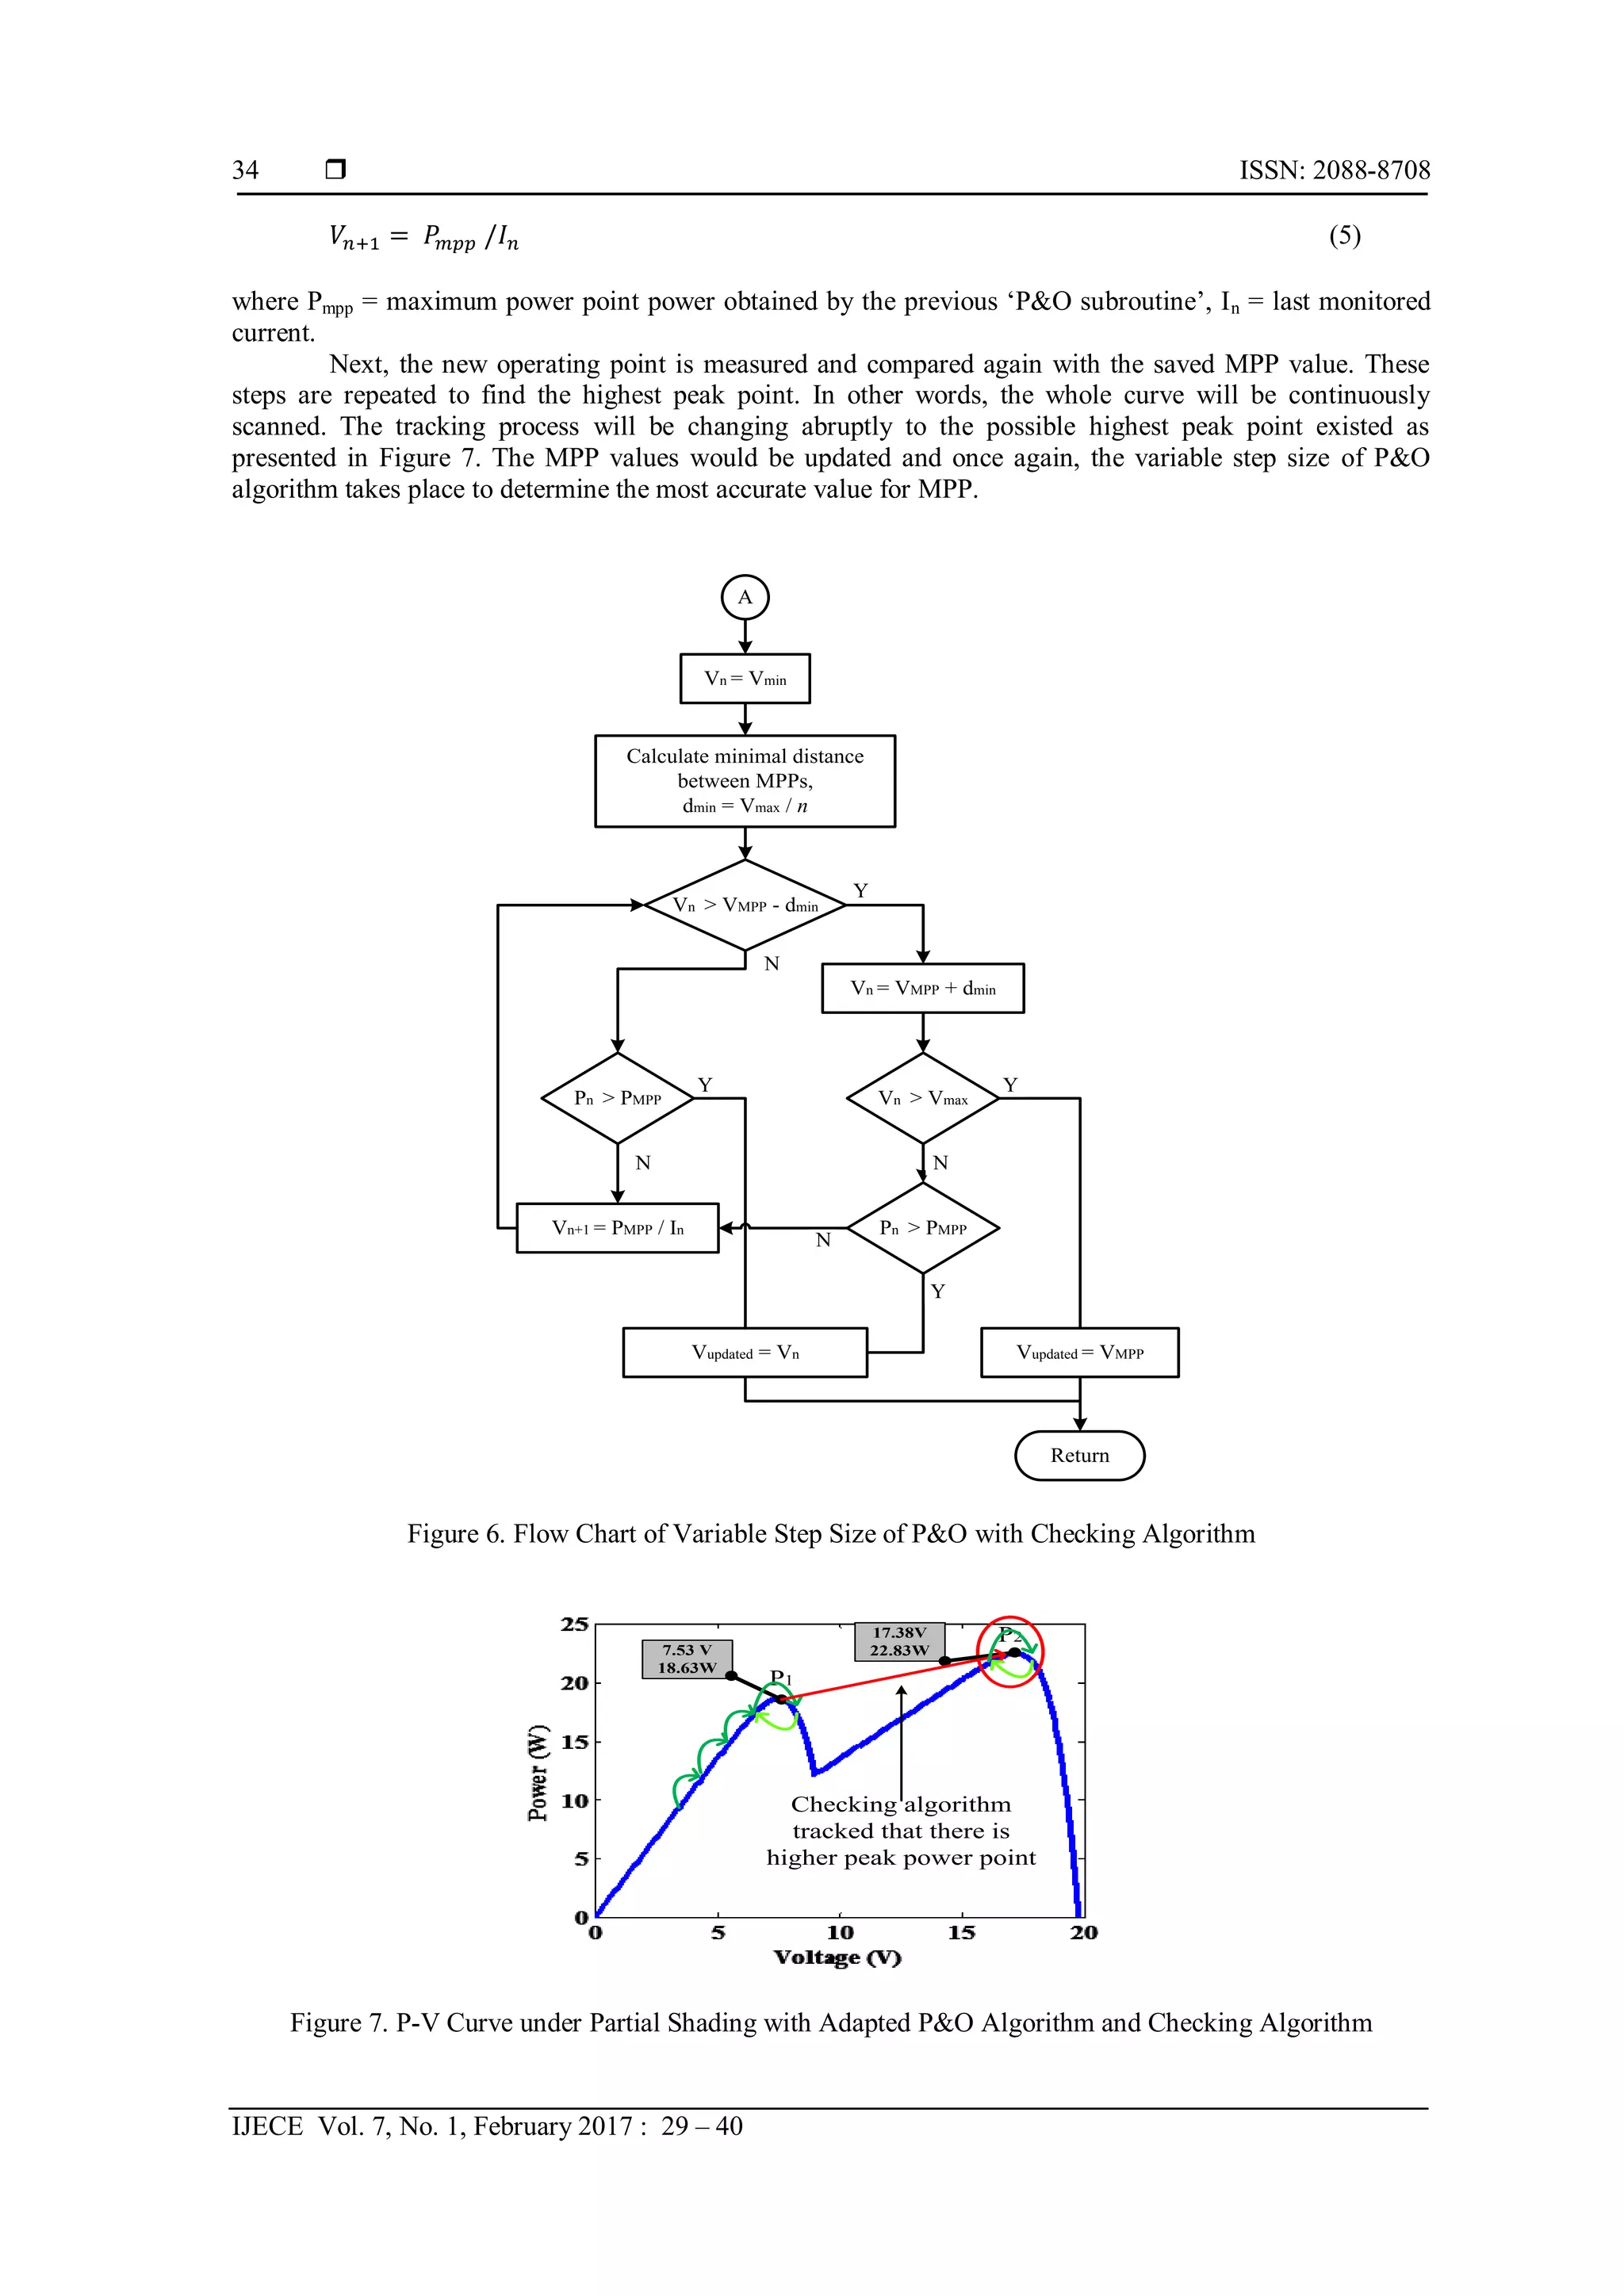
![IJECE ISSN: 2088-8708
A Study of Shading Effect on Photovoltaic Modules with Proposed P&O Checking Algorithm (Rozana Alik)
35
5. SIMULATION AND EXPERIMENTAL PROCEDURE FOR SHADING EFFECT
To examine the shading effect on the solar modules, a module consists of 36 solar cells series-
connected is modelled in MATLAB/Simulink as shown in the Figure 8. Two values of irradiance (1000W/m2
and 500W/m2
) are given to the solar module per time to simulate the solar module under partial shading
condition.
Figure 8. MATLAB/ Simulink Model
The solar module configuration in Figure 9 is modelled by referring the selected PV module used for
experimental work which contains 36 solar cells and two bypass diode. The block model of solar cells used
in the simulation have been parametrized with five parameters as listed in the Table 1. All parameters except
for quality factors and series resistance are set according to the given specifications by the manufactures. The
other two parameters are calculated by referring [34] to provide the most suitable value for the solar module.
The output current, voltage and power were plotted by using the obtained data in the workspace.
Figure 9. Solar Module Configuration for MATLAB Simulation
Table 1. Parameters Set for 36 Series-Connected Solar Cells
Parameters Value
Short circuit current, Isc 2.7 A
Open circuit voltage, Voc 0.57 V
Irradiance used for measurements, Ir0 1000 W/m2
Quality factor, N 1.3
Series resistance, Rs 2.7e-3 Ω
The simulation results are then validating by an experimental set up as presented in Figure 10.
Table 2 depicts the electrical specifications for the chosen solar module. Three phase variac transformer is
used to vary the voltage supply for the halogen bulb. The maximum voltage used is 240V DC supply which](https://image.slidesharecdn.com/04-200928025746/75/A-Study-of-Shading-Effect-on-Photovoltaic-Modules-with-Proposed-P-O-Checking-Algorithm-7-2048.jpg)
![ ISSN: 2088-8708
IJECE Vol. 7, No. 1, February 2017 : 29 – 40
36
can contribute for approximately 1000 W/m2
of irradiance. Therefore, the brightness of halogen bulb
(irradiance) is adjusted using potentiometer. In order to have DC voltage supply for the halogen bulb, a three
phase rectifier is connected between the variac transformer and the main switch.
The xenon lamps are said to be the most efficient to simulate the solar spectrum but seems to be
costly. Alternatively, halogen light bulbs are utilized in this study. The solar simulator shown in the Figure 6
consists of 36 halogen light bulbs (50W/240V). The bulbs were placed right at the top centre of each solar
cells. Throughout the experiment, the halogen lamp appears to produce hot light rays and might damage the
solar cell. Therefore, an aquarium filled with water is put between the halogen lamp and the solar
module [36].
A piece of paper is purposely put onto solar module to have partial shading condition for the system
as seen in Figure 11. The voltage and current for each different value of resistor is logged using the digital
multimeter. The obtained results were tabulated and plotted as below. The voltage and current for each
different value of resistor is logged using the digital multimeter. The obtained results were tabulated and
plotted for further analysis.
Table 2. Electrical Specifications
Peak Power (Pmax) 42 W
Maximum Power Point Current (IMPP) 2.5 A
Maximum Power Point Voltage (VMPP) 17 V
Short Circuit Current (ISC) 2.7 A
Open Circuit Voltage (VOC) 21 V
Figure 10. Experimental Set Up Figure 11. Partially Shaded Solar Module for
Experimental Work
6. RESULT AND ANALYSIS
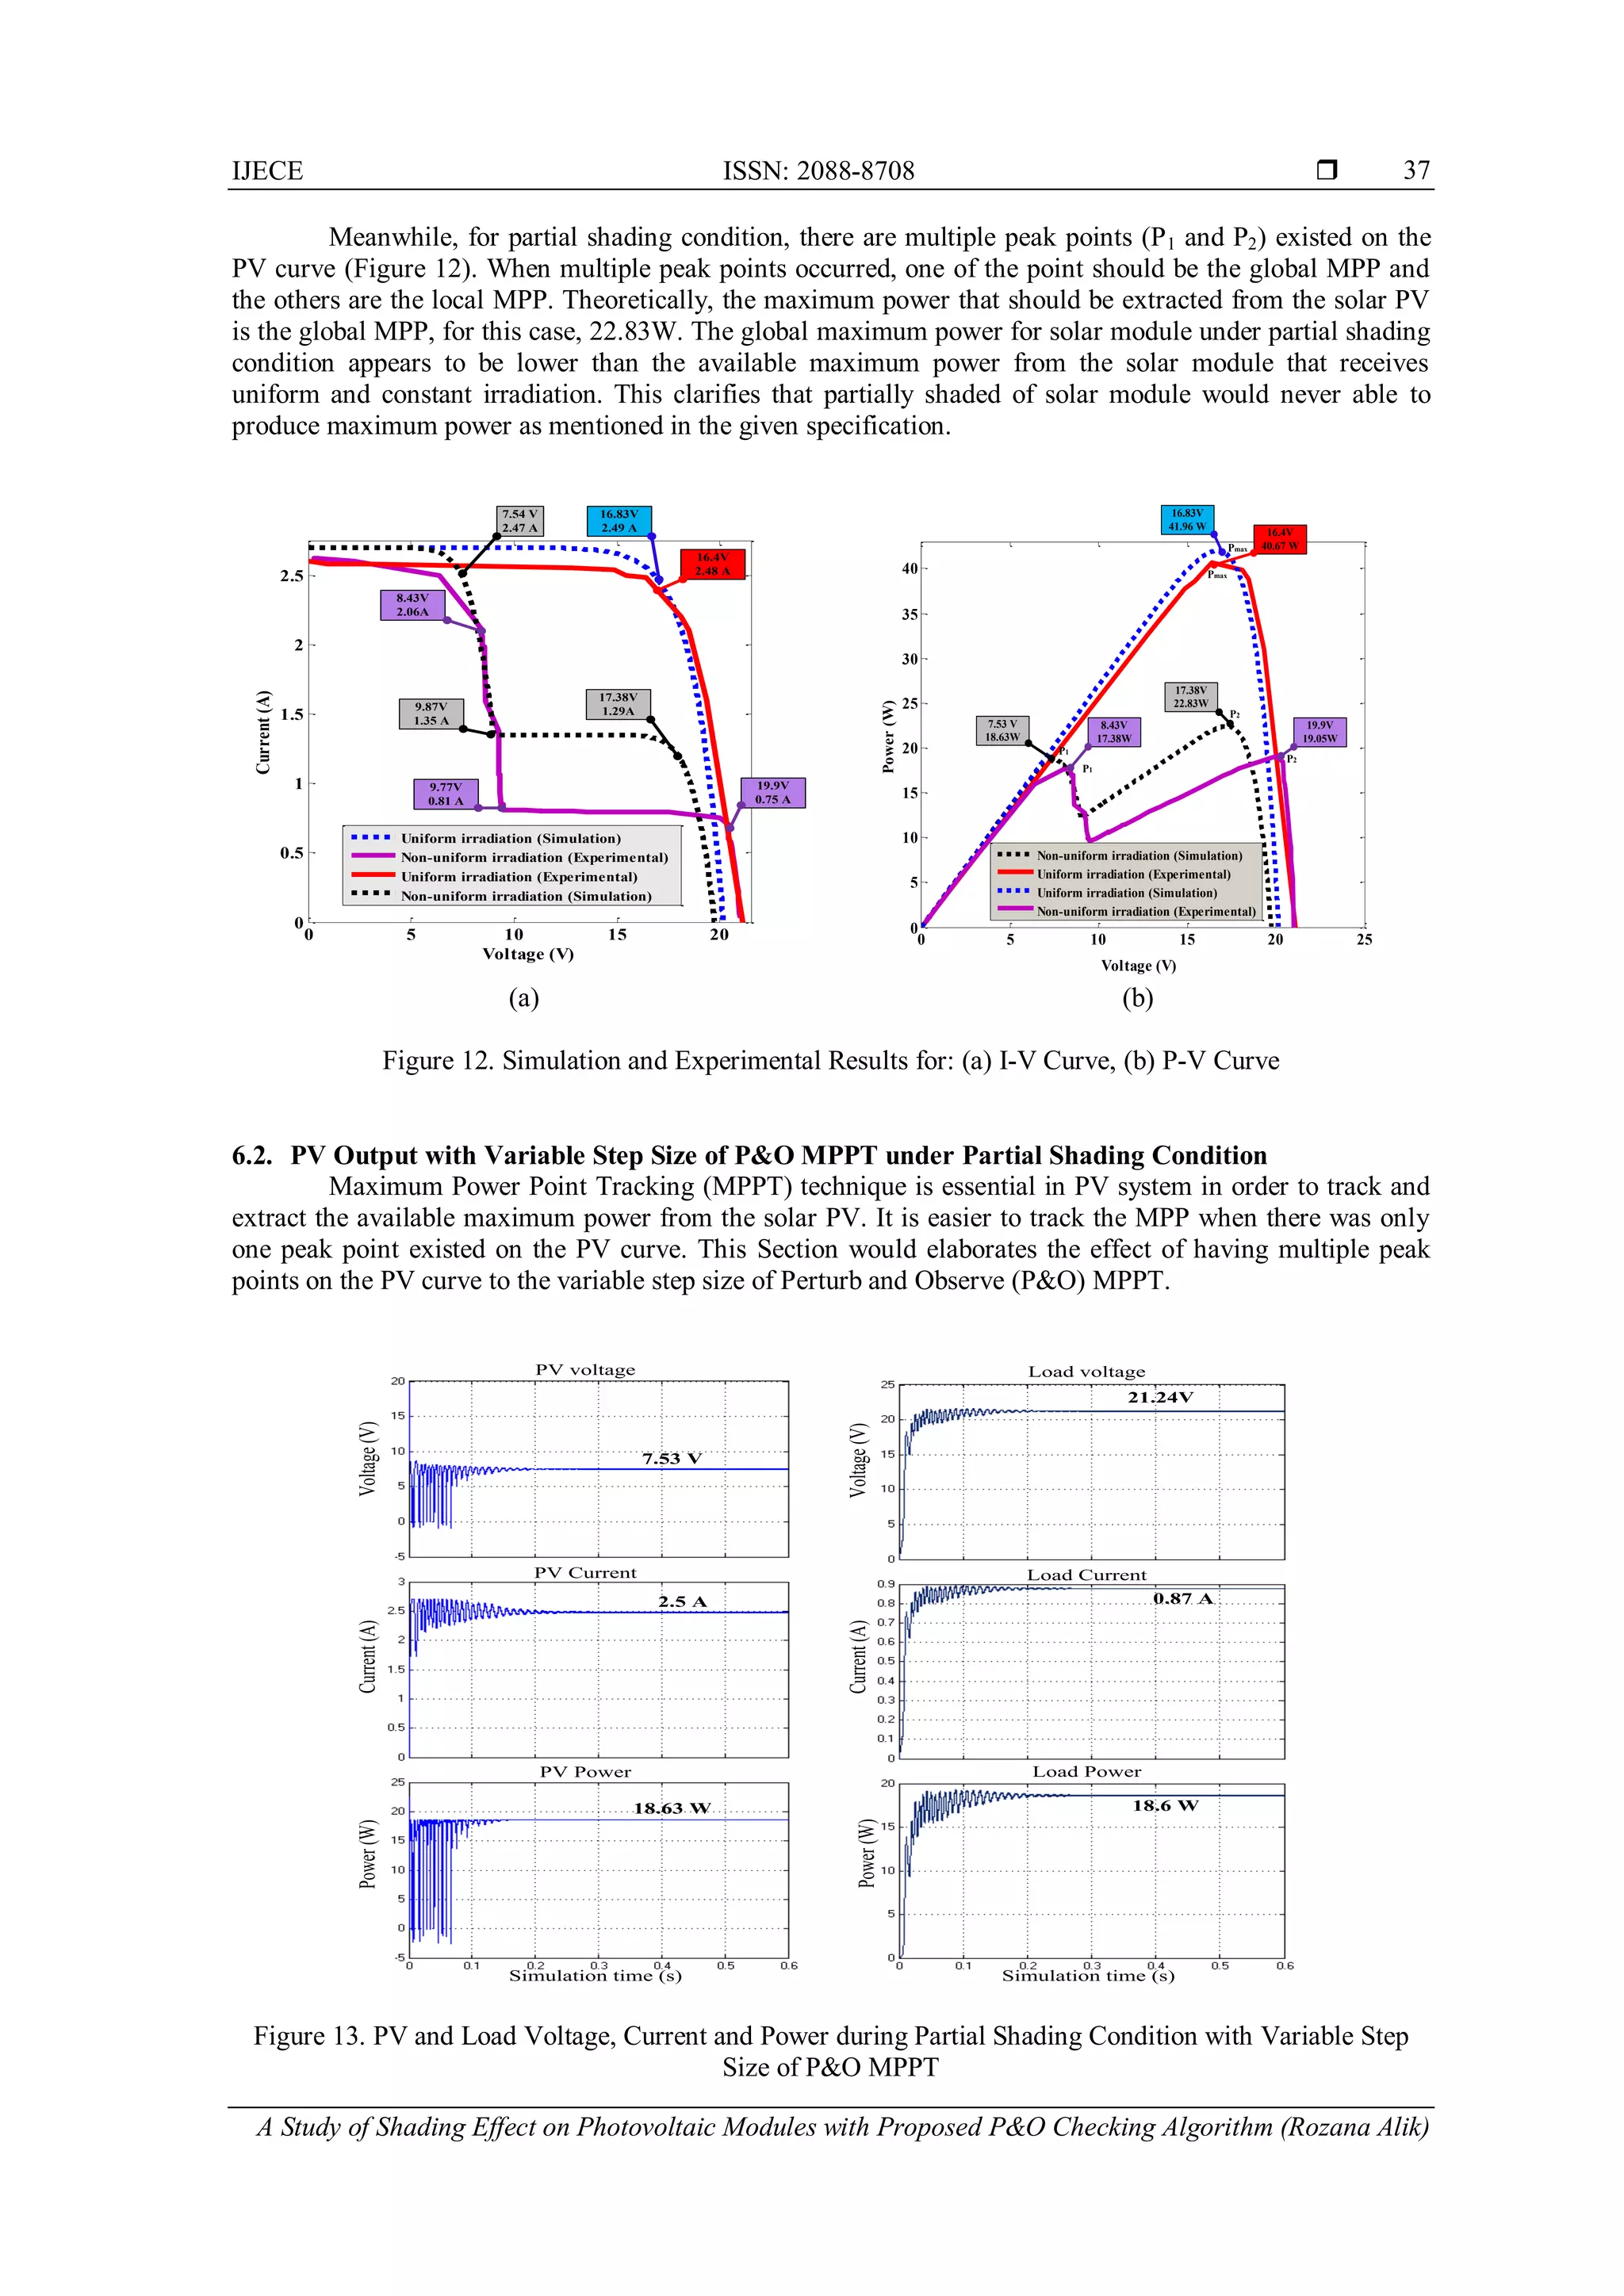
6.1. I-V and P-V Curve Characteristics
The result for I-V curve and P-V curve under uniform and non-uniform insolation for both
simulation and experimental are displayed in Figure 12(a) and (b) respectively. The output current, voltage
and power for experimental procedure give lower value than simulation work. This happened because of the
temperature of solar module become higher due to some hot light rays produce by the halogen. In addition,
the degradation of efficiency of the solar module itself resulting the solar module to have lower output
values.
The simulation and experimental results for normal condition exhibit a linear PV characteristics.
However, when one of irradiance value is adjusted to 500W/m2
, it can be seen that the voltage and current
produce by the module as well as the output power are changing. The current starts to decrease abruptly
when voltage is approaching half of its open circuit voltage, 21V. The current also seems to be half from the
short circuit current, 2.7A. This explains that one of the bypass diode is state of ON and half of solar module
is not working due to the partial shading.
During uniform irradiation, there is only one peak point for PV curve in Figure 12, (Simulation:
PMPP = 41.63W and VMPP = 16.83V; Experimental: PMPP = 40.67W and VMPP = 16.4V). There are only
slightly difference between simulation and experimental results. Besides, the obtained results for both
procedures are nearly same with the given specification, PMPP = 42W and VMPP = 17V. This shows that the
selected solar module still able to work perfectly under normal condition.
4 solar cells are shaded
using a piece of paper](https://image.slidesharecdn.com/04-200928025746/75/A-Study-of-Shading-Effect-on-Photovoltaic-Modules-with-Proposed-P-O-Checking-Algorithm-8-2048.jpg)
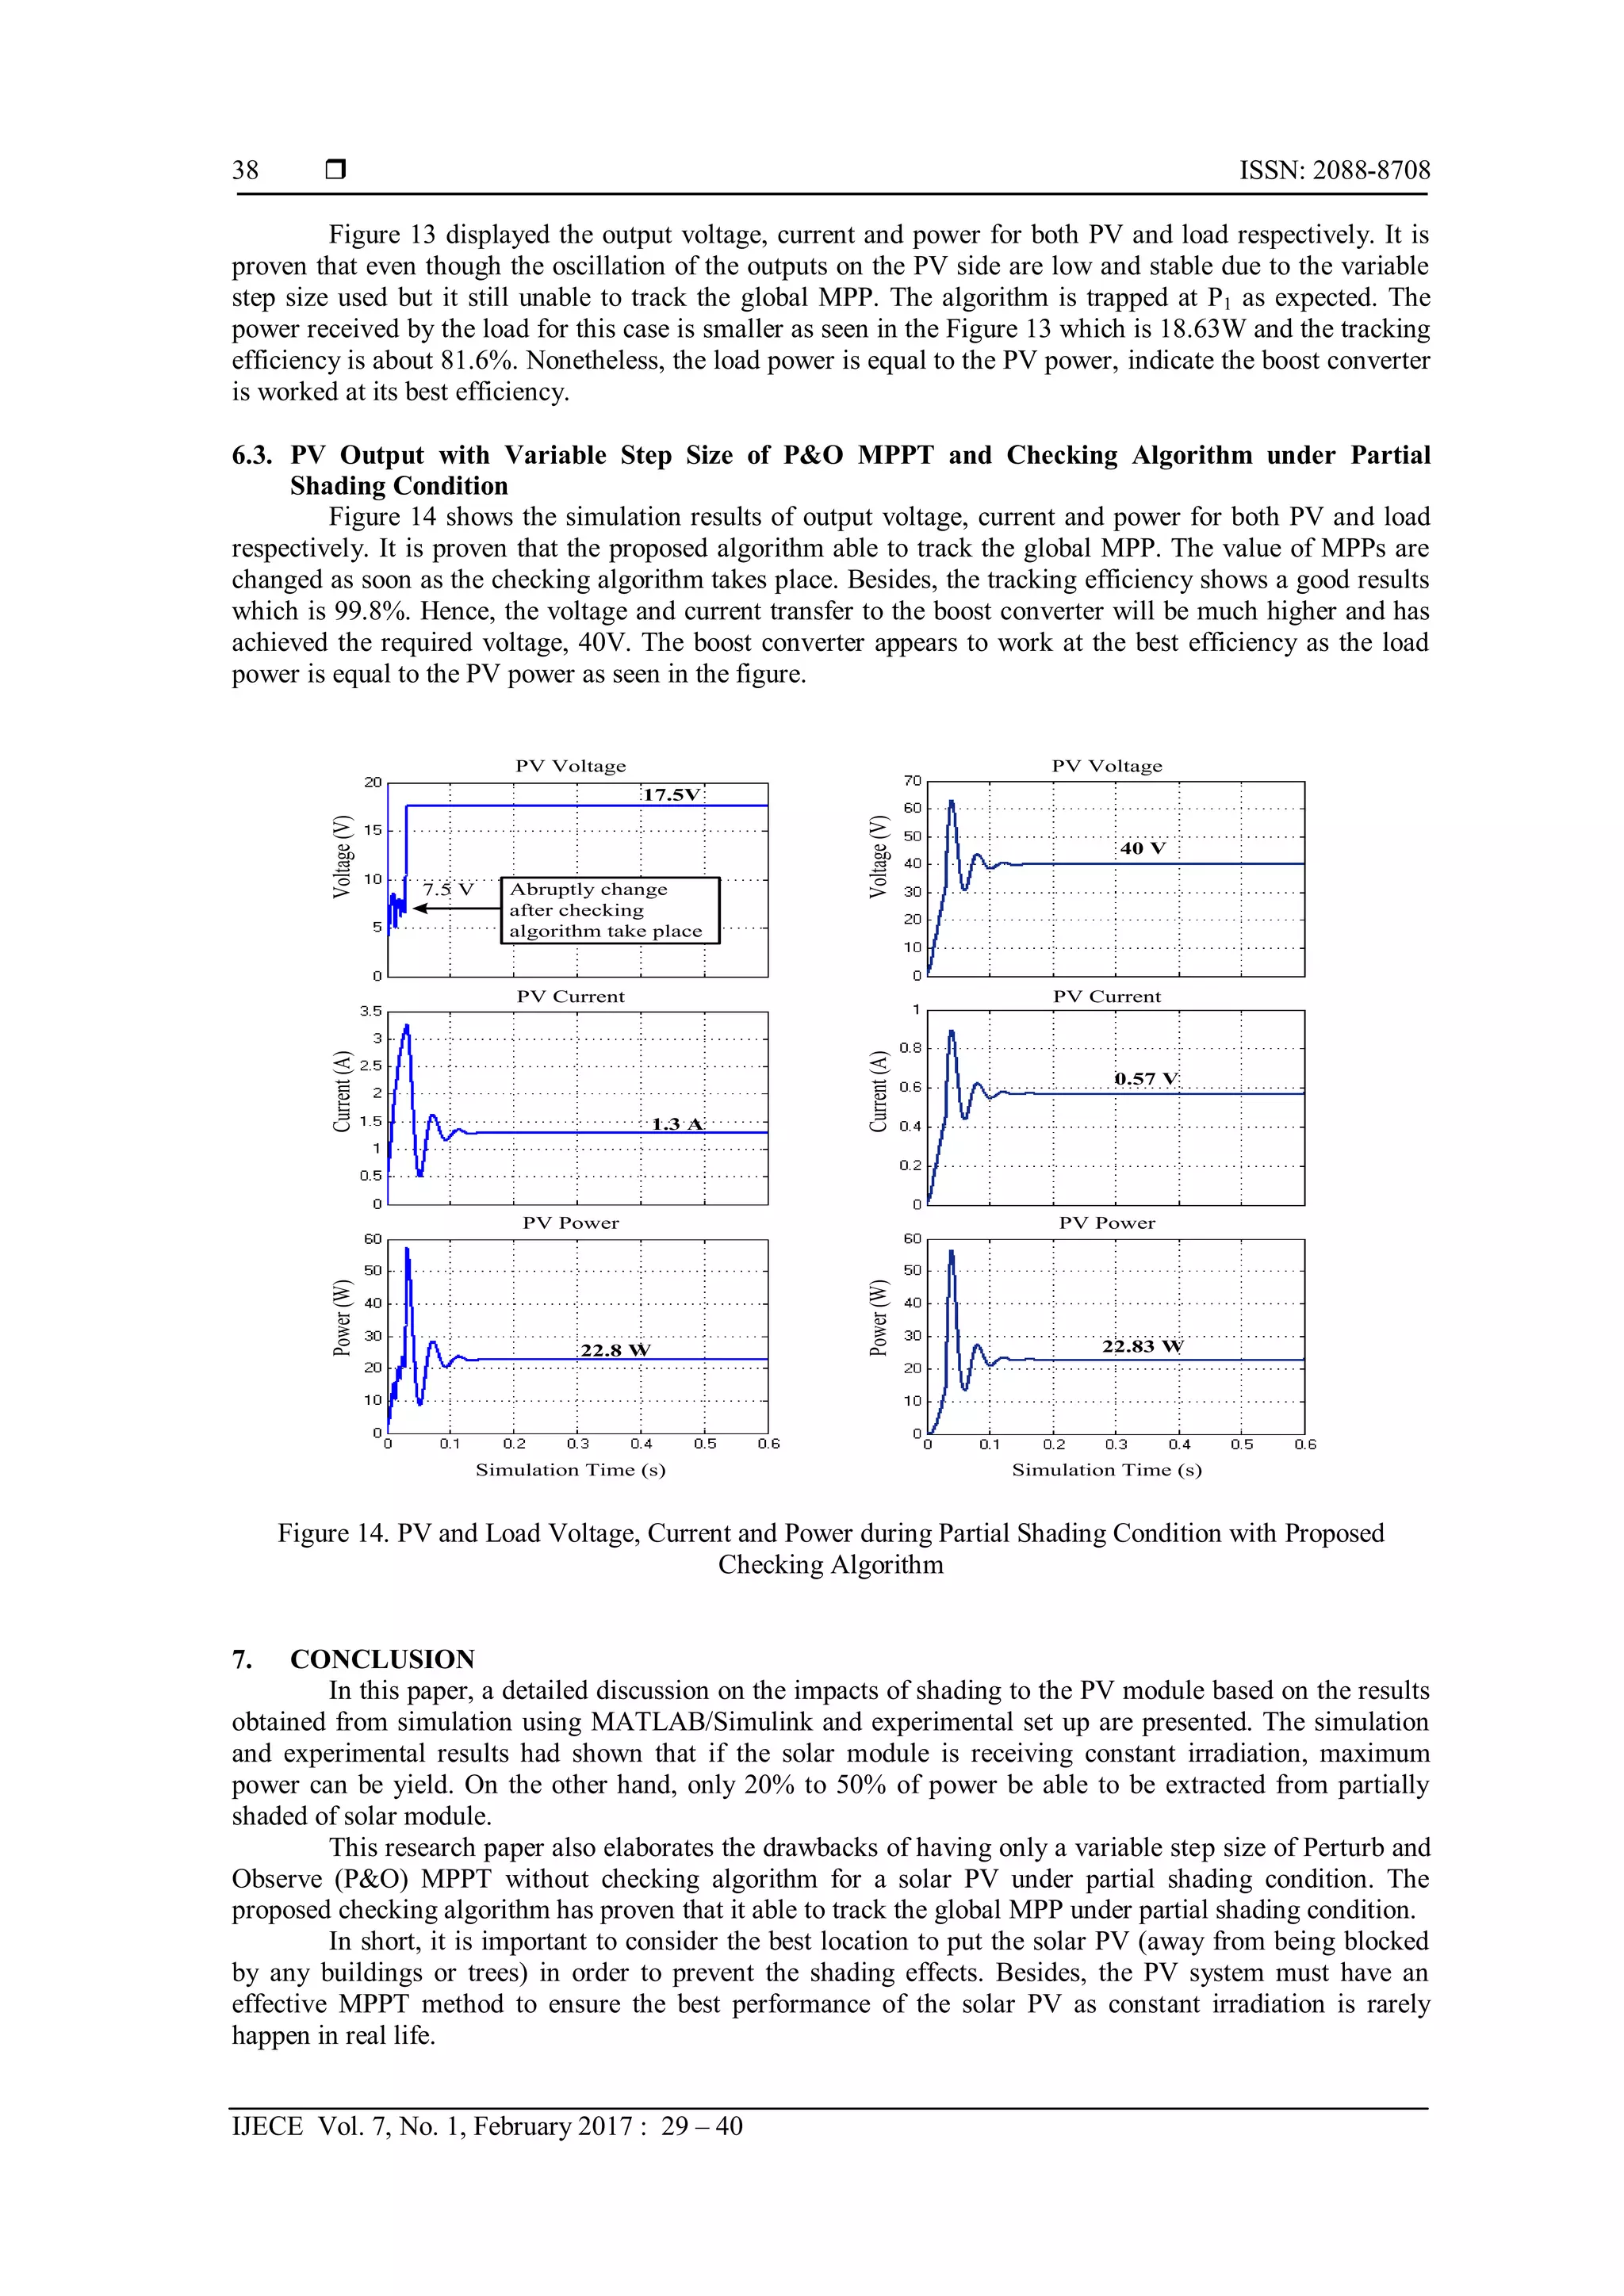
![IJECE ISSN: 2088-8708
A Study of Shading Effect on Photovoltaic Modules with Proposed P&O Checking Algorithm (Rozana Alik)
39
ACKNOWLEDGEMENTS
The authors would like to thank Ministry of Education of Malaysia (MOE) and Universiti Teknologi
Malaysia (UTM) for providing Research University Grant (RUG) under vote number Q.J130000.2523.07H82
for this research work.
REFERENCES
[1] M. Z. A. Ab Kadir, et al., "Prospective scenarios for the full solar energy development in Malaysia," Renewable
and Sustainable Energy Reviews, vol/issue: 14(9), pp. 3023-3031, 2010.
[2] R. Clift, "Climate change and energy policy: the importance of sustainability arguments," Energy, vol/issue: 32(4),
pp. 262-268, 2007.
[3] K. Solangi, et al., "Development of solar energy and present policies in Malaysia," in Clean Energy and
Technology (CET), 2011 IEEE First Conference on., 2011.
[4] M. Abdulazeez and I. Iskender, "Simulation and experimental study of shading effect on series and parallel
connected photovoltaic PV modules," in Electrical and Electronics Engineering (ELECO), 2011 7th International
Conference on., 2011.
[5] M. A. Green, "Solar cells: operating principles, technology, and system applications," 1982.
[6] A. S. Masoum, et al., "Impact of partial shading on voltage-and current-based maximum power point tracking of
solar modules," in IEEE PES General Meeting, 2010.
[7] E. L. Meyer and E. E. van Dyk, "Assessing the reliability and degradation of photovoltaic module performance
parameters," IEEE Transactions on Reliability, vol/issue: 53(1), pp. 83-92, 2004.
[8] H. Patel and V. Agarwal, "MATLAB-based modeling to study the effects of partial shading on PV array
characteristics," IEEE transactions on energy conversion, vol/issue: 23(1), pp. 302-310, 2008.
[9] M. Seyedmahmoudian, et al., "Simulation and hardware implementation of new maximum power point tracking
technique for partially shaded pv system using hybrid depso method," IEEE Transactions on Sustainable Energy,
vol/issue: 6(3), pp. 850-862, 2015.
[10] R. Ramabadran and B. Mathur, "Matlab based modelling and performance study of series connected SPVA under
partial shaded conditions," Journal of Sustainable development, vol/issue: 2(3), pp. 85, 2009.
[11] I. Houssamo, et al., "Maximum power tracking for photovoltaic power system: Development and experimental
comparison of two algorithms," Renewable Energy, vol/issue: 35(10), pp. 2381-2387, 2010.
[12] S. Y. Tseng and H. Y. Wang, "A photovoltaic power system using a high step-up converter for DC load
applications," Energies, vol/issue: 6(2), pp. 1068-1100, 2013.
[13] C. C. Chu and C. L. Chen, "Robust maximum power point tracking method for photovoltaic cells: A sliding mode
control approach," Solar Energy, vol/issue: 83(8), pp. 1370-1378, 2009.
[14] A. P. Bhatnagar and B. Nema, "Conventional and global maximum power point tracking techniques in photovoltaic
applications: A review," Journal of Renewable and Sustainable Energy, vol/issue: 5(3), pp. 032701, 2013.
[15] F. Aashoor and F. Robinson, "A variable step size perturb and observe algorithm for photovoltaic maximum power
point tracking," in 2012 47th International Universities Power Engineering Conference (UPEC), 2012.
[16] L. Piegari and R. Rizzo, "Adaptive perturb and observe algorithm for photovoltaic maximum power point
tracking," IET Renewable Power Generation, vol/issue: 4(4), pp. 317-328, 2010.
[17] K. Nanshikar and A. Desai, "Simulation of P & O Algorithm using Boost Converter."
[18] M. Killi and S. Samanta, "Modified perturb and observe MPPT algorithm for drift avoidance in photovoltaic
systems," IEEE Transactions On Industrial Electronics, vol/issue: 62(9), pp. 5549-5559, 2015.
[19] N. Femia, et al., "Optimization of perturb and observe maximum power point tracking method," IEEE transactions
on power electronics, vol/issue: 20(4), pp. 963-973, 2005.
[20] M. Alqarni and M. K. Darwish, "Maximum power point tracking for photovoltaic system: modified perturb and
observe algorithm," in 2012 47th International Universities Power Engineering Conference (UPEC), 2012.
[21] H. Rezk and A. M. Eltamaly, "A comprehensive comparison of different MPPT techniques for photovoltaic
systems," Solar Energy, vol. 112, pp. 1-11, 2015.
[22] T. Noguchi, et al., "Short-current pulse-based maximum-power-point tracking method for multiple photovoltaic-
and-converter module system," IEEE Transactions on Industrial Electronics, vol/issue: 49(1), pp. 217-223, 2002.
[23] M. A. Masoum, et al., "Theoretical and experimental analyses of photovoltaic systems with voltageand current-
based maximum power-point tracking," IEEE Transactions on Energy Conversion, vol/issue: 17(4), pp. 514-522,
2002.
[24] M. Karamirad, et al., "ANN based simulation and experimental verification of analytical four-and five-parameters
models of PV modules," Simulation Modelling Practice and Theory, vol. 34, pp. 86-98, 2013.
[25] A. K. Rai, et al., "Simulation model of ANN based maximum power point tracking controller for solar PV system,"
Solar Energy Materials and Solar Cells, vol/issue: 95(2), pp. 773-778, 2011.
[26] M. Kaliamoorthy, et al., "Solar powered single stage boost inverter with ANN based MPPT algorithm," in
Communication Control and Computing Technologies (ICCCCT), 2010 IEEE International Conference on., 2010.
[27] Y. T. Chen, et al., "A fuzzy-logic based auto-scaling variable step-size MPPT method for PV systems," Solar
Energy, vol. 126, pp. 53-63, 2016.
[28] M. Miyatake, et al., "Maximum power point tracking of multiple photovoltaic arrays: a PSO approach," IEEE
Transactions on Aerospace and Electronic Systems, vol/issue: 47(1), pp. 367-380, 2011.](https://image.slidesharecdn.com/04-200928025746/75/A-Study-of-Shading-Effect-on-Photovoltaic-Modules-with-Proposed-P-O-Checking-Algorithm-11-2048.jpg)
![ ISSN: 2088-8708
IJECE Vol. 7, No. 1, February 2017 : 29 – 40
40
[29] L. Fialho, et al., "Effect of shading on series solar modules: simulation and experimental results," Procedia
Technology, vol. 17, pp. 295-302, 2014.
[30] R. Alik, et al., "An improved perturb and observe checking algorithm MPPT for photovoltaic system under partial
shading condition," in 2015 IEEE Conference on Energy Conversion (CENCON), 2015.
[31] B. Bendib, et al., "A survey of the most used MPPT methods: Conventional and advanced algorithms applied for
photovoltaic systems," Renewable and Sustainable Energy Reviews, vol. 45, pp. 637-648, 2015.
[32] J. R. Hernanz, et al., "Two photovoltaic cell simulation models in Matlab/Simulink," International Journal on
Technical and Physical Problems of Engineering (IJTPE), vol/issue: 4(1), pp. 45-51, 2012.
[33] S. Nema, et al., "MATLAB/Simulink based study of photovoltaic cells/modules/array and their experimental
verification," International journal of Energy and Environment, vol/issue: 1(3), pp. 487-500, 2010.
[34] K. Ishaque, et al., "Modeling and simulation of photovoltaic (PV) system during partial shading based on a two-
diode model," Simulation Modelling Practice and Theory, vol/issue: 19(7), pp. 1613-1626, 2011.
[35] A. Chouder, et al., "Modeling and simulation of a grid connected PV system based on the evaluation of main PV
module parameters," Simulation Modelling Practice and Theory, vol/issue: 20(1), pp. 46-58, 2012.
[36] E. Cuce, et al., "An experimental analysis of illumination intensity and temperature dependency of photovoltaic cell
parameters," Applied Energy, vol. 111, pp. 374-382, 2013.
[37] H. Patel and V. Agarwal, "Maximum power point tracking scheme for PV systems operating under partially shaded
conditions," IEEE transactions on industrial electronics, vol/issue: 55(4), pp. 1689-1698, 2008.
[38] Y. S. Kumar and R. Gupta, "Maximum power point tracking of multiple photovoltaic arrays," in Engineering and
Systems (SCES), 2012 Students Conference on., 2012.
[39] R. Alonso, et al., "An innovative perturb, observe and check algorithm for partially shaded PV systems," in Power
Electronics and Applications, 2009. EPE'09. 13th European Conference on., 2009.
[40] A. B. Jusoh, et al., "Variable step size Perturb and observe MPPT for PV solar applications," TELKOMNIKA
(Telecommunication Computing Electronics and Control), vol/issue: 13(1), pp. 1-12, 2015.](https://image.slidesharecdn.com/04-200928025746/75/A-Study-of-Shading-Effect-on-Photovoltaic-Modules-with-Proposed-P-O-Checking-Algorithm-12-2048.jpg)


![ANPARA THERMAL POWER STATION[1] sangam.pdf](https://cdn.slidesharecdn.com/ss_thumbnails/anparathermalpowerstation1sangam-251121115219-9261cde4-thumbnail.jpg?width=640&height=640&fit=bounds)


