This document presents a study on the performance investigation of grid-connected photovoltaic (PV) systems modeled using MATLAB simulation. The research examines the impact of solar irradiance and temperature on the behavior of PV cells, indicating that lower temperatures yield higher power outputs. The paper includes detailed mathematical models of PV cells along with simulation results that demonstrate varying output characteristics under different environmental conditions.
![International Journal of Electrical and Computer Engineering (IJECE)
Vol. 8, No. 6, December 2018, pp. 4847~4854
ISSN: 2088-8708, DOI: 10.11591/ijece.v8i6.pp4847-4854 4847
Journal homepage: http://iaescore.com/journals/index.php/IJECE
Performance Investigation of Grid Connected Photovoltaic
System Modelling Based on MATLAB Simulation
Adnan Hussein Ali, Hassan Salman Hamad, Ali Abdulwahhab Abdulrazzaq
Technical Instructors Training Institute, Middle Technical University, Iraq
Article Info ABSTRACT
Article history:
Received Feb 23, 2018
Revised Jul 23, 2018
Accepted Aug 12, 2018
Photovoltaic (PV) systems are normally modeled by employing accurate
equations dealing with a behavior the PV system. This model has
Characteristic of PV array cells, which are influenced by both irradiation and
temperature variations. Grid-connected PV system is considered as electricity
generated solar cell system which is connected to the grid utilities. This paper
characterizes an exhibiting and simulating of PV system that executed with
MATLAB /Simulink. The impact of solar irradiances as well as ambient
temperature performances of PV models is investigated and noted that a
lower temperature provides maximum power higher so that the open circuit
voltage is larger. Furthermore, if the temperature is low, then a considerably
short circuit current is low too.
Keyword:
Current-voltage curve
Module irradiance
Photovoltaic (PV)
Power-voltage curve
Copyright © 2018 Institute of Advanced Engineering and Science.
All rights reserved.
Corresponding Author:
Adnan Hussein Ali,
Technical Instructors Training Institute,
Middle Technical University,
Baghdad, Iraq.
Email: aaddnnaann63@gmail.com
1. INTRODUCTION
The vast improvement of the recent common economy is a crisis factor of energy as well as the
environment, that needs to decrease the requirement on conventional energy besides level improvement of
utilization and enlargement of the energy resources such as renewable gradually [1], [2]. By concentrating on
renewable source types, solar photovoltaic (PV) can be considered as the main contributors in the world
energy sources due to unlimited offer features of power generation in addition to its clean (i.e. no emitted
pollution and considers100% environment friendly), therefore it may be a completely renewable energy
technology which has afforded an expansion potential in addition to their world’s quickest
developing industries [3], [4].
A photovoltaic (PV) system utilizes a solar cell for converting the solar energy to electricity with
depends on the photoelectric effect. PV system basically is a cell which may be classified as mono-
crystalline, poly-crystalline, organic cell, amorphous, and Nano-PV cells. Now the technology of PV can be
used in various applications like plants of solar power, PV grid-connected, home-produced usage, power
communication, satellites, and currently aircrafts as well as electric vehicle applications [5]-[7].
In applications of photovoltaic (PV) system, it's necessary to design a comprehensive system to
activate the solar cells (SCs) with optimal conditions and maximum efficiencies. The Maximum power point
(MPP) is changing greatly with depending on the sunlight angle on the panel surface in addition to cell
temperature, therefore the MPP may not be considered as the load operating point of PV system. PV systems
can be designed for comprising many required modules with the purpose of supplying reliable energy for
the grid [8], [9].
The feeding of electricity by Grid-connected PV systems are directly active with electrical network
and working in parallel with a conventional power source. These systems had been satisfying an exponential](https://image.slidesharecdn.com/v0823jul1823feb11941performanceinvestigationeditlia-201127061850/75/Performance-Investigation-of-Grid-Connected-Photovoltaic-System-Modelling-Based-on-MATLAB-Simulation-1-2048.jpg)
![ ISSN: 2088-8708
Int J Elec & Comp Eng, Vol. 8, No. 6, December 2018 : 4847 - 4854
4848
evolution rate through the previous decade. An abrupt evolution is coming from a growing attention of
climate modification, tax incentives, as well as lowering the cost of PV systems. The major disadvantages PV
solar energy created electrical supply concerns by variable power generation during the day, in addition to it
permanently changes by atmospheric environments [10].
The system of typical PV grid-connected comprises of an array of PV, the inverter and controller as
shown in Figure 1. An inverter part designed for the residential purposing to produce clean electricity close
the usage point [11], it can be considered as the essence of PV grid-connected system, it comprises the
controllers of maximum power tracking and a synchronization waveform, it may be created from inverting
the power into the sinusoidal current injection system. The controller is tracking the PV maximum power
point (MPP) so as to control the waveforms of inverter’s current grid-connected to the network for
transmitting power plus PV array maximum power phase equilibrium [12].
Figure 1. The PV structure system
In this paper, PV grid-connected which includes the inverter and the controller as a tracking the PV
maximum power point is simulated to provide the desired DC voltage and current. The MATLAB simulation
based on changing the solar irradiations with constant temperature first and then varying temperature with
constant irradiation to obtain the output voltage and current from PV array as well as the output power versus
voltage and current. All the results obtained from simulation have been confirmed the validity of the models
and efficiency of the suggested model parameters.
2. MATHEMATICAL DESCRIPTION OF PV CELLS MODELS
The basic principles for modeling a PV system represent a unit of converting the power of a PV
generator system, they are also dealing with electrical characteristics, that’s mean, the relationship of voltage-
current of a PV cell with variable weather conditions [13]. The PV module output characteristics based on
the solar insolation, the temperature of PV cell and then the PV module output voltage. The solar power
radiations are frequently directly renewed to electricity with an impact of electrical phenomenon. An
exposition to daylight creates photons that have energy more than the semiconductor gap energy and
generates some pairs of electrons–hole that related to the incident irradiation.
The equivalent model circuit of a PV cell can be shown in Figure 2 (a) and (b), with a simplified PV
equivalent model in (a) and single-diode model in (b). The production of electrical energy from the PV cell
may be represented by current (Iph) requested from a source of voltage-dependent current. The totals of
generating energy (current and voltage) are related to solar radiation and the ambient temperature [14], [15].
Figure 2. models of PV-cell equivalent-circuit: (a) Ideal or Simplified PV equivalent, (b) single diode model](https://image.slidesharecdn.com/v0823jul1823feb11941performanceinvestigationeditlia-201127061850/75/Performance-Investigation-of-Grid-Connected-Photovoltaic-System-Modelling-Based-on-MATLAB-Simulation-2-2048.jpg)
![Int J Elec & Comp Eng ISSN: 2088-8708
Performance Investigation of Grid Connected Photovoltaic System Modelling Based ... (Adnan Hussein Ali)
4849
The models of electrical performances that comprise cell temperature need parameters which
describe the panel characteristics essentially. Some required parameters given by the specifications of
manufacturer’s module are included short-circuit current (Isc) and open-circuit voltage temperature
coefficients [16].
From Figure 2 with a solar cell equivalent circuit, since a representation of the semiconductor
material of the solar cell represents a diode, the output voltage of the PV cell is expressed by Vpv or just V,
the Serial resistance (Rs) and parallel (shunt) resistance (Rp). While IPH is a generated photo current by a
solar cell and Id is the diode saturation current and Ip denotes the current of shunt resistance Rp. From the
surveys, it is clear that the resistance Rp is large, so its effect usually may be neglected [17].
3. PRESENTATION OF PV MODULE
3.1. Ideal Single Diode Model
A diode is an anti-parallel connection with a PV unit that considers light generated current source,
so output current IPH is obtained by Kirchhoff law:
IPH = IL - Id (1)
IL is the photocurrent and the diode current Id that relates to the saturation current Io and is expressed by:
Id = Io [exp( 𝑉
𝐴.𝑁 𝑆 .𝑉 𝑇
) − 1] (2)
With V be a voltage that imposed on the diode, and VT = k . Tc/q. Io is the leakage or reverse
saturation current of the diode (Amp), for silicon cell the VTc = 26 mV at 300 K, Boltzmann constant (k) =
1.38x10⁻²³
J/K, and q is electron charge =1.602 x10⁻¹⁹
C, the thermal voltage VT is important due to its high
dependency of temperature. A is the ideality factor and depends on the technology PV cell.
For Figure 2(b) which contains, in addition to the current source (IL), an anti-parallel diode with two
resistors (Rs & Rp). With Shockley diode equation dependence, and applying the Kirchhoff's law, the
identical mathematical model of current is given by:
IPH = IL - Id – IP (3)
where IP represents the current leak at shunt resistor, the module's output current comprising Ns cells
connected in series be:
𝐼 = 𝐼𝑝ℎ − 𝐼𝑜 [exp ( 𝑉+𝐼 .𝑅𝑠
𝑎
) − 1] − 𝑉+ 𝑅𝑠.𝐼
𝑅𝑝
(4)
It's clear that to determine the parameters is not easy of the above transcendent equation (4). On the
other hand it proposes the best solution [18]. In all of PV products, the performances of PV cell specified in
the module can be realized with standard test conditions (STC) which means the irradiance = 1000W/m2
, in
addition to cell temperature of 25o
C. The Temperature parameter has a considerable effect on the output
power of the PV solar panel: with a temperature increased by one-degree (o
C) results in a decreasing of 0.4%
in output power for Si solar panels [19].
3.2. Two Diode Model
A two diodes form can be considered modified arrangement of single diode circuit that takes in
consideration the recombination effect by adding an additional parallel diode that shown in Figure 3.
Figure 3. Two diode model](https://image.slidesharecdn.com/v0823jul1823feb11941performanceinvestigationeditlia-201127061850/75/Performance-Investigation-of-Grid-Connected-Photovoltaic-System-Modelling-Based-on-MATLAB-Simulation-3-2048.jpg)
![ ISSN: 2088-8708
Int J Elec & Comp Eng, Vol. 8, No. 6, December 2018 : 4847 - 4854
4850
𝐼 = 𝐼 𝑝ℎ − 𝐼𝑜1 ( 𝑒
𝑉+𝐼 𝑅 𝑠
𝑛 𝑠𝑖 𝑣 𝑇 − 1) − 𝐼𝑜2 ( 𝑒
𝑉+𝐼 𝑅 𝑠
𝑛 𝑠2 𝑣 𝑇 − 1) −
𝑉+𝐼𝑅 𝑠
𝑅 𝑝
(5)
Nevertheless, two indefinite diode quality factors. Therefore, equations number and indefinite
parameters are increasing, thereby creating calculations further complex little bit. Now, irradiance and
temperatures are with low values, this model gives precise curve characteristics if it related to the first model.
Hence, by taking all facets into attention, as concerns the mathematical computation in addition to the
number of iterations is considered, the single diode model believes to be fast results because of less
complexity equation with less computational errors not like a case model of two-diode. But two diode models
offer more accurate and sharp characteristics with variable weather conditions at longer iterations and factor
calculations.
In case of two diode model, both diodes have different diode quality factors (n1& n2) hence,
different reverse saturation currents as Io1& Io2. The fill factor FF can be defined as the maximum power that
can be delivered to the load per the Isc, Voc production and It will be a real I-V characteristics measurement.
𝐹𝐹 =
𝑃 𝑚𝑎𝑥
𝑉𝑜𝑐 𝐼 𝑠𝑐
=
𝑉 𝑚𝑝 𝐼 𝑚𝑝
𝑉𝑜𝑐 𝐼 𝑠𝑐
(6)
FF increases at reduction in temperature at a good cell that gives 0.7 or more values.
From I-V characteristics of PV cell, from equation (4), three topics at STC, the following equations
at extreme point's changes to: At open circuit condition,
𝐼 = 𝐼 𝑝ℎ − 𝐼𝑜 ( 𝑒
𝑉+𝐼 𝑅 𝑠
𝑛 𝑠 𝑣 𝑇 − 1) −
𝑉𝑜𝑐+𝐼𝑅 𝑠
𝑅 𝑝
(7)
At short circuit condition,
𝐼𝑠𝑐 = 𝐼 𝑝ℎ − 𝐼𝑜 ( 𝑒
𝑉𝑠𝑐+𝐼 𝑅 𝑠
𝑛 𝑠 𝑣 𝑇 − 1) −
𝑉𝑠𝑐+𝐼𝑅 𝑠
𝑅 𝑝
(8)
At maximum power point condition,
𝐼𝑚𝑝 = 𝐼 𝑝ℎ − 𝐼𝑜 ( 𝑒
𝑉𝑚𝑝+𝐼𝑚𝑝 𝑅 𝑠
𝑛 𝑠 𝑣 𝑇 − 1) −
𝑉𝑚𝑝+𝐼𝑚𝑝𝑅 𝑠
𝑅 𝑝
(9)
3.3. Determination of the Parameters
3.3.1. Determination of Iph
Based on Figure 2a and equation (2), the output current can be obtained at a condition of standard
test conditions (STC) as:
IPH =IL.ref - Io.ref [exp( 𝑉
𝐴 𝑟𝑒𝑓
) − 1] (10)
Equation (10) permits computing IL,ref that can't be determined else. Applying STC which gives the
PV cell is short-circuited:
IPH. sc =IL.ref - Io.ref [exp( 0
𝐴 𝑟𝑒𝑓
) − 1] = IL.ref (11)
The photocurrent depends on both irradiance and temperature:
IL. = 𝐺
𝐺 𝑟𝑒𝑓
( IL.ref + µsc . ΔT) (12)
G: Irradiance (W/m2
), Gref : Irradiance at STC= 1000 W/m2
, ΔT =Tc - Tc,ref (Kelvin), Tc,ref : Cell
temperature at STC = 25+ 273 =298 K, µSC : Coefficient temperature of short circuit current (A/K), provided
by the manufacturer, Iph,ref : Photocurrent (A) at STC.](https://image.slidesharecdn.com/v0823jul1823feb11941performanceinvestigationeditlia-201127061850/75/Performance-Investigation-of-Grid-Connected-Photovoltaic-System-Modelling-Based-on-MATLAB-Simulation-4-2048.jpg)
![Int J Elec & Comp Eng ISSN: 2088-8708
Performance Investigation of Grid Connected Photovoltaic System Modelling Based ... (Adnan Hussein Ali)
4851
3.3.2. Determination of Io
The STC belongs to the IEC standards, the three most marked topics at STC are: short-circuit
current Isc (V =0, I= Isc,ref), open-circuit voltage Voc (I =0, V= Voc,ref) and maximum-point power
(PMPP) the current (Imp,ref) and voltage (Vmp,ref). These topics are identified for all PV modules with
±10% tolerance and they realistically happening very rarely.
The shunt resistor RP is normally considered high. By applying equation (5) at those three topics at
STC, the following equations are achieved:
I sc,ref = IPH,ref - Io,ref [𝑒𝑥𝑝(
𝐼 𝑠𝑐,𝑟𝑒𝑓
𝐴 𝑟𝑒𝑓
𝑅 𝑠) − 1] (13-a)
0 = 𝐼 𝑃𝐻,𝑟𝑒𝑓 − 𝐼𝑜,𝑟𝑒𝑓 [𝑒𝑥𝑝( 𝑉 𝑜𝑐
𝐴 𝑟𝑒𝑓
) − 1] (13-b)
IPM,ref = IPH,ref - Io,ref [𝑒𝑥𝑝(
𝑉 𝑃𝑀,𝑟𝑒𝑓 + 𝐼 𝑃𝑀,𝑟𝑒𝑓 𝑅 𝑠
𝐴 𝑟𝑒𝑓
) − 1] (13-c)
From above equations, the photocurrent can be written as:
Io,ref = Isc,ref exp (
−𝑉 𝑜𝑐,𝑟𝑒𝑓
𝐴 𝑟𝑒𝑓
) (14)
4. SIMULATION MODEL OF A PV ARRAY
The PV array comprises of PV cell arranged serially and in Parallel combination for providing the
desired DC voltage and current. PV module utilized for simulation can be shown in Figure 4. The simulation
of (I-V) and (P-V) curves for different values of irradiances and temperatures is obtained using MATLAB.
Figure 4. A PV array circuit diagram in MATLAB/Simulink
From Figure 4, PV module has been modelling and simulating with MATLAB/Simulink at a
variable irradiance from (200 to 1000 W/m2
) and different temperatures from (25 to 60o
C). This model
included blocks which are established from equations (1 to 12).
4.1. Simulation Results
The obtaining waveforms from simulation by changing the solar insolations once and then
temperatures that are supplied to the PV array model can be plotted separately each time as presented below.
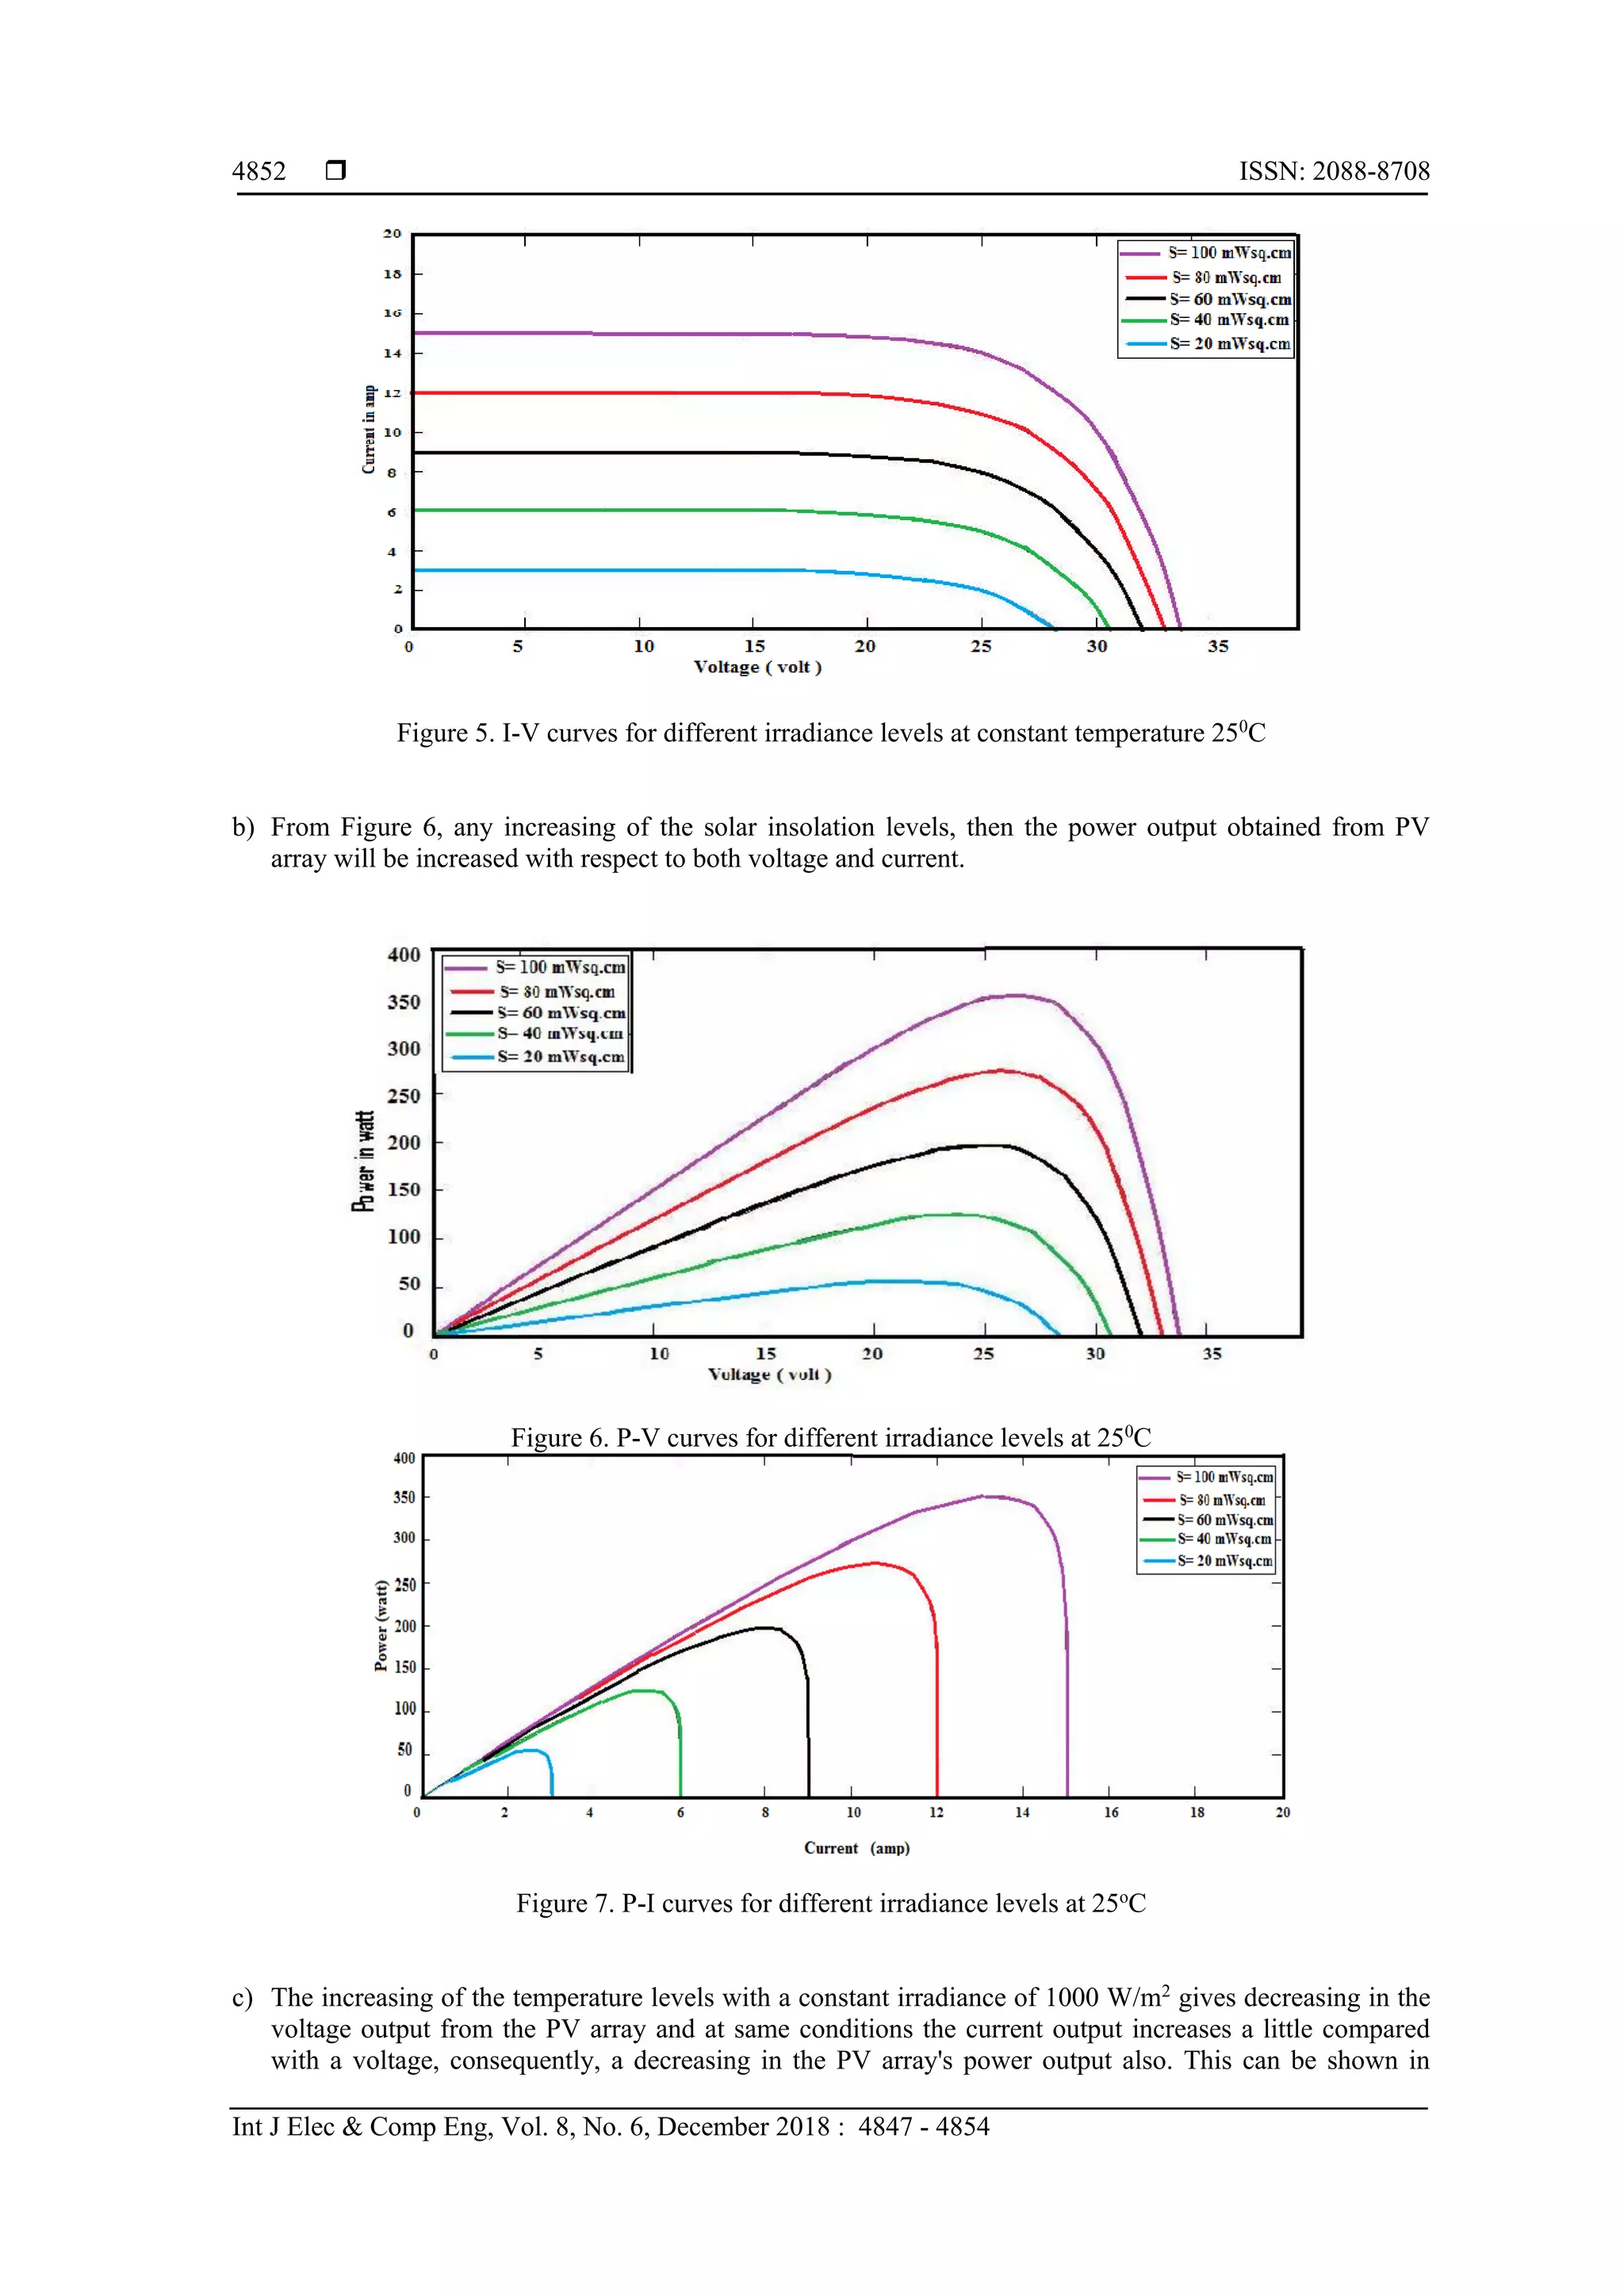
a) Figure 5 shows the irradiance is variable and ranged from 200W/m2
to 1000W/m2
while the temperature
was maintained at 25 0
C. It observes that with the solar radiation is increasing at constant temperature, the
output voltage and current from PV array increases. Therefore, at higher insolation the required level
voltage can be acquired.](https://image.slidesharecdn.com/v0823jul1823feb11941performanceinvestigationeditlia-201127061850/75/Performance-Investigation-of-Grid-Connected-Photovoltaic-System-Modelling-Based-on-MATLAB-Simulation-5-2048.jpg)
![ ISSN: 2088-8708
Int J Elec & Comp Eng, Vol. 8, No. 6, December 2018 : 4847 - 4854
4854
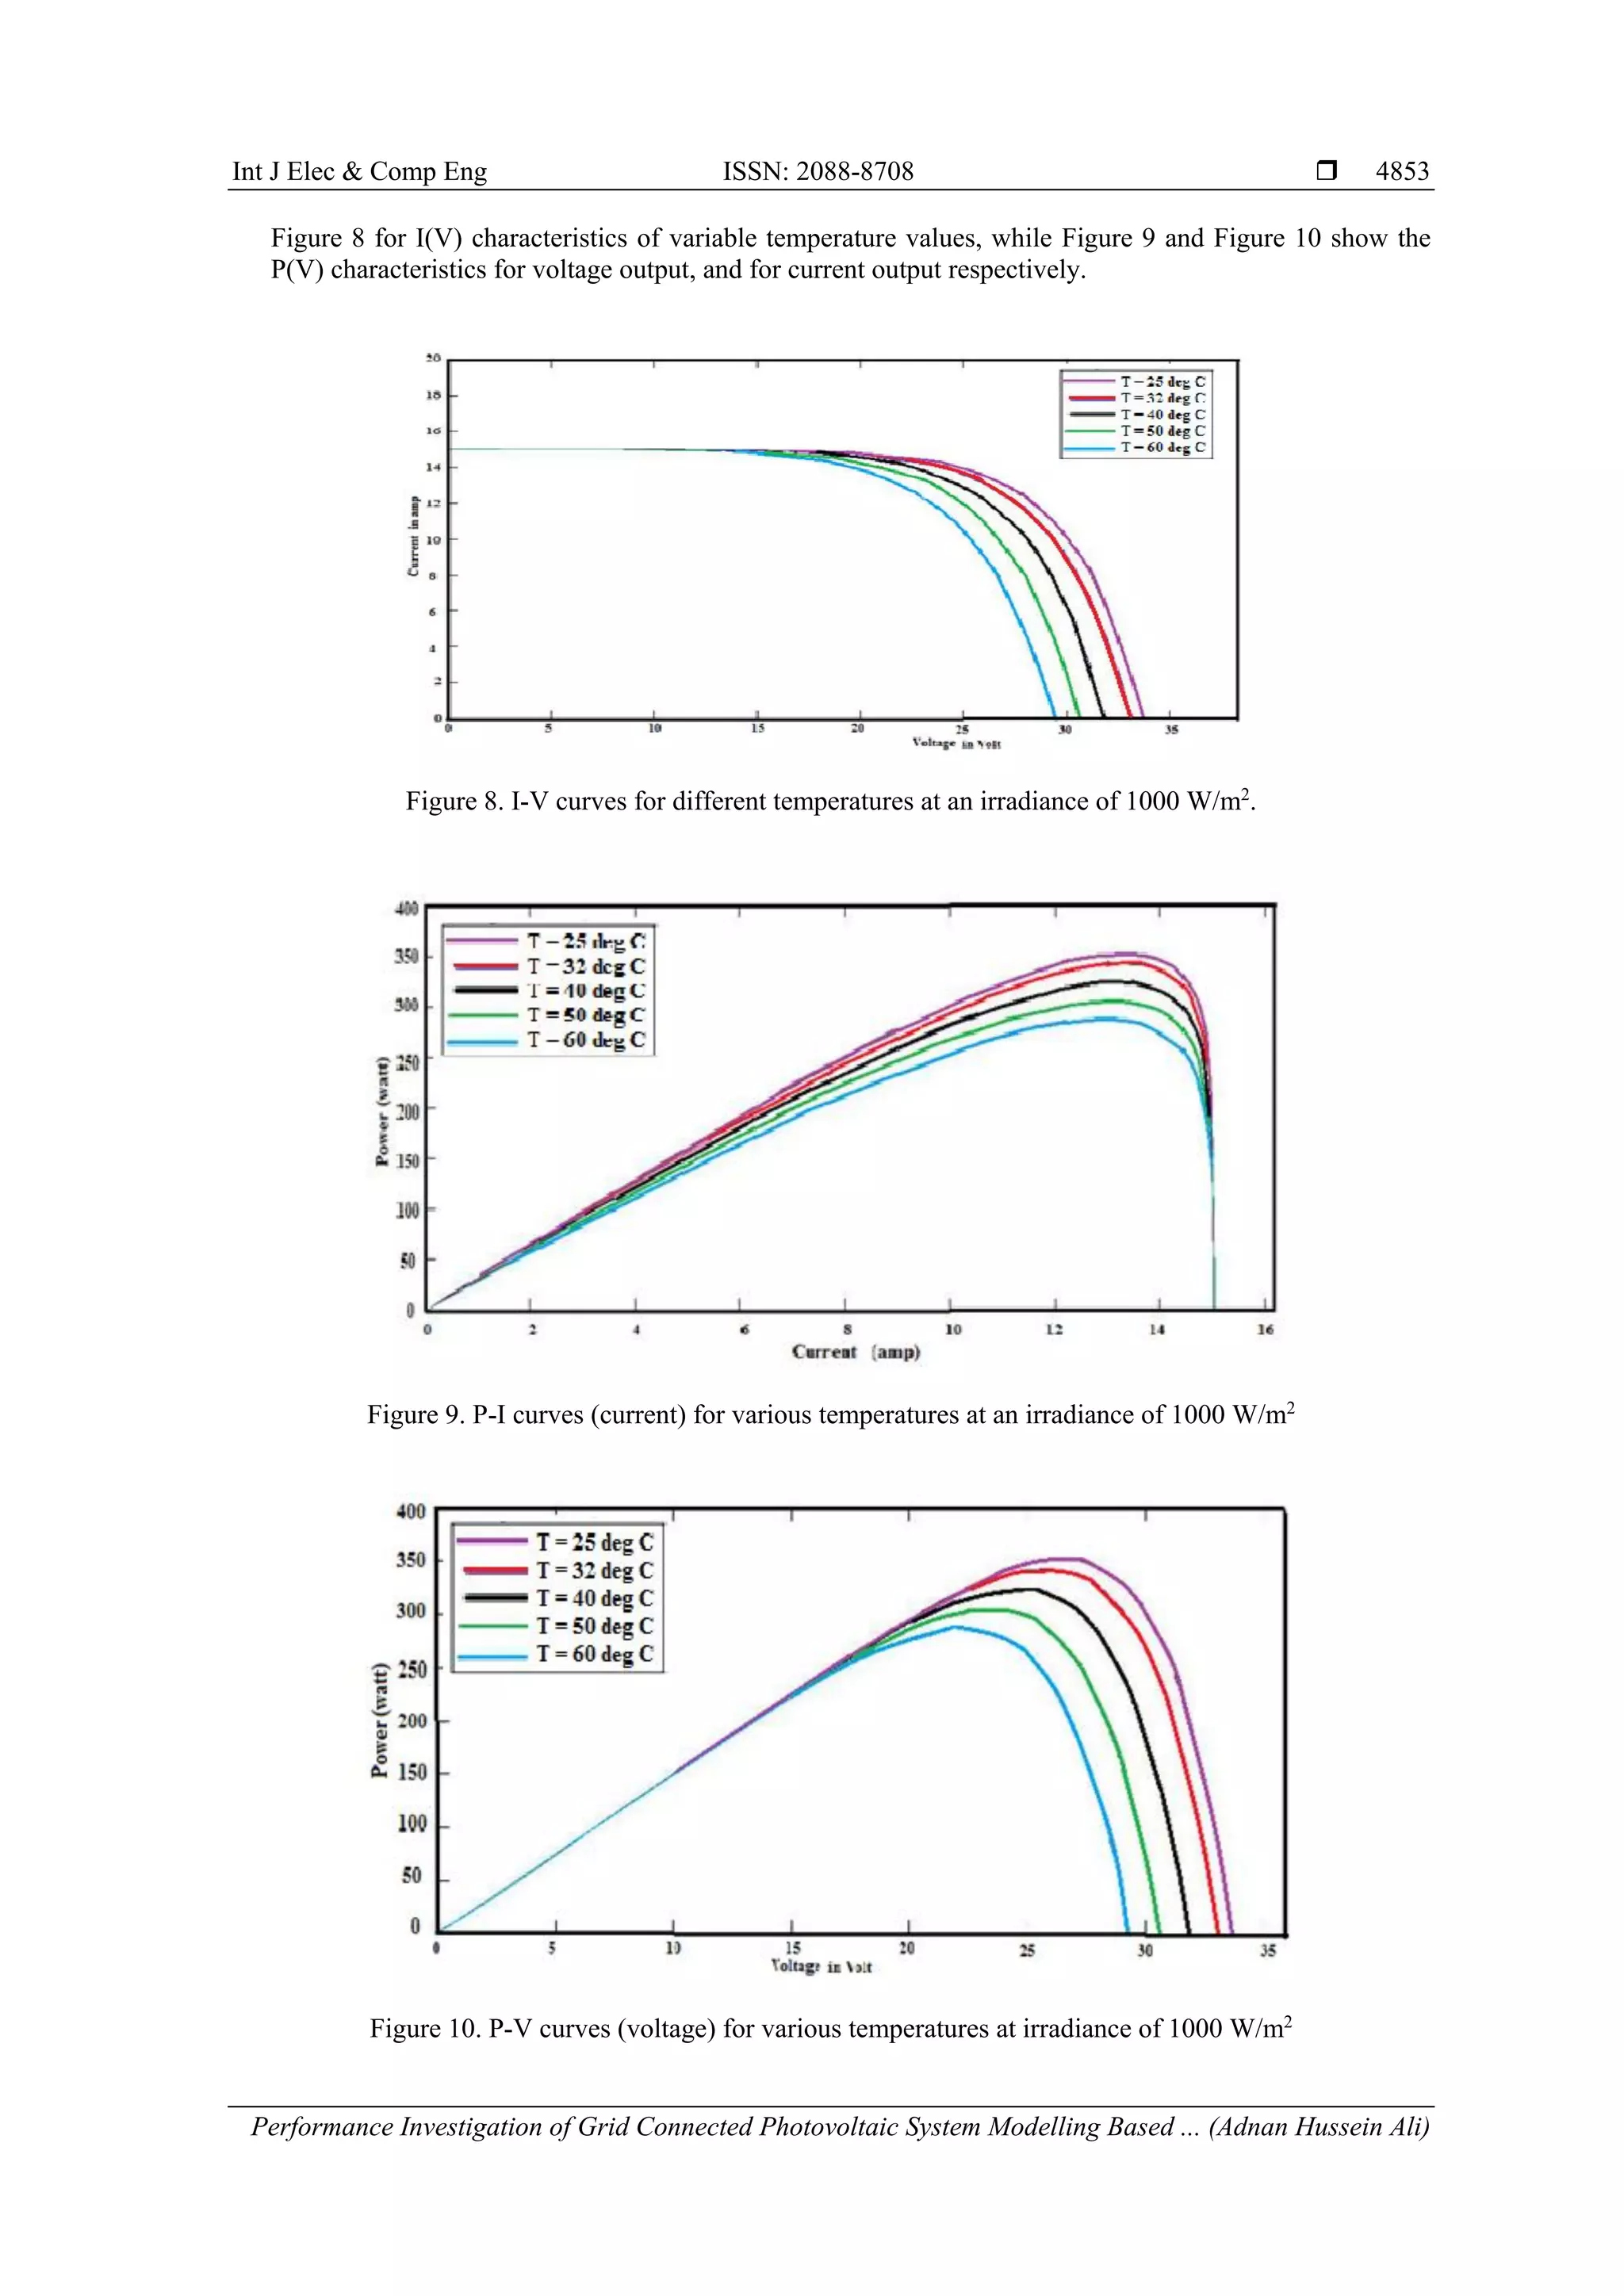
The temperature variation from 25°C to 60°C in many steps with a fixed solar irradiance at 1 kW/m2
have been simulated and a result for I(V) and P(V) demonstrate that if a solar radiation (G) remains constant,
then the open circuit voltage decreases. These results produce a change of the maximum power point (MPP)
operation which is compatible with equations (8) and (9). Alternatively, when the PV cell temperature (Tc) is
specified with Tc = 25 ºC and the solar radiation is changed from 200W/m2 to 1000W/m2
, the current output
generated by the PV cell increases slightly as in Figures above.
5. CONCLUSION
PV solar system is quite utilized for grid connected power electricity for controlling the building
illumination, housing appliances, and electrical instruments. In this Paper, for constructing a PV grid-
connected system, a set of factors, desires to be taken into consideration in order to achieve most power
generation. The parameters of solar irradiation and temperature dependence of PV cell performances are
significantly associated. A mathematical model is derived of PV simulation in terms of solar irradiance and
cell temperature and studied their behavior at different data of standard test conditions (STC). The open
circuit (I-V), (P-V), and (P-I) curves are calculated from the PV array simulation designed in an environment
of MATLAB and explaining in particularly their depending on irradiance levels and temperature parameters.
The results agree with the recognized facts that a changed of about 0.4% of the normal PV module power if a
reducing of cell temperature just one degree, also increasing the solar irradiance yields increasing the output
power PV panel.
REFERENCES
[1] I. de la Parraa, et al., “PV performance modelling: A review in the light of quality assurance for large PV plants,”
Renewable and Sustainable Energy Reviews, vol. 78, pp. 780–797, 2017.
[2] N. Onat, “Recent Developments in Maximum Power Point Tracking Technologies for Photovoltaic Systems,”
International Journal of Photoenergy, 2010.
[3] R. Verma and K. Gupta, “Simulation of grid connected photovoltaic system using MATLAB/Simulink,”
International Journal of Advanced Engineering, Management and Science (IJAEMS), vol/issue: 3(6), 2017.
[4] R. Hernanz, et al., “Modelling of photovoltaic module,” Renewable Energies and Power Quality, Granada, Spain,
2010.
[5] P. G. Nikhil and D. Subhakar, “An improved simulation model for photovoltaic cell,” Electrical and Control
Engineering, pp. 1978-1982, 2011.
[6] M. Satyanarayana and P. S. Kumar, “Analysis and Design of Solar Photo Voltaic Grid Connected Inverter,”
Indonesian Journal of Electrical Engineering and Informatics (IJEEI), vol/issue: 3(4), pp. 199-208, 2015.
[7] R. Ayaz, et al., “An improved MATLAB-Simulink model of PV module considering ambient conditions,” Int. J.
Photoenergy, vol. 2014, pp. 1-6, 2014.
[8] H. Sharma, et al., “Modeling and Simulation of Off-Grid Power Generation System Using Photovoltaic,”
TELKOMNIKA Indonesian Journal of Electrical Engineering, vol/issue: 13(3), pp. 418-424, 2015.
[9] Krismadinataa, et al., “Photovoltaic module modeling using simulink/matlab,” The 3rd International Conference
on Sustainable Future for Human Security, SUSTAIN, 2012.
[10] B. A. Allah and L. Djamel, “Control of Power and Voltage of Solar Grid Connected,” International Journal of
Electrical and Computer Engineering (IJECE), vol/issue: 6(1), pp. 26-33, 2016.
[11] H. Ibrahim and N. Anani, “Variations of PV module parameters with irradiance and temperature,” 9th International
Conference on Sustainability in Energy and Buildings, SEB-17, Chania, Crete, Greece, 2017.
[12] A. J. Abid, et al., “Comprehensive Modeling of Photovoltaic Array based on Proteus Software,” International
Journal of Applied Engineering Research (IJAER), vol/issue: 13(6), pp. 4440-4447, 2018.
[13] O. M. Benaissa, et al., “Modeling and Simulation of Grid Connected PV Generation System Using
Matlab/Simulink,” International Journal of Power Electronics and Drive System (IJPEDS), vol/issue: 8(1), pp.
392-401, 2017.
[14] K. S. Srikanth, et al., “A Novel Grid-Connected PV-FC Hybrid System for Power-Management,” International
Journal of Research in Advent Technology, vol/issue: 2(4), 2014.
[15] C. Qi and Z. Ming, “Photovoltaic Module Simulink Model for a Stand-alone PV System,” 2012 International
Conference on Applied Physics and Industrial Engineering, Physics Procedia, vol. 24. pp. 94–100, 2012.
[16] P. H. Zope, et al, “Performance and Simulation Analysis of Single-Phase Grid Connected PV System Based on Z-
Source Inverter,” International conference on Power Electronics, Drives and Energy System, 2010.
[17] R. Ayaz, et al., “An improved MATLAB-Simulink model of PV module considering ambient conditions,” Int.
Journal of Photoenergy, vol. 2014, pp. 1-6, 2014.
[18] Balasubramanian B., “Performance evaluation of solar photovoltaic (PV) array based on mathematical and
simulation modelling: a review,” Aust J Basic Appl Sci, pp. 469-77, 2014.
[19] Ma T., et al., “Solar photovoltaic system modelling and performance prediction,” Renew Sustain Energy Rev., pp.
304-15, 2014.](https://image.slidesharecdn.com/v0823jul1823feb11941performanceinvestigationeditlia-201127061850/75/Performance-Investigation-of-Grid-Connected-Photovoltaic-System-Modelling-Based-on-MATLAB-Simulation-8-2048.jpg)