SlideShare a Scribd company logo
1 of 51
Download to read offline
This PDF is a selection from an out-of-print volume from the National Bureau
of Economic Research
Volume Title: Population and Economic Change in Developing Countries
Volume Author/Editor: Richard A. Easterlin, ed.
Volume Publisher: University of Chicago Press
Volume ISBN: 0-226-18027-1
Volume URL: http://www.nber.org/books/east80-1
Publication Date: 1980
Chapter Title: A Historical Perspective on Economic Aspects of the Population
Explosion: The Case of Preindustrial England
Chapter Author: Ronald Lee
Chapter URL: http://www.nber.org/chapters/c9671
Chapter pages in book: (p. 517 - 566)
9 A Historical Perspective
on Economic Aspects
of the Population
Explosion: The Case of
Preindustrial England
Ronald Demos Lee
9.1 Introduction
The preindustrial context offers particular advantages for the study of
population change and its consequences. Over the course of centuries
the effects of population pressure on resources have a chance to emerge
and to dominate the more transitory influences. And other sources of
long-run economic change, such as technology, capital accumulation,
education, and institutional reorganization, were formerly weaker or
absent. Thus history may provide us with an actual ceteris paribus situa-
tion where statistical attempts to control for extraneous influences on
contemporary development have failed. Of course there is always the
risk that changing circumstances may have rendered the lessons of his-
tory obsolete, but one has to start someplace; the drunk looks for his
dime under the lamppost, though he lost it down the street.
There have been many studies of the effects of population growth on
economic development, but only a few of these studies are empirical.
Ronald Demos Lee is associated with the Department of Economics and the
Population Studies Center, the University of Michigan.
This research was funded by NICHD grant HD 08586-03. I am very grateful
to Professor E. A. Wrigley and Professor R. Schofield of the Cambridge Group
for the History of Population and Social Structure for making the aggregate parish
data set available to me. Philip Mirowski provided valuable research assistance at
all stages of this project, and I also profited from his knowledge of English history
and his creative insights. Professors Gavin Wright, Gary Saxonhouse, C. K. Har-
ley, and Albert Fishlow made helpful comments on earlier drafts. I am particularly
indebted to Professor Marc Nerlove for his detailed comments and his solutions
to some of the analytic problems.
517
518 Ronald Demos Lee
Theoretical studies, and the many simulation studies in the tradition of
the classic work by Coale and Hoover (1958), can be queried on their
premises (see Simon 1976). Cost-benefit studies of marginal lives, pio-
neered by Enke (1960), are empirical only in appearance; their results
can actually be derived a priori for virtually any country, regardless of
its economic situation, as Ohlin (1969) has shown in an ingenious
article.l
Cross-national studies, seeking correlations of population growth
rates and growth rates of per capita income (see, e.g., Kuznets 1967;
Chesnai and Sauvy 1973; Easterlin 1972) have invariably found no
significant association.2 Leff's (1969) well-known article on savings
rates and dependency rates has been so heavily criticized as to leave the
results in serious doubt. So although most economists and almost all
demographers believe high population growth rates are a problem, there
is a surprising shortage of empirical evidence. A study of the conse-
quences of population change in a historical context may help demon-
strate the importance of the variable in at least the simplest case.
Historical studies may also aid our understanding of the causes of
population change. It is sometimes suggested that until a couple of
centuries ago the size of human populations in relation to resources was
effectively regulated by socioeconomic institutions, but that in recent
times these mechanisms have broken down under the influences of mor-
tality decline, urbanization, technical change, and modernization in gen-
eral. However, there is little understanding of how such mechanisms
functioned in the past, how effective they were, and how they reacted
to various kinds of external shocks. An examination of these historical
mechanisms should help us understand to what extent modern and his-
torical experience differ qualitatively, and should provide some perspec-
tive on current high rates of population growth.
This paper has three major parts. The first discusses the consequences
of population change in preindustrial England, concentrating on wages,
rents, and the ratio of industrial to agricultural prices. A simple two-
sector model is developed to organize the analysis. The second part
discusses the cause of population change, focusing on the nature of the
social mechanisms that controlled it and their reaction to variations in
mortality and productivity. In the third part, a simple model of eco-
nomic-demographic equilibrium is developed, in which steady shifts in
labor demand are the main determinant of sustained population growth,
while the equilibrium living standards maintained during expansion re-
sult from the interplay of largely exogenous mortality and institutionally
regulated fertility. These three parts are followed by a brief summary
and conclusion. Appendixes describe the data sources and the formal
development of the dual-sector model.
519 Perspective on Economic Aspects of the Population Explosion
9.2 Effects of Population Change
9.2.1 Overview
For those who care for the overmastering pattern, the elements are
evidently there for a heroically simplified version of English history
before the nineteenth century in which the long-term movements in
prices, in income distribution, in investment, in real wages, and in
migration are dominated by changes in the growth of population.
[Habakkuk 1965, p. 148]
This "heroically simplified version" of English history, which gives
the central role to population change, appears to be accepted by a ma-
jority of economic historians. And since there was a rough synchronism
of changes in population, wages, rents, and industrial and agricultural
prices across Western Europe, many economic historians extend the
same argument to the Continent as well.3 The assertion is that when
population grew, the additional labor that was applied to a relatively
fixed amount of land brought diminishing returns, leading to falling real
wages and rising real rents. Since industry's main input was labor, indus-
trial prices closely followed the real wage. Thus a large population
caused low prices for industrial goods relative to agricultural ones. Since,
however, total agricultural incomes rose with population, so did the
demand for industrial goods; thus industrial output-and with it urbani-
zation-increased when population grew. This extension of the market
encouraged specialization and trade.
Figure 9.1 shows the basic data series for England over the period
1250 to 1800. This analysis will focus on the latter part, from 1540 to
1800, for which better data are available; however, the earlier data help
put this later period into perspective and strengthen the findings by sug-
gesting their wider applicability. The data plotted in figure 9.1 are de-
scribed in Appendix 9.1; however, the population series merits special
mention. It is based on data from 404 parishes, collected and aggregated
by the Cambridge Group for the History of Population and Social Struc-
ture. Although the population estimates used here are still preliminary,
they are far superior to the demographic data previously available.
The series in figure 9.1 shows that the population-induced changes
in the preindustrial economy were not trivial; rather, they were of fun-
damental importance to the people of the time. For example, the seg-
ment of society dependent primarily on wage income was comfortably
off at the end of the fifteenth century; after a century of population
growth their wages had fallen by 60% and their situation was desperate.
Landlords were enriched over this period; industry grew rapidly; and
industrial prices plummeted in relation to agricultural prices.
Life Expectancy
(upper classes)
--,.... - ...Oセ
セ ......
50
.c 40
t
iii 30
:;;
V> 20
セ 10
oGMMMセMMMGMM⦅NlM⦅MMMiN⦅MMGMMMMMG
Population Size
x
'"
"0
E
x
'"
"0
E
Industrial Price
Divided by
Agricultural Price
x
'"
"0
E
Rent/Wage Ratio
x
'"
"0
E
1200 1300 1400 1500 1600 1700 1800
Fig. 9.1 Basic data for England, 1250-1800. For a description of
the data and sources, see Appendix 9.1.
521 Perspective on Economic Aspects of the Population Explosion
9.2.2 Population and Wages
Before developing and estimating the dual-sector model, I will ex-
amine the relation between population and wages in a simpler context.
This will allow me to use annual data and to develop results comparable
to my earlier work.
The wage is of interest because it reflects the marginal product of
labor throughout the economy. It is also of interest because it represents
the chief source of income for a large and growing segment of the popu-
lation, rising from about 30% in rural areas in the sixteenth century to
about 50% in 1700, and perhaps 75% in 1800 (Everitt 1967, pp. 397-
99). While the wages of labor varied by skill and location, the various
wage rates seem to have maintained rather fixed ratios one to the other
(see Finberg 1967, p. 599, and Phelps-Brown and Hopkins 1955), so
that a single wage can be used to represent changes over time in the
experience of most workers.
Under competitive conditions, the real wage is determined by the
intersection of the schedules relating labor supply and demand to the
real wage. The labor demand schedule corresponds to the relation be-
tween the amount of labor utilized in the economy and its marginal
productivity. This will depend on available land, capital, and technology,
among other things, and in England during this period it is reasonable
to expect changes in these to have increased the demand for labor in a
cumulative manner. If the demand schedule shifts outward at a constant
rate p, while maintaining its shape, then its position over time will be
indexed by ePt•
Now consider labor supply. In the short run, the labor services pro-
vided by the population might depend positively or negatively on the
real wage, but there is no possibility of identifying such an effect empiri-
cally with these data. Over the longer run, the supply of labor varies
roughly in proportion to population size, although the age-sex distribu-
tion of the population should also be taken into account.
The combined effects of the shifting supply and demand schedules on
the short-run equilibrium wage may be expressed as:
(1)
or, in log form, as:
(2) In Wt = p. +pt - 7JlnNt + fot.
If the the short-run labor supply schedule is inelastic to the wage, then
7J measures the elasticity of the labor-demand schedule. The rate of shift
of labor demand is p; p. is a scale parameter; and fot reflects the influence
of climate and other omitted variables. The rate at which population
522 Robert Demos Lee
can grow without altering the wage, or the rate of population "absorp-
tion," is plY].
Note that from equation 2 the rate of change of wages (wlw) should
be related to the rate of population change (IVIN) by: wlw = p +
'YJNIN. The data on wand N that were plotted in figure 9.1 can be used
to get a rough idea of 'YJ and pl'YJ' Inspection of the population series
suggests the following periodization:
Population Rate of Change
Growth Rate of Wages
Date (% per year) (% per year)
1535-1605 .65 -.72
1605-45 .49 .15
1645-95 .08 .54
1695-1745 .23 .60
1745-95 .58 -.86
Figure 9.2 plots wlw against N/N, treating each subperiod as an obser-
vation. There is indeed a clear negative relationship between the growth
rates of population and wages, and the slope suggests that 'YJ is about -2
or -2.5. The rate of absorption is apparently about 0.4% per year,
since at that rate of population growth, w/w = O. More rapid popula-
tion growth sharply depresses wages; slower growth allows wages to rise.
The relation of wages to population over this period can be explored
more exactly with regression analysis. For this purpose I have used not
the real wage series shown in figure 9.1, which is deflated by agricultural
prices alone, but the Phelps-Brown and Hopkins (1956) series, which
is deflated by the cost of a mixed basket of goods including both agri-
cultural and industrial commodities. This deflator is more appropriate
for measuring welfare changes. The estimated equation is similar to
equation 2, but somewhat more flexible. In addition to N, population
size, I included variables Nl and N2, which give population size in sub-
periods, allowing the wage-population elasticities to be different in 1539-
1638, 1639-1745, and 1746-1839. In addition to t, I also included t3 .
This allows for the rate of shift to be quadratic in time, accelerating in
the eighteenth century. Omitting the t2
term constrains the rate of shift
to change monotonically over the period. A special time variable, Dt,
allows the period after 1809 to have a different rate of shift; this was
included after inspection of residuals from earlier specifications. Finally,
the error term was corrected for first-order autocorrelation, using the
noniterative Cochrane-Orcutt procedure. The equation was fitted to an-
nual data for 1539-1839, with the following result:
523 Perspective on Economic Aspects of the Population Explosion
12
8
_ 1695-1745
-
1645-95
Cl) .4
OJ
セ
'0
Cl)
g' 0
'"
.t::
U
'0
Cl)
<ii
0:: -.4
-.8
-1605-45
_1545-1605
-1745-95
Fig. 9.2
(3)
-1.2 ャMMMMャ⦅セMMlNNMNlNNMNjャNMMNQNNMセMNNNiMMャMMMMj
o .2 .4 .6 .8 1.0
Rate of Change of Population
Rates of change for population and wages in England,
1540-1800. Rates are given in percentage per year. Rates
of change of wages are calculated from centered thirty-
year averages of wages, except for 1795.
1nWt = 6.81 + .0057t - .18 X 10-8
t3
+ .008Dt
(7.27) (3.16) (.13) (3.77)
- 1.511nNt + .0071 InNl t + .0075 InN2t
(5.61) (.87) (.58)
R2 = .161 (for changes in Inw);
t-statistics are given in parentheses below each estimate.
The results may be interpreted as follows:
i. Real wage levels were very sensitive to population size, with an
elasticity of -1.5; thus a 10% increase in population caused a 15%
decrease in real wages. This estimate is significant at the .001 level.
The elasticity is lower than that suggested by figure 9.2 because of
the difference in deflators.
524 Robert Demos Lee
ii. Surprisingly, there is virtually no change in this elasticity from sub-
period to subperiod, as is shown by the small and insignificant coeffi-
cients for 1nN1 and 1nN2.
lll. The coefficients of ( and (3 show that the rate of shift in the relation
between population and wages, reflecting technical change and capi-
tal accumulation, did not accelerate in the eighteenth century with
early stages of the industrial revolution. This also is a surprising
result.
IV. From 1539 to 1810, a population growth rate of 0.38% per year
would have been consistent with a constant real wage. After the
Napoleonic wars, the rate of shift more than doubled, and a growth
rate of 0.88% per year would have left wages unchanged. This
shows a dramatic alteration in the growth rate of the demand for
labor.
v. The low R2 is due to the Cochrane-Orcutt transformation, which
causes quasi-differences in the data, emphasizing their short-run
variability.
Perhaps the most striking aspect of all these estimates is the size of
the wage-population elasticity. If production obeyed a Cobb-Douglas
production function, these elasticities would equal minus the share of
nonlabor inputs, or 0.4 to 0.6. The estimate above is about three times
this great, suggesting that the Cobb-Douglas interpretation is incorrect.
I will discuss this point in detail in the next section.
Since (3, N1, and N2 all had insignificant effects, and the period after
1809 seemed quite different, I reestimated a simpler version of equation
3 for 1539-1809, correcting for second-order autocorrelation using an
iterative Cochrane-Orcutt procedure.
(4) lnWt = 25.59 + .00645( - 1.62lnNt
(11.73) (10.03) (9.23)
R2 = .75 DW = 1.97
R2 for changes = .19;
(-statistics are given in parentheses. These estimates are consistent with
equation 3. The implied rate of absorption is 0.4% per year, and the
wage-population elasticity is -1.62.
It is interesting to compare the results of this part with previous work
I have done using less satisfactory demographic data4 (see table on next
page).
The elasticities estimated in equations 3 and 4 are larger in absolute
value than the earlier estimates, but given the differences in data, time
periods, and time units, I do not find the differences troubling. The
principal inconsistency arises from the estimates of rate of population
absorption. The previous studies, taken together, suggest a fivefold in-
525 Perspective on Economic Aspects of the Population Explosion
Annual
Period Time Wage-Population Rate of
Source Covered Units Elasticity ('YJ) Absorption
Lee 1973 1250-1700 50 years -1.10 .00089
(7.05)
Lee 1977 1705-89 5 years -1.29 .0046
(3.69)
Equation 4 1539-1809 1 year -1.62 .0040
(9.23 )
crease in this rate between 1250-1700 and 1705-89. This increase
seems a plausible reflection of the agricultural and industrial revolutions.
However the estimate in equation 3 shows no sign of an accelerating
rate of shift. I have no explanation for this inconsistency, although the
estimated dual-sector model will show that this constant rate of absorp-
tion masks important differences in rates of shift between sectors.
9.2.3 A Dual-Sector Model
The effects of population growth on the economy can be understood
in richer detail if we distinguish between the agricultural and nonagri-
cultural sectors. In this section I will develop a simple model of a dual-
sector economy; in a subsequent section I will test it empirically. In the
model, agricultural production exhibits sharply diminishing returns to
labor, owing to the relatively fixed supply of land. Industrial production,
which uses labor and agricultural output in fixed proportions, encounters
no such bottleneck. The demand for industrial and agricultural output
is such as to leave their shares in national income constant, when valued
at current prices.
Throughout I will assume that the English economy was closed. In
fact, exports made up about 5% or 6% of national income in 1688,
rising to 14% by 1800 (see Deane and Cole 1969, p. 309). Some justi-
fication for the closure assumption is given by Kelley and Williamson
in the context of Meiji Japan (1974, chap. 12).5
Capital and capitalists are ignored completely by the model, except
that land-augmenting investment and technical progress at a constant
rate are allowed in agriculture.« This is a model of a preindustrial econ-
omy; the industrial sector is largely passive and is not intended to pro-
vide insights into the beginnings of the industrial revolution. Details of
the development of the model are given in Appendix 9.2; here I will
discuss only the assumptions and the main results.
Industrial Production
The nonagricultural sector, which I will for convenience call "indus-
trial," provides such diverse items as domestic service, buildings, textiles,
526 Ronald Demos Lee
lace, household goods, iron products, and so on.7 Production in this
sector directly requires only trivial amounts of land. The main inputs
are labor and agricultural output, such as skins, wool, and grain. I
assume that these inputs are combined in fixed proportions.
By appropriate choice of units of measure for agricultural output, A,
and labor, N, the fixed input coefficients can be made to equal unity.
Thus,
(5)
where I is "industrial" output, NI is labor employed in the industrial
sector, and Al is agricultural output used in the industrial sector. If no
inputs are wasted, then:
(6)
I will further assume that there are no profits in this sector, so that
the price of industrial output, PI, just equals the cost of inputs, WI + P.{,
where WI is the industrial-sector wage and p.{ is the price of agricultural
output. A comparison of the wages of builders' helpers (Phelps-Brown
and Hopkins 1955) and agricultural laborers employed in nonseasonal
work without remuneration in kind (Finberg 1967) shows that these
were equal in southern England from 1450 to 1650. I will therefore
assume that WI = WA and drop the subscript. Thus:
(7)
or, taking A as the numeraire, as I will throughout,
(8) p = w + 1,
where p = PAIPl and w = WIPA •
From equation 8 it is easy to determine the effect of population change
on the terms of trade between industry and agriculture. Let YI = wip
be labor costs as a proportion of total costs in industry. Then, if N = N.{
+NI is the total labor force (by assumption, fully employed), and E
denotes "elasticity,"
(9) Ep,N = yIEw.N'
Changes in technology and formation of industrial capital can best be
described as labor-saving rather than material-saving. This was particu-
larly true for textile manufacture but probably was false for the iron
industry, which became important only at the very end of the period.
Labor-augmenting change at the constant rate p has the effect of reduc-
ing labor requirements by a factor of e- pt. Thus, for example, equation
8 can be rewritten:
(10) p = e-ptw + 1.
527 Perspective on Economic Aspects of the Population Explosion
The Demand for Industrial Output
The amount of industrial output demanded by a household typically
depends on its income, with an elasticity greater than 1, and on the
relative price of industrial goods, with an elasticity less than O. These
effects can be incorporated at the household level by a linear expendi-
ture system, which has the advantage of being aggregable. Although it
would be desirable to incorporate such a demand specification, in the
present model I assume that the shares of agriculture and industry in
national income, valued at current prices, are fixed. This is equivalent
to assuming income elasticities of unity for both kinds of goods, and
price elasticities of minus one. The assumption is not so implausible as
it may first appear, since the incomes of landlords and laborers typically
moved in opposite directions. Historical data suggest a major decline in
agriculture's share at the end of the eighteenth century but have been
interpreted in conflicting ways concerning earlier changes.8
Final product in agriculture is total product less the portion used in
the industrial sector: A - I. The value of total output is: A - I + pI
= A + I (p - 1). The assumption of constant shares can conveniently
be written:
(11) pI = A(A -l),
since this yields a share of final product in agriculture of 1/(1 + A), a
constant.
This does not mean, of course, that in real terms the ratio of nonagri-
cultural to agricultural consumption was constant; quite the contrary.
Growing population would confront diminishing returns in agriculture,
depressing wages and industrial prices, as indicated by equation 9. The
assumption of a constant share of industry in national income would
therefore require an increasing share of industry in real output, when
population grew. And indeed this is historically accurate (see Deane
and Cole 1969, p. 162).
The ratio of industrial to agricultural output, both intermediate and
final, 1/A, turns out to be:
(12) I/A = ,j(w + 1 +A).
This clearly increases as w falls; therefore, when population grows, in-
dustrial output increases more, proportionately, than does agricultural
output. For a detailed discussion, see Appendix 2F.
Agricultural Production
Unlike industry, agricultural production is constrained by a relatively
invariant supply of potentially arable land. However, conditions of agri-
528 Ronald Demos Lee
cultural production certainly did not remain static over the period under
consideration. On the one hand, new rotations were adopted and new
crops sown, land tenure arrangements were altered, and greater use was
made of farm animals and fertilizer. Some of these changes may be
regarded as reactions to changing factor prices, themselves due to popu-
lation change; others represent genuine technological progress. On the
other hand, the supply of land was increased through investment in such
projects as draining the fens; and investments also facilitated the more
efficient use of existing arable land, particularly in association with en-
closure. These changes can be described as "land-augmenting." Lacking
detailed information on the timing and extent of these changes, I will
attempt to capture them by an exponential trend.
As noted above, the large (in absolute value) estimated wage-popula-
tion elasticity is inconsistent with a Cobb-Douglas production function;
so aCES (constant elasticity of substitution) production function will
be assumed in agriculture. Denoting by F the initial quantity of land,
and by p the rate at which land is augmented by reclamation, invest-
ment, and technological progress, the CES production function can be
written:
(13)
If agricultural labor is paid its marginal product, then w = [(1 - 01)/
0o/l](A/NA)lH or, alternatively, for appropriate a and b:
(14) w = a[NA13e-{1pt + b]-(l+/l)/I3.
This relation can be estimated from data on real wages and employment
in agriculture.
Total rents-whether explicitly treated as such or merely imputed to
land-are the remainder after labor has been paid: R = A - wNA ,
where R is total money rents divided by PA • In a CES production func-
tion, the ratio of returns to inputs is simply related to the ratio of input
quantities; here:
(15)
Alternatively, the rent per efficiency-unit of land, r = R/ (FePt ), is re-
lated to wages by:
(16)
These equations are easily estimable after a log transformation. How-
ever, it is impossible to know for any particular rent series whether it
indexes R or r, since it mayor may not include the return to new invest-
ments in the land.
An important shortcoming of this analysis is that investment in agri-
culture is left exogenous and is indeed assumed to take place at a con-
529 Perspective on Economic Aspects of the Population Explosion
stant rate. But it is clear that agricultural investment and also perhaps
technical change was more rapid when rents and agricultural prices were
relatively high, and these themselves depended on population. It might
be possible to get at these issues empiricaIIy through analysis of bills of
enclosure. By ignoring these effects, I have surely overstated the long-
run negative effects of population growth in England. However, regres-
sions that do not include a shift term do not suffer from this bias, and
they confirm the negative effects of population, although with a lower
elasticity (see Lee 1973, p. 588).
Labor Force Allocation
In this model, wages vary because of variation in the labor employed
in agriculture, NA. However, data on NA are not available; there are only
data on N, the total labor force. Estimated relations between wand N
reflect in part the effect of N on the allocation of labor between the two
sectors. For this reason it is important to analyze the determinants of
sectoral labor force aIIocation.
In Appendix 9.2.B it is shown that:
(17)
where /,A is labor's proportional share of agricultural output, which
makes it possible to calculate the implied labor force share of agriculture.
In Appendix 9.2.C, foIIowing Marc Nerlove's analysis of this model,
it is shown that:
(18) eセ .N = セQ +Ew .N ZI (p:aIセ /
セQ - (1 - /'A) セiャN
This result is particularly useful, because it makes possible the calcula-
tion of EW 'N.4 and (T = 1/(1 + f3). In Appendix 9.2.D it is shown that:
(19) (T = -(1 - /'A)ENA
.N/Ew .N.
9.2.4 Empirical Results for the Two-Sector Model
Population and Wages
Under the CES specification, the elasticity of wages with respect to
labor is a variable, not a constant. It is therefore inappropriate to esti-
mate log-linear equations such as equations 1 through 4 above. The
appropriate procedure is to estimate the highly nonlinear equation 14,
using maximum likelihood methods. My attempts to do so failed; the
program encountered nearly singular matrixes it could not invert. An
alternative approach is to estimate a log-quadratic approximation (see
530 Ronald Demos Lee
Kmenta 1971, pp. 462-65); my attempts to estimate f3 and (J in this
way were also unsuccessful. Therefore I reverted to estimates of the log-
linear equation, a decidedly inferior procedure.
In the dual-sector context, the log-linear wage-population regressions
discussed above in section 9.2.2 are not appropriate, since the real wage
employed there was based on a fixed basket of goods that included both
industrial and agricultural products. This is an appropriate standard to
use for welfare comparisons, but for the purpose at hand the money
wage should be deflated by agricultural prices alone. The regression
reported below uses decadal averages of money wages from Phelps-
Brown and Hopkins (1955) for 1540 through 1700, and for the eigh-
teenth century uses a series reported in Deane and Cole (1969, p. 19),
which takes into account regional differences in wages and population
growth. The wage is deflated using the agricultural price index described
in Appendix 1.
Rather than using total population as a proxy for labor supply, it was
possible to take account of age structure, as estimated by the inverse
projection method (see Lee 1974). Ages 0-14 were weighted by zero,
15-64 by 1, and 65+ by 0.5.
Several versions of the log-linear regression were run. The one re-
ported below allows for different EW •N in three time periods: 1540-1629,
1630-1719, and 1720-1800. It also includes linear and cubic shift
terms.
(20) 1n(w) = 14.6 + .0103t - .533 X 1O-7
t3
(9.16) (5.21) (3.43)
- 2.22 inN + .0197 inN1 + .0596inN2
(7.08) (1.20) (2.31)
R2 = .832 D.W. = 2.14.
There are several points worth noting. First, the estimates of Ew.N ,
which range from -2.22 to -2.16 depending on the period, are even
greater in absolute value than those in section 9.2.2. In other specifica-
tions of this equation, not reported here, they reach -2.7. There is a
simple explanation for the discrepancy between these and the earlier
results: when the cost of a mixed bundle of commodities is used to
deflate the money wage, population change induces partially offsetting
variations in the costs of the industrial and agricultural components.
Therefore the estimated elasticity is closer to zero.
Second, although there is a statistically significant change in Ew .N for
the last subperiod, the effect is numerically inconsequential.
Third, and quite striking, the initial annual rate of land-augmenting
change, measured as p/YJ, is 0.45 %, but by 1800 it has declined to zero
(that is, for fixed N, olnw/ot evaluated at t = 260 is roughly zero).
(21)
531 Perspective on Economic Aspects of the Population Explosion
In other specifications the rate of shift also declines, but only by about
two-thirds. This eighteenth-century retardation in agricultural progress
is consistent with the view of Deane and Cole (1969, p. 75), which was
based on quite different evidence.
Population and Terms of Trade
Data for constructing the terms-d-trade index were available for ten-
year periods from 1541-50 to 1791-1800, giving 26 observations. Some
splicing was necessary, and the last 100 years of the series are not com-
pletely comparable with the first 160. This is a serious difficulty with
the results presented below, since different industrial commodities have
different labor intensities. Nonetheless, I have taken the data at face
value for present purposes.
In developing the model, I made simplifying assumptions about units
of measure. In practice the simplifying transformations can be made
only after estimation has taken place. The equation estimated, there-
fore, was not equation 10; two scaling parameters were added, as well
as a more flexible rate of labor-saving progress. The following are max-
imum likelihood estimates:
Pt = 12.8 + 1.63e-·OOl7t-.243XIO-7t3Wt
(4.24) (14.1) (2.49) (2.79)
R2 = .91 D.W. = 1.58.
This estimated equation can be transformed to the form of (10) by
defining: p= p/12.8 and w= (1.63/12.8)w = .127w. Then:
(22)
The estimated coefficients of t and t3 imply an annual rate of labor-
saving change of only 0.117% in 1540, rising to 0.304% in 1700 and
0.061 % in 1800. Thus, while the rate of progress in agriculture was
declining, that in industry was accelerating. The cumulative effect of this
change was to reduce the labor inputs per unit of output by 25% be-
tween 1540 and 1700, and between 1700 and 1800 by a further 36%.
Over the entire 260-year period, labor requirements were reduced to
48% of their initial level.
The rates of shift in the two sectors, and their changes over time, are
plotted in figure 9.3. The time paths appear to be mirror images, and
the sum of the two rates is nearly constant. This reveals clearly the sec-
toral differences that were concealed by the constant rate of absorption.
The parameter estimates in equation 21 can also be used to estimate
Yh labor's share of costs in industry. The average wage was 29.5, which
transforms to .127 X 29.5 = 3.75. Initially, therefore, Y1 = 3.75/4.75
= .79; labor costs were about 80% of total costs of industrial produc-
532 Ronald Demos Lee
Rate of Labor Augmenting
Progress In Industry
Rate of Land Augmenting
Progress In Agriculture
セ
OL-_-....L..---L.--_....L_--=,:-:---..L.,_--=::'""../
1500 1550 1600 1650 1700
0.8
'"
oJ!. 0.6
Q)
a.
3, 04
'"
C
セ 0.2
3:
Fig. 9.3 Estimated rates of progress in agriculture and industry.
Calculated from equations 20 and 21.
tion. By 1800, however, "II had fallen to .48 X 3.75/(.48 X 3.75 + 1)
= .64. These estimates suggest that the effect of population change on
terms of trade also declined (see eq. 9). In 1540, Ep,N = .79(-2.22)
= -1.75; in 1800, Ep,N = .64(-2.16) = -1.38. These estimates seem
on the high side (in absolute value) when compared directly with his-
torical evidence (see Lee 1973, p. 591).
I should caution that domestic service, which made up a large propor-
tion of the nonagricultural sector, is not included in the industrial price
index. The effect of its inclusion would doubtless be to raise "I, labor's
share of the cost inputs.
Population and Rent
Of all the data series, that for rent is undoubtedly the worst (see
Appendix 1E). It is the shortest, covering only the period 1540 to 1660,
in time units of ten years; thus there are only twelve observations. It is
also unclear just what theoretical concept is represented: Does the series
include rents on marginal lands brought into cultivation only under
pressure of rising agricultural prices? If so, the increase in rents as
population grows will be understated. Does it include rent changes re-
flecting investment in the land?
I used the rent series to form the ratio R/w, which under the CES
specification is log-linearly related to N A , as in equations 14 and IS. The
actual regression uses N, not NA; results can be interpreted with the help
of EN A,N (see Appendix 2E) .
(23) In(Rt/wt> = -36.6 - .0420t + 7.50 InN,
(2.99) (2.63) (3.08)
R2 = .77 D.W. = 2.60.
Because the time period is relatively short, and population was growing
fairly rapidly over most of it, time is quite colinear with InN. When a
533 Perspective on Economic Aspects of the Population Explosion
quadratic or cubic time-shift term is included, population's coefficient
becomes small and insignificant.
The implied annual rate of land augmenting change is roughly .042/
7.50 = 0.56%, compared with an estimate of 0.44% for this period
from equation 20.
From equation 20 or equation 23, we can derive an estimate of the
elasticity of substitution in agriculture. First, however, eセ ,N must be
evaluated using equation A20 in Appendix 2. This requires estimates
of N1/N, YA, Ew,N, and w/(p + "). Reasonable mean values of these
variables are NriN = .35, YA = .45, Ew .N = -2.22, and w/(p +,.)
= .6.9
These imply ENA ,N = .66, so that as population rises, the propor-
tion of the labor force agriculture declines quite markedly. Using equa-
tions A22 and A27, the implied estimates of (J can be derived. These
are 0.16 from equation 20 or 0.09 from equation 23. The first figure is
surely more accurate, since it is based on the full 260 years, while the
second is based on only 120 years.
Is an estimated elasticity of substitution as low as 0.16 at all plau-
sible? I am not sufficiently familiar with the agricultural techniques used
to be able to form a judgment. Most modern studies of agricultural
production report values in the neighborhood of unity, although low
values, near 0.2, have been estimated for Meiji Japan (Sawada 1970)
and India (Srivastava and Heady 1973).
The reader may have noted that all the estimates of population's
effects were made using single-equation methods. However, if population
growth rates are themselves dependent on economic welfare, then the
system is simultaneously determined, and single equation methods will
yield biased parameter estimates. In previous work (1973, 1978a, b) I
have dealt with this problem at length. It turns out that simultaneity bias
is not very important when estimating effects of population change; it is,
however, a serious problem when examining the causes of population
change. So the results reported in this part should not have been seri-
ously biased by the use of single-equation methods.
Miscellaneous Effects at Population Growth
I have already discussed the effects of population growth, relative to
augmented land, on wages, rents, and the terms of trade. Population also
affected the composition of output. In Appendix 2, expressions for the
effect of population on I and on 1/A are derived (see eq. A29, A30).
Evaluating these expressions gives E1/A,N = 1.33 and E 1.N = 1.65. Thus
a 10% increase in population would increase 1/A by 13% and increase
I by 16.5%.
Labor-saving progress in industry has a similar effect on the composi-
tion of output. Evaluating expression A42 yields E1•a = -.85; thus al-
534 Ronald Demos Lee
most all the labor released by progress in industry is used to boost
output in industry.
The effects of technical change and population growth taken together
go a long way toward explaining the rapid industrial growth of the late
eighteenth century. Using expression A28 for 1/A and evaluating it in
1731-40 and in 1791-1800, I find that over this sixty-year period,
industrial output in real terms should have increased by 60% more than
did agricultural output. This compares with a figure of 90% derived
from Deane and Cole (1969, p. 78). Thus the combination of rapid
population growth, rapid improvement in industrial technology, and
slowing change in agricultural technology accounts for much of the
increased importance of industry.
Population growth also had an important effect on the factor distribu-
tion of income. For farmers working their own land, these effects would
have been relatively unimportant; but for landlords and laborers the
effects were very large. Evaluating expression A37, I find Es.x = -1.4,
where S is labor's share of total output. Thus a 10% increase in popu-
lation would reduce S from perhaps 55% to 47%.
Finally, I should stress that the estimated value of EII'.,Y = -2.22
greatly overstates the effect of population change on material welfare,
because the wage is expressed in terms of the agricultural commodity.
Consider instead a wage deflator based on a 50-50 mix (in terms of
mean value) of agricultural and industrial commodities. This is essen-
tially the real wage concept measured by Phelps-Brown and Hopkins
(1956), and used in section 9.2.2 above. Call this real wage w*. Then,
given actual mean values for wand p, it can be shown that E,c'.,Y .
(5/8)Ew •N . _1.4.10 This agrees very well with the estimates of section
9.2.2 above (-1.5 and -1.6).
9.3 Causes of Population Change
9.3.1 A Test of Two Simple Theories
The broad issues were already sketched in the Introduction: Is popu-
lation an endogenous element in the socioeconomic system, regulated
by norms and institutions so as to establish and protect a culturally
defined standard of living? Or is population an independent force that
determines levels of living, and to which the society and economy must
adjust as best they can? The former view has been held by many classi-
cal and neoclassical economists from Malthus to Harberger (1958, pp.
109-10), and by many biologists and ecologists as well (e.g., Dubos
1965, pp. 286-87). The latter view is generally held by historians,
demographers, and some economists.
535 Perspective on Economic Aspects of the Population Explosion
In its simplest form the classical theory-which makes population
endogenous-posits a functional relation between the population growth
rate and the level of wages. There will be some wage corresponding to
zero population growth; this equilibrium wage is the conventional living
standard or natural price of labor. In figure 9.4 I have plotted popula-
tion growth rates against the wage level for twenty-five-year periods,
1550 to 1799, using the data introduced above. It is clear that there is
no strong relation between the two; the scatter provides no support for
the classical theory as applied to this period. In fact, similar results hold
for the entire period 1250 to 1789 (see Lee 1973, 1978a).
The alternate theory holds that population varied independently. The
simplest version argues that fertility is maintained at relatively fixed
levels by institutions and customs that have evolved over the long run
to ensure population replacement. Over the shorter run, population
growth rates are determined by variations in mortality, since fertility
does not change. In figure 9.5 I have plotted English population growth
rates against the life expectancy of the British aristocracy (see Appendix
lA) for twenty-five-year periods, 1550 to 1724. After 1724, this life-
expectancy series is no longer representative of the general population;
before then, it compares well with other series in so far as changes are
concerned, if not levels.u Figure 9.5 shows a very close relation between
mortality and population change over this 175-year period. And since
the data come from totally different sources, there is no possibility that
the relation is an artifact due to errors in measurement.
.8
•
•
•
•
•
•
•
•
•
•
40 50 60 70
Wage Rate (Index)
Fig. 9.4 Population growth rates and the real wage for twenty-five
year periods, 1550-74 to 1775-1799.
536 Ronald Demos Lee
38
:2 36
t:
15
10
V>
セ 34
2::
>-
"
c:
'"
1:3
'"
セ 32
2
.:;
30
••
•
•
•
• •
o 2 .4 .6 .8
Fig. 9.5
Rate of Change of Population
(percentage per year)
Population growth rates and life expectancy of the British
aristocracy, by twenty-fIve-year periods 1550-74 to 1700-
1724.
This is strong support for the view that population growth rates varied
independently, not primarily in response to changes in wages or the de-
mand for labor (for formal tests of these hypotheses see Lee 1973,
1978a, b). But how then are we to explain the broad historical agree-
ment of economic and demographic trends? In subsequent sections I
will discuss in more detail the mechanisms thought to have regulated
population in relation to resources in preindustrial Western Europe and
attempt to reconcile the dependent and independent aspects of popula-
tion change.
9.3.2 Fertility and Mortality
The Preventive Check
To the extent that European societies controlled population, it was
almost entirely through regulation of fertility, not mortality. The con-
ventional view of the mechanism linking fertility to resources in prein-
dustrial Western Europe has not changed in broad outline since Malthus:
Marriage required a sufficient livelihood, in the form of property or an
adequate wage income. "Sufficiency" was defined by longstanding norms
and institutions, which varied from country to country. Thus Malthus
thought that the English were more prosperous than other Europeans
because they regarded wheat and meat as necessities and would not
537 Perspective on Economic Aspects of the Population Explosion
marry without income enough to provide them for their families. Euro-
peans in general were regarded as more prosperous than other peoples
because they required more comfortable circumstances before they were
willing to marry. Once married, couples were believed to bear children
at a "natural" rate, while making no efforts to control family size. Such
a system would relate aggregate fertility rates to per capita income or
wealth, and to wage rates.
Whereas historical demographers have confirmed the general outline
of the natural fertility theory, a number of studies have shown that in
the eighteenth and nineteenth centuries, at least, marital fertility as well
as nuptiality responded positively to the harvest cycle. There is also some
mixed evidence that on balance suggests that wealthier couples may not
only have married earlier, but also have had higher fertility within mar-
riage (see Smith 1977).
The Cambridge Group's aggregate parish register data set makes it
possible to analyze the effect on vital rates of short-run variations in the
real wage. It provides series of the annual numbers of baptisms, burials,
and marriages in 404 parishes from 1539 to 1839. In theoretical work
described elsewhere (Lee 1975, 1978a) I have shown that short-run
fluctuations in such series can be interpreted as fluctuations in marital
fertility, mortality, and nuptiality. This enables us to draw demographic
inferences from changes in the numbers of events without bothering
about the size and structure of the population at risk. I have also shown
(Lee 1978a) that short-run fluctuations can be used to study the causes
of population change without contamination by the simultaneity in the
system.
I have used cross-spectral analysis to estimate these relations, in part
because for compelling reasons the theoretical analysis mentioned above
had to be carried out in spectral terms.12
However, given the theoretical
results, the empirical work could have been carried out by regression
analysis after suitable "filtering" of the series.
Spectral analysis examines the variances and covariances of sets of
series by frequency or periodicity. Any detrended series may be exam-
ined in this way; there is no presumption that there are cycles in the
data. It is convenient, although not entirely accurate, to think of fre-
quency here as distinguishing, say, between long-run (low-frequency)
and short-run (high-frequency) components of variation in the series.
My previous work has established that for wavelengths of less than
fifteen years or so, the population size and age structure, and the dura-
tion structure of marriages, have only negligible effects on births, deaths,
and marriages. For my purposes, therefore, I will refer to these as "short
run."
I will use three basic cross-spectral concepts in this paper. The first
is "coherence squared," denoted C'2(A), which is analogous to R2 in
538 Ronald Demos Lee
regression analysis but is specific to wavelength '. The second is phase
shift, cj> ('), which measures the lag of one series behind the other in
radians at each wavelength. The third is "gain squared," G2(,), which
is analogous to the square of a regression coefficient, again specific to
wavelength.
Estimated cross spectra for births and marriages in relation to wages
are presented in figure 9.6. First consider births. For periods of thirteen
years or less, C2 (,) is typically significantly greater than zero, indicating
that wage fluctuations did indeed affect marital fertility, explaining per-
haps 25 % of the variance. The phase shift diagram indicates that mari-
tal fertility lagged slightly behind the wage rate, by something less than
a year. I have not drawn in confidence bands for the phase estimates, but
Births by Wages Marnages by Wages
o
」ッlNNZRャZZPNNNLQGZZMPMZVGMZNWLNMMMNNjTLNMMMMZSセN SZZMZZGRM]UセR
.6
oLag
2
oC..J.,..-J-......l-.--'------,-L--L --:
co 2010 6.7 4 3.3 2.5 2
4
6
055',,,,,,,",, '''I
.6
C>U .4
U
c"o
セ セ
セ セ .2
o a-
UUl
""
セ
ol:'
セvI
セ セ 2
","0
.I: '"
。NNセ
4 3.32.5 2
.6
Wavelength, I., In Years Wavelength, ;" In Years
Fig. 9.6 Cross-spectral estimates of births and marriages by wages
for England, 1539-1839. Phase estimates indicated by solid
circles correspond to significant estimates of coherence
squared and are more accurate than others. Estimates were
made using a Parzen window with T = 301, M = 20.
Births, marriages, and wages were measured as the resi-
duals from a regression of the lag of the basic series on
time.
539 Perspective on Economic Aspects of the Population Explosion
they are very narrow, typically about ±0.3 radians. The estimates of
02(A) can here be interpreted as elasticities,13 suggesting a value of 0.3.
I also estimated separate cross spectra for each of the periods 1539-
1638, 1639-1745, and 1746-1839 and found virtually identical results
within each subperiod. This establishes the existence of a procyclical
response of marital fertility to wages as far back as the sixteenth century,
with no noticeable change in the timing or sensitivity of the relationship.
The estimated cross spectrum for marriages and wages shows a co-
herence-squared very similar to that for fertility. The phase diagram
shows that nuptiality responded to wages with no lag at all, in contrast
to fertility. The gain-squared estimates show that the elasticity for nup-
tiality was on the order of 0.5, or nearly twice as high as that of fertility.
Generally, the association was closer and more sensitive for fluctuations
of about ten years' periodicity than it was for very short-run fluctuations.
To summarize, these results show that as far back as the sixteenth cen-
tury, both marital fertility and nuptiality were strongly influenced by
short-run variations in the real wage, which explained 20% to 30% of
their short-run variance. Without making any judgment on whether the
association of marital fertility with wage variations was due to voluntary
limitation of fertility, these results provide some support for the existence
of an aggregate relation between general fertility and wages.14
The Positive Check
While the role of exogenous mortality decline in the current LDCs'
rapid population growth is widely acknowledged, it is less well known
that large exogenous changes in mortality occurred in the past, leading
to major population swings in Europe from the thirteenth through the
eighteenth centuries. And I refer not to catastrophic mortality associated
with periodic harvest failure or epidemic, but rather to long-run changes
persisting for decades or centuries. The causes of these shifts are ob-
scure; they may have been climatic, or the by-product of independent
epidemiological and ecological changes, or the result of voyages of ex-
ploration. But that these changes occurred is clear; their magnitude is
suggested by the life expectancy series for upper-class Englishmen
shown in figure 9.1. Other confirming evidence is found both for Eng-
land and for the Continent in reconstitution studies based on parish
registers, in data from religious orders and the professions, and in the
analysis of wills and death taxes. The exogeneity of the changes is clear
from their temporal relation to changes in wages and population size,
and from their disregard for class distinctions (see Chambers 1972; Lee
1973, 1978a and 1978b).
I do not mean to suggest that mortality was completely independent
of income; but the importance of this endogenous component has been
greatly exaggerated. The extent to which mortality was associated with
540 Ronald Demos Lee
wages in the short-run can be studied with the Cambridge Group's par-
ish data; figure 9.7 shows the relevant cross-spectral estimates. The
coherence-squared indicates that only about 10% of the variance is
explained, less than half the amount explained for nuptiality and marital
fertility. The phase diagram is somewhat erratic but suggests that mor-
tality and wages were negatively related, with mortality lagging by from
zero to one year. The squared gain, not shown here, suggests an elas-
ticity of about -0.5. (For an analysis of wages and mortality by cause
of death in sixteenth- and seventeenth-century London, see Mirowski
1976.)
I have also analyzed the relation of wages to the rate of natural in-
crease; these results are also shown in figure 9.7. The coherence-squared
averages about 0.15, with a very small lag of growth behind wages. The
elasticity is not a useful measure of sensitivity in this case. It is more
helpful to note that a doubling of the real wage would increase the pop-
ulation growth rate by about 1.25% per year, ceteris paribus.
Direct Links of Fertility to Mortality
I have so far discussed the relations of fertility and mortality to wages.
Now I will briefly consider the possibility that there were direct links of
fertility to mortality, such that fertility would adjust to changes in mor-
tality. Several such links have been suggested in the literature. One is
that, through inheritance, high mortality resulted in the transfer of assets
to the nubile, thus increasing nuptiality, then fertility (Ohlin 1961). The
cross spectrum of marriages and deaths lends some support to this hy-
pothesis. However, it is only the redistributive effect that should be
counted here; changes in the population/wealth ratio are an indirect
influence of mortality on fertility, already reflected in the wage rate.
Another suggested link is that couples may have attempted to replace
unexpected infant and child deaths and that, when mortality changed,
they would eventually revise their mortality expectations and adjust their
fertility accordingly. This argument requires the assumption that couples
controlled their fertility and strove for some number of surviving chil-
dren, in contrast to the natural-fertility hypothesis. Knodel (1975) has
shown that this "replacement hypothesis" is false for a sample of pre-
industrial European parish populations. My own studies of the short-run
relation of fertility to mortality show a very strong negative relation.
Perhaps the most convincing evidence that fertility did not strongly
compensate for mortality changes even over the long run is given by
figure 9.5, which shows a very close correlation of mortality and popu-
lation growth rates over a period of 175 years.
To sum up section 9.3, I have shown that, at least in the short-run,
there was an endogenous component to population change, operating
through nuptiality, marital fertility, and mortality. Presumably these
541 Perspective on Economic Aspects of the Population Explosion
Deaths by Wages Rate of Natural Increase
by Wages
2
o
PPGMZZMRGZZMPセQolMMMjVMNWMNNNャNTMMZSNNNャNN 3-'-2.-5--'2
.6
 セッ Lag
-- Mセ
----f'Yr. Lag
°00'-=2'::0-,''::O--::6'-::.7:-....I
4
:---::
3
,-'.3::---:'-2--=.5-...=-::.o.J.
2
4
6
.6
:::s
<b U .4
u
c"o
セ e
Q) '"
.c ::J
o cs
UVl
Nセ
-0.
セ.c _
Vl セ
セ -6 2
.c '"
clセ
Wavelength. i,. In Years Wavelength. 2. In Years
Fig. 9.7 Cross-spectral estimates of deaths and rate of natural in-
crease in relation to real wages for England, 1539-1839.
Phase estimates indicated by solid circles correspond to sig-
nificant estimates of coherence-squared and are more ac-
curate than the others. Estimates were made using a
Parzen window with T = 301, M = 20. Deaths and wages
were measured as residuals from the regression of the log
of the basic series on time. Natural increase was used
untransformed.
short-run relations also held over the long run, although these data
provide no evidence on this point. Even in the short run, however, wages
account for only about 15 % of the variance in growth rates, so that
most of the variation is exogenous. Furthermore, inspection of long-run
life-expectancy series, as in figures 9.1 and 9.4, suggests that long-run
variation in population growth rates was also dominated by exogenous
variation.
Under these circumstances, over the very long run, the average wage
level will be an important determinant of average population growth
rates. But even over the course of centuries, fluctuations of growth rates
about that average level may be largely exogenous.
9.4 A Model of Economic-Demographic Equilibrium
At this point it will be helpful to introduce a simple equilibrating
model relating fertility, mortality, wages, and population. Rent and
terms of trade could also be added, but they play an essentially passive
role and would only clutter the diagram.
The relation of fertility and mortality to wages, measured by their
crude rates band d, may be plotted as in the top half of figure 9.8. The
542 Ronald Demos Lee
Wage (w)
----d(w)
セ
:!l
Ui
c
Q
<0
:;
N·
a.
0
ll.
b(w)
w(N)
Fig. 9.8
Wage (w)
Economic-demographic equilibrium.
level and curvature of the birthrate curve are determined primarily by
norms and institutions, although at very low wages biological consider-
ations may become important. Some societies might have horizontal
fertility curves, if neither nuptiality nor marital fertility depended on
material well-being. Societies with institutional arrangements conducive
to high fertility, such as the extended family system, would have higher
birthrate curves than those with less pronatalist institutions, such as the
nuclear family. The death-rate curve is primarily biologically deter-
mined, although such additional factors as income distribution, central-
ized famine precautions, and in some cases infanticide and geronticide
are also important.
The population growth rate, equal to b - d, is given by the difference
between the two schedules; where they intersect, the growth rate is zero
and the population is stationary. The corresponding wage, w*, is vari-
ously known as the "long-run equilibrium wage," the "natural wage,"
the "conventional standard of living," or "subsistence."
The lower half of the diagram shows the relation between the wage
rate and the size of the population; it corresponds to the demand for
labor, which I assume is fixed. Corresponding to the equilibrium wage
is an equilibrium size of population, N*. There will also be equilibrium
levels of rent and terms of trade, which are not shown. Evidently the
543 Perspective on Economic Aspects of the Population Explosion
equilibrium is stable; when population size is below N* its growth rate
will be positive, and conversely.
Now consider the effect of a once-for-all shift in the demand for labor;
this situation is shown in figure 9.9. When w(N) shifts out to WI (N),
the wage will initially rise, inducing population growth until population
attains its new equilibrium at the old wage level. Thus, over the long
run, population responds passively to economic advance, while a roughly
constant level of material well-being is maintained; this is the "iron law
of wages."
Now consider the effect of a permanent exogenous decline in mortal-
ity, shifting the schedule from d (w) to d1 (w). This is shown in figure
9.10.15 The decline in mortality lowers the equilibrium wage and popu-
lation size; growth rates are initially positive until a new equilibrium
is established with lower fertility and wages and larger population size.
The point to note is that the equilibrium wage is not a culturally deter-
mined parameter, as the classical economists thought; it depends also
on a level of mortality that was subject to autonomous long-run change.
It is this that gives population an independent role in history: within
broad limits, the equilibrium population and living standard changed
when mortality changed, even if institutions and the economic base of
society remained completely unaltered.
<l>
;;;
a:
.<::
;;;
<l>
0
u
b(w)
c
'"
<l>
セ
d(w)
'E
to
<l>
U
::l
U
w· Wage (w)
wl(N)
w(N)
Fig. 9.9 Increased demand for labor.
Wage (w)
544 Ronald Demos Lee
b(w)
----d(w)
----d,(w)
Wage (w)
w(N)
I
I
I
I
セ i
セ I
Cf) I
6 I
セ Ni -------
セ N' ----------
a
a..
Wage (w)
Fig. 9.10 Exogenous mortality decline.
I have simplified here by ignoring the direct links of fertility to mor-
tality; these would cause the fertility curve to shift in response to shifts
in the mortality curve. However, such direct links were ver¥ weak (see
Lee 1973, p. 598; 1978a, p. 167). Therefore it was only through long-
run change in the norms and institutions themselves that society could
maintain constant population and wages in the face of exogenous change
in mortality. The automatic homeostatic mechanisms were not adequate
in these circumstances.
In earlier papers (Lee, 1973, 1978a, b) I used estimated forms of this
model to simulate the course of wages, population, and fertility, assum-
ing that only mortality varied exogenously. These simulations fit the
historical data remarkably well for 1250 to 1700 and 1705 to 1784.
The diagram can also be used to illustrate the effect of a steady rate
of shift of the demand for labor, of the sort included in the equations
estimated earlier. Suppose that this rate of shift is such that population
growth at rate r leaves wages unchanged; the estimates suggested r =
0.4% per year. Then in steady state growth, population will grow at
rate r, and the wage will be constant at a level such that b(w) - d(w)
= r. This situation is shown in figure 9.11. Evidently the wage will have
to be a bit above its "natural" level in order to induce growth. Exoge-
nous change in mortality will alter the steady-state wage but will only
temporarily affect the population's growth rate.
d(w)
b(w)
545 Perspective on Economic Aspects of the Population Explosion
Finally, consider a simultaneous decline in mortality and initiation of
growth at rate r in the demand for labor. This situation is shown in
figure 9.12. In this case we might observe constant fertility, low mortal-
ity, and population growth with no diminution in wages. This is the situ-
ation T. H. Marshall had in mind when he wrote of eighteenth-century
England (1965, p. 248) :
The obvious temptation is to assert that the death rate was not only
the variable, but also the determining, factor in the increase of popu-
lation, and that, to understand the causes of this increase, we should
study the deaths rather than the births. But, clearly, a horizontal line
on a graph may be as dynamic as a diagonal; the forces that prevent
a birth rate from falling may be as significant as those that make it
rise.
Ordinarily, one would expect a fall in the death rate to be followed by a
fall in fertility, as equilibrium is attained at a lower rate and larger
population; if this does not happen, it suggests that the underlying cause
of continuing population growth is economic progress, not the mortality
decline.
Might this be similar to the situation in today's LDCs? We often
observe exogenously declining mortality, relatively constant fertility and
per capita income, and rapid population growth. Without the concurrent
'"
10
a:
t;:Q)
z
セ
Vi
c
o
1i5
"3
0.
o
c-
al
c
::>
o
u
V>
6
Wage (w)
Fig. 9.11 Labor demand increasing at a constant rate.
546 Ronald Demos Lee
b(w)
セMMM、HキI
セMMMM、ャHwI
Wage(w)
,.Q)
Z
a)
N
Vi
C
o
';::;
m
:;
c-
o
c..
al
c
::>
o
u
'"
(5
Wage(w)
Fig. 9.12 Offsetting changes in growth of labor demand and mortality.
economic development, surely by now incomes and fertility would have
fallen and mortality risen. It is not quite right to attribute the population
growth to the mortality decline, although this may be the most conspicu-
ous exogenous change; growth in the capacities of these economies to
sustain population should perhaps be accorded the major responsibility.
A final comment on this model in relation to the LDCs is in order.
Whatever the nature of the social mechanisms that may have regulated
population in Asia, it is clear that a balance was reached at a much
higher level of fertility and mortality than in Europe. Apparently life
expectancy in China and India at the turn of this century was about 23
years (see Barclay et ai. 1976; Das Gupta 1971), versus perhaps 30
years in Europe; the total fertility rate must consequently have been
about 6.5 versus 4.5 in Europe. The necessary change in fertility-regu-
lating institutions, in response to declining mortality, is staggering.
9.5 Summary and Conclusions
For today's LDCs there is little empirical evidence on the economic
effects of population change. For the economy of preindustrial England
and perhaps Europe, on the other hand, population emerges clearly as
the dominant cause of long-run change in wages, rents, industrial prices,
and income distribution. The economy could absorb population growth
547 Perspective on Economic Aspects of the Population Explosion
at about 0.4% per year with little effect; deviations of population size
above or below this trend line, however, had dramatic consequences.
And perhaps more striking than the existence of these effects is the ex-
treme sensitivity of the economy's reaction: reckoning in terms of agri-
cultural goods, a 10% increase in population depressed wages by 22%;
raised rents by 19%; lowered industrial prices relative to agricultural
prices by 17%; raised the ratio of industrial to agricultural production
by 13%; and lowered labor's share of national income by 14%. This
sensitivity of response poses the principal puzzle to emerge from this
research. My attempt to account for these large (in absolute value)
elasticities by means of a very low elasticity of substitution of labor for
land is not altogether convincing without corroborating evidence.
In this study I looked for negative consequences of population growth,
and I found them. However, I made no effort to analyze such positive
effects as the stimulation of agricultural investment or of technical
change, the role of rising domestic demand for basic industrial com-
modities, or industrial wage rates held down by population growth and
sharply diminishing returns in agriculture.16
Nor can these possible posi-
tive effects be brushed aside as merely partially offsetting reactions to
dominant adverse effects; if they in any way brought on the industrial
revolution, then their net effect was overwhelmingly positive. But surely
the links of today's LDCs with the world economy greatly reduce the
advantages of scale, home demand, and home-produced technology.
Perhaps after all it is the centuries before the industrial revolution that
are most relevant for the LDCs, when population growth did have strong
and predictable effects, beneficial for some social classes and damaging
for others. In any event, a more balanced treatment of these issues
would require a second paper.
Now let me turn to the causes of population change. There is a notion
that social mechanisms cause population to grow and decline in response
to changes in productive capacity, in such a way as to keep incomes
close to a culturally defined standard of well-being. And some who
reject this model as descriptive of the present still believe it is appro-
priate for the past. In fact it is a poor description of both. In preindus-
trial Europe, as far back as records will take us, population swings were
largely autonomous, not a response to economic variation. Their active
determinant was mortality, which then as now experienced large exoge-
nous variation. Our current experience is not unique in this respect, and,
indeed, though the present decline in mortality has been much greater
and more sudden than those of the past, its effects on welfare have so
far been much less.
On the other hand, it would be a mistake to ignore the institutional
mechanisms of population control that existed in preindustrial times.
The point is not that they were absent, but that the equilibriums to
548 Ronald Demos Lee
which they steered society were largely accidental, resulting as they did
from the interaction of cultural control with independent mortality. And
while mortality largely determined the equilibrium and actual standard
of living, it was the social mechanisms that produced sustained popula-
tion growth in response to economic progress.
In short, the social protection of living standards through population
regulation has always been vulnerable to mortality change, and it would
be folly to expect longstanding demographic adjustment mechanisms to
prevent population growth from forcing material welfare below some
conventional standard in today's LDCs.
It is only in the very long run, over which the institutional mecha-
nisms are themselves variable, that such automaticity can be expected,
and the European experience suggests that even centuries may not suf-
fice.
Appendix 1. Data Used in Figure 9.1 and Section 9.2
A. Life Expectancy
For 1250-1450, estimates are based on J. C. Russell's (1958) life
tables that refer to the mortality experience of a predominantly upper-
class, geographically dispersed group of English males holding property
granted by the king. Some errors in the original tables were corrected;
the infant mortality rates in the tables were revised; and estimates were
converted from a cohort to a period basis. These estimates appear con-
sistent with scattered evidence for other social classes. For details on all
this, see Lee (1978b, appendix 4).
For 1550 to 1725, the estimates are based on Hollingsworth's study
of the British peerage (1964). These estimates refer to the mortality
of male peers. I have converted them from a cohort to a period basis.
Extensive comparisons suggest that these estimates accurately reflect
relative changes in the mortality of other social groups through 1725.
For details, see Lee (1978b, appendix 2). Between 1450 and 1550, life
expectancy estimates are not available.
B. Population Size
From 1250 to 1540, the dotted line indicates rough estimates of pop-
ulation size, based principally on Russell's work (1948); for details see
Lee (1978b, appendix 1).
The remaining population estimates for 1540 to 1800 are based on a
preliminary version of the Cambridge Group's aggregate parish register
549 Perspective on Economic Aspects of the Population Explosion
series. These series, generously made available to me by E. A. Wrigley
and Roger Schofield, give the annual number of baptisms and burials
for a nonrandom sample of 404 English parishes, covering about 6 or
7% of the total population. Various adjustments were made to correct
for gaps, underregistration, and the entry and departure of parishes to
and from the sample. Using a variety of methods, population size for the
sample was estimated to be roughly 230,000 at the beginning of the
period. Annual population estimates were formed by cumulating the dif-
ference between adjusted baptisms and burials, resulting in a population
size of 1,055,000 for 1840. This implies a 4.6-fold increase over the
three centuries, agreeing well with estimates from other sources. Esti-
mates for the sample were inflated to the national scale using a ratio
calculated for the end of the period when national population data are
available. These estimates are preliminary. Figure 9.1 shows population
size at five-year intervals, for 1540, 1545, ... , 1800.
C. Real Wage (w)
The numerator (W) of the real wage series is taken from Phelps-
Brown and Hopkins (1955), with some interpolation, for 1261 through
1700. It is the wage for building craftsmen. Thereafter, it is taken from
Deane and Cole (1969, p. 19) and represents a population-weighted
average of regions. A splicing ratio was derived from the overlap. The
figure for 1790-99 was again taken from Phelps-Brown and Hppkins
(1955). , 1
For 1261-1400, the deflator of the real wage series is the PHelgs-
Brown and Hopkins (1956) cost of a composite basket of consumables
including both agricultural and industrial commodities.
For 1401 to 1800, the deflator is an agricultural price index (PA ). It
is taken from Phelps-Brown and Hopkins (1957), through 1700. From
1701 to 1760 it is based on the Phelps-Brown and Hopkins grain index
as reported in A. H. John (1967, p. 191), using the overlap 1671-1700
to derive a splicing ratio. For 1761-1800, a wheat price index from
Deane and Cole (1969, p. 91), is used, with splicing ratio based on
1641-70.
D. Terms of Trade (PFlPA )
The denominator, PA , is exactly as described above in section C. The
numerator, PI, is taken from Phelps-Brown and Hopkins (1957) through
1700; thereafter the series is based on the average of the Schumpeter-
Gilboy producers' goods index and consumers' goods other-than-cereals
index, as reported in Deane and Cole (1969, p. 91). Because this aver-
age gives animal products a weight of 1/11, I assumed animal products
were similar to wheat and subtracted 1/1 1 of the wheat price series from
550 Ronald Demos Lee
it. The splicing ratio was calculated from the Gilboy-Schumpeter index
for 1680-1710, as reported in Mitchell and Deane (1962, p. 468). The
price ratio, P, was calculated as p = 100(PIiPA ).
E. RentlWage Ratio (Rlw)
The nominal rent index (RPA ) is taken from Kerridge (1953) and is
an average of the two series for the Herbert estates (with weight 114
each) and the Seymour estate (with weight 1/2). The ratio Rlw is cal-
culated as RPAIW times 100.
Appendix 2. Formal Development of the Two-Sector
Model
This appendix sets out the assumptions of the model explicitly and de-
velops a number of results that are used in the main body of the paper.
The development presented here owes much to Marc Nerlove, particu-
larly the material in section C. In what follows, agricultural output is
the numeraire.
A. Assumptions
(AI) A = !'-O(IL1F-(3 + (1 - ILl )N.{-Il) -l/ll.
Agricultural production follows a constant return to scale, constant
elasticity of substitution production function, with inputs of labor and
land-plus-other factors.
(A2)
Nonagricultural production follows a fixed-coefficients production
function with inputs of labor and agricultural output; units of mea-
sure for labor and agricultural output are chosen so that the produc-
tion coefficients are unity.
(A3) WI = W.l = W.
Wages are equal in the two sectors.
(A4) w = (jAlaN..l.
The wage in agriculture is competitively determined.
(AS)
The price of industrial output equals its cost of production.
(A6)
551 Perspective on Economic Aspects of the Population Explosion
There is full employment (or employment of a constant proportion
of the working-age population).
(A7) pI = '(A -I) or, equivalently, (A -1)/
(A -I+pl) = 1/(1 +').
The demand for nonagricultural output is such that net agricultural
output is a constant proportion of total net output, valued at current
prices.
B. Derivation of the Sectoral Allocation of Labor
Let YA be labor's proportional share of agricultural product; by (A4)
this equals EA,NA X NA can be expressed as:
(A8)
From equation A2 it follows that I = NI, and combining this with
equation A7 and solving for N] yields:
(A9) N] = AA/(p + ').
From equations A8, A9, and A6 it follows that:
(AIO) NA/N = YA/[YA + ,w/(p +,)],
which gives agricultural employment as a proportion of the total labor
force.
C. The Effect of Population Growth on the Sectoral
Allocation of Labor
The goal here is to derive an explicit expression for the elasticity of
N A with respect to N, From equations A6 and A9 it follows that:
(All) NA=N-AA/(p+,).
(AI2)
(A13)
Differentiating with respect to N gives:
oNA _ 1 _ oNA IoA/oNA _ Aow/oNA1
oN - , oN p+, (p+,)2 .
Solving equation A 12 for oNA/oN yields:
oNA = 1/ 11 + ,oA/oNA _ AAow/oNA 1.
oN p +, (p +,)2 
From equation A9:
(A14) A!(p +,) = NI!A.
Substituting in equation A13 yields:
(A1S)
(A17)
552 Ronald Demos Lee
oNA = II 11 + N/oAloNA _ N/owloN,1 ) .
oN A p + It 
Multiplying by NINA on both sides yields:
(A16) E = II セ N A NAN/oAloNA _ NAN/owloNA)
NA,N ( N + AN N(p + It) 
This can be rewritten:
 N] N] w)
EN.4 .N = II {1 - (1 - 1'.1) N - N Ew,NA (p + It) 
Equation A17 relates two unknown and unobservable elasticities, eセa .N
and Ew,NA
• Fortunately these same two elasticities are also related by the
.
identity:
(A18)
(A20)
where Ew,N is directly estimable. Substituting from equation A18 into
equation A17 yields:
(A19) l N[ EIt',N N] w l
EN N=11 1-(1-1'.1)------- .
A' N ENA ,NN P + It
Solving for ENA ,N yields:
 N/ w i
ENA ,N = ( 1 + Ew,N N (p + It)  I
II-(l - 1'.1) セ I·
This last equation permits estimation of ENA ,N from estimable quantities.
And it is also true, of course, that:
(A2l)
D. Estimation of EW,NA
and the Elasticity of Substitution in Agriculture
Once we have derived the effect of population change on the sectoral
allocation of labor, ENA .N, it is simple to find ElV ' NA and (T = I/O + (3).
In fact, Ew,N.1 can be calculated directly from equations A20 and A 18.
Since the elasticity of substitution equals - (1 - 1'.1) / E" ..,A. ' it is also
true that:
(A22)
Substituting from equation A20, this gives:
553
(A23)
or
(A24)
Perspective on Economic Aspects of the Population Explosion
E. Rent and Population
From equations Al and A4 it follows that:
(A25)
This could be estimated in log-linear form, except that NA is not directly
observed. However if E Rlw.N is estimated, then ERlw,NA = 1 + f3 = I/O'
can be calculated as:
(A26)
or
(A27)
F. The Effect of Population on the Ratio of Industrial to
Agricultural Output in Real Terms
Solving equation A7 for I, and dividing by A, gives:
(A28) I/A = AI(>.. + p).
Calculation of the elasticity of 1/A with respect to N yields:
(A29) ElIA,N = -WEw,N/(P + >..).
Inspection shows that this is a positive number; population growth in-
creases industrial output more, proportionately, than agricultural output.
In fact, since I = Nj, and N[ = N - N.t, the elasticity of I with respect
to N is easily shown to be:
(A30)
Thus, to a first approximation, industrial output increases in proportion
to population; more accurately, it increases more than proportionately
when EN{ ,N is less than one.
554 Ronald Demos Lee
G. Population and Terms of Trade
Since p = 1 + w, it is easily shown that:
(A31 )
where 'Y1 is w/ (1 + w), the share of labor in the cost of industrial pro-
duction.
H. Population and Income Distribution
In the model, all income accrues either to labor or to "land" (which
includes all agricultural nonlabor inputs). Labor's share of output in
proportionate terms, denoted S, is therefore:
(A32) S = wN/(wN +R) = 1/[1 + R/(wN)].
Dividing numerator and denominator of R/(wN) by A gives (I - 'YA) /
('YAN/NA), so equation A32 can be rewritten:
(A33)
so that labor's share in all output is greater than it share in agricultural
output.
Equation A33 can also be used to calculate 'YA, which is unobserved,
from Sand N A/N, for which estimates exist. Solving for 'YA yields:
(A34) 'YA = (SNA/N)/O - SNIiN).
The elasticity of labor's proportionate share with respect to popula-
tion size can be calculated from equation A32 as follows:
(A35) oS N
oNS-
-([()(R/w)/oN](l/N) + [o(l/N)/oN](R/w)}N .
[1 +R/(wN)]2{1/[1 +R/(wN)']}
This simplifies to:
(A36) ES•N = -{o(R/w)/oN - R/(wN)}
/[1 + R/ (wN)],
which further simplifies to:
(A37) ES,N = (1 - ER/w,N) (I - S),
which is easily evaluated.
1. Nonagricultural Technical Change, Wages, and Labor Force
Allocation
Suppose equation A2 is altered to: I = min (NIia,A1 ), so that al
= N1 and p = aw + 1. Then equation All becomes:
(A39)
555 Perspective on Economic Aspects of the Population Explosion
(A38) NA = N - aM/Caw + 1 +').
This can be differentiated to find the effect of a change in a on labor
force allocation, for constant N.
oNA -, oA oNA
oa (p+,)2 {(A + oNA OW a)(p+,)
(w+ OW oNA ) A}
a oNA oa a .
After solving for oN.doa and simplifying:
(A40)
(A4l)
1 + 'aw _ ,a2A ow/oNA '
p + , (p + ,)2
Further simplifying, and expressing as an elasticity, this gives:
EN.4 .C< = -1/{pNA/NI - [aw/(l + ,)]EW •NA )-
It is also easily shown that ENI.c< = -(NA /NI)EN.4 .c< so that:
(A42)
And, finally, the effect of changes in a On ware easily assessed, since:
(A43)
Notes
I. He has shown that in a stable population with growth rate r, whose economy
has a rate of disembodied technological progress s, and in which savings are less
than or equal to profits, the internal rate of return to a marginal birth, viewed as
an investment, is less than or equal to r +s. If r is 0.02 and s is 0.01, then dis-
counting over a life cycle at a rate above 3% yields a negative present value of a
birth.
2. This may in part reflect their methodology. In a single-sector neoclassical
growth model, rates of population growth have no effect on steady-state growth
rates. Weak negative effects arise in transitional disequilibriums, and strong effects
occur in nonneoclassical economies with surplus labor. It might be worth redoing
the analysis while distinguishing among these three categories.
3. See, for example, Van Bath (1963); North and Thomas (1973); and Phelps-
Brown and Hopkins (1959). Properly put, the argument is that population change
accounted for changes in relative prices over the period; some historians, however,
go too far and suggest that population growth caused the general 'price inflation
of the sixteenth century. For a perceptive review see McCloskey (1972). In a
recent paper, Cohen and Weitzman (1975) have suggested that the process of
enclosure might also explain these changes; however, they have drastically under-
estimated the strength of the demographic data.
556 Ronald Demos Lee
4. For the regression covering the years 1250 to 1700, the Phelps-Brown and
Hopkins (1956) real wage series was used, which is money wages deflated by the
price of a basket of goods including both agricultural and industrial items. The
wage series used for 1705-89 was deflated in a similar manner; it is based on data
given in Deane and Cole (1969, p. 19) and takes account of regional differences
in wages and population growth rates.
5. In any case, if the economy is viewed as open, then relative prices are deter-
mined in large measure exogenously. But until midway through the eighteenth
century, Europe accounted for most of England's trade (see Deane and Cole 1969,
p. 34), and changes in European factor supplies and factor prices paralleled those
in England (see e.g. Phelps-Brown and Hopkins 1959).
6. This view of the English economy, which emphasizes land and labor to the
total exclusion of capital, receives some support from estimates of the capital stock
in the late seventeenth century. From Gregory King's tabulations, Deane and Cole
(1969, p. 270) estimate that 64% of capital was in land, 8% in livestock, 17.5%
in buildings, and only 10.5% in transportation, inventories, machines, and the
military. The saving rate was 3 to 6%, and savings went to a considerable extent
into agriculture.
By 1698, the "industrial" category had risen to about 21%, while land had fallen
to 55%; but the economy's capital was still largely agricultural (Deane and Cole
1969, p. 271).
7. In 1798, roughly 12% to 16% of the population were "living-in" employees;
of these, domestic servants were the largest group. See Mathias (1969, p. 25). In
1801, according to Colquhoun, about 7.5% of the population were personal and
household servants.
8. According to Deane and Cole (1969, p. 154-64) the proportional share of
agriculture in national income was 40-45% in 1688 and in 1770; by 1801 it had
declined to about 32-36%. Pollard and Crossley (1968), put the 1688 figure at
56%, which if correct would change the picture considerably.
9. Mean values are needed for the variables N/N, I'A' Ew,N and w/(p + )1,),
all of which are actually endogenous. Based on Gregory King, Deane and Cole
(1969, p. 137) estimate that 60 to 80% of the labor force was primarily engaged
in agriculture in 1688. Since many of those primarily engaged in agriculture none-
theless did nonagricultural work as by-employment or for their own consumption,
I will take 65% as the proportion of labor services engaged in agriculture: so
N[IN = .35.
An estimate of I'A can be derived from an estimate of S, labor's share of total
national income, using equation A34. For 1688 Deane and Cole, based on Gregory
King, estimate that between 25% and 39% of national income was wages and
salaries. However, not included is the labor contribution of farmers and freehold-
ers, whose income accounts for about 40% of national income. I will somewhat
arbitrarily take S =.55, which implies that I'A =.45. Ew .N has been estimated to
be -2.22 in equation 20; w/(p +)1,) should be estimated for the mean amount
of labor augmentation. Taking )I, =I (i.e., 50% of final product is in agriculture),
and w =3, gives w/(p + )1,) =.6.
10. In transformed terms, w =3 and p =w+I =4. Since agricultural prices
are by definition I, the quantity of J consumed must be 114 as large as that of A.
Thus w* =wl[e + (eI4)p] =(4Ie)[w/(w + 5)]. From this, EK,N =[5/(5 + w)]
Eu;.N =(5/8)Ew ,N evaluated at w =3.
I I. See Lee (1971) for a comparison of this series with others for Colyton, a
small rural parish, and for "professional men" in England.
557 Perspective on Economic Aspects of the Population Explosion
12. The theoretical cross spectrum is ideally suited to analyze the interactions
of two series that are related to one another approximately linearly with known
sets of lagged coefficients. as is the case with demographic series.
13. The variables are measured as residuals from the regression of the log of
the basic series on time.
14. Many dozens of previous studies of populations, in many social contexts and
time periods, have demonstrated this sort of procyclical response, including situa-
tions in which the cross-sectional and secular relationship of fertility to income
appears to be negative. Therefore this cross-spectral evidence is weak support at
best for the existence of a long-run positive aggregate relation of fertility and
income.
15. For diagrammatic simplicity. I have assumed that fertility is completely
independent of mortality. so that hew) remains unchanged. The results are not
qualitatively different so long as compensation is less than perfect.
16. These positive effects of population growth have been stressed by Boserup
(1965) and others and have been modeled and simulated in a recent article by
Simon (1976).
Comment Nathan Keyfitz
Is population growth the cause or the result of economic change? Ron-
ald Lee tackles nothing smaller than this central problem of demography.
The answer he provides is limited in space and time, but his analysis is
nonetheless a tour de force combining economic time series, parish
records, and simple models.
Everyone wants to endogenize population in his economic model, but
there are doubts whether the real world is made in a way that permits
this. Adam Smith seemed to do it: for him the production of people
responded to the demand, just like the supply of shoes. For Malthus the
number of people the landscape could support was limited just like the
number of animals that could be sustained on a given food supply.
Though they did not use the expression, Smith and Malthus in their dif-
ferent ways both saw a negative feedback by which the family received
signals either from the larger society or from the environment, and so
family behavior could never be destabilizing.
Neither view is wholly inapplicable-places and times can be found
to illustrate both. So can places and times be found in which they do not
apply. The Kung Bushmen, with densities of about one person per two
square miles, do not seem to produce people up to either the economic
or the biological limit. They avoid any sense of population pressure,
keeping their numbers below the physiological maximum-by what
means and under what motivation no one seems to know.
Nathan Keyfitz is professor of sociology at Harvard University.
558 Ronald Demos Lee
Thus population in some places goes up either with capital (Smith)
or with land (Malthus); among the Kung and elsewhere it stays well
below the limits set by either. To make matters more difficult, the dom-
inant tendency in most industrial societies has been for the birthrate to
go down with the increase of income, a social mobility effect that over-
comes the Smith and Malthus effects. The would-be endogenizer does
not even know whether to insert in his model a positive, zero, or negative
relation of population to income, let alone how strong to make that
relation.
Lee's empirical finding that in preindustrial Europe income does not
affect population accords with the theoretical ambiguity. However, in
the other direction there does appear to be clear causation both theo-
retically and empirically. The result that when population rose by 10%,
as it could easily do in a period of low mortality, wages went down by
15%, is surprising and important. The two-sector model is simple and
convincing. My only wish is that he could reassure us more about the
quality of the wage and other data to which it was fitted.
What is implicit in Lee's paper, as in other work, is two systems: the
small system of the family and the large system of the population,
whether it be parish, county, nation, or world. Each of the two systems
has its own laws and variables, and the two sets of variables mesh differ-
ently in different circumstances. This paper tells us something important
about both the small and the large systems as well as about the relation
between them in preindustrial England.
It considers Smith's device for linking the two through the birthrate:
with more capital and hence more jobs, young people will be able to
marry earlier and so will have children sooner. Lee shows that the num-
ber of children within marriage did vary with jobs, a feature Smith did
not recognize. But this and marriage seem to have been less important
than the exogenously caused fluctuations in the death rates whose action
is the main feature of the paper.
Lee mentions at the beginning of his paper the belief that in modern
times the old regulatory mechanisms have broken down under the influ-
ences of mortality decline, urbanization, technical change, and modern-
ization in general. He speaks of the finite world of preindustrial England
with limits not yet rendered flexible by technology, and of how ancient
regulatory mechanisms fail to operate in the twentieth century. But then
at the end of the paper he transfers his major result from preindustrial
England to the present LDCs. I am more convinced by his initial reser-
vation than by his later transfer. For various reasons it seems unlikely
that the currently developing countries will duplicate Europe's early
experience.
The most conspicuous difference is in the rapid urbanization of the
LDCs. In past centuries when remnants of feudal class respect were
559 Perspective on Economic Aspects of the Population Explosion
still controlling, communication was slow, and most of the population
worked on the land, fluctuations of income were accepted even when
they brought part of the population below the starvation line. In the
1970s, with huge migration to the cities-Cairo, Calcutta, Mexico City
each have as many people as the whole of England and ten times as
many as London-surplus population has a social and political visibil-
ity that daily reminds the elite of the importance of birth control. Each
day's newspapers tell us about a turnaround or accentuation of birth-
control policy in one or another country, conspicuously in certain coun-
tries where urbanization is most rapid.
But this does not say anything about the smaller system-it refers
only to the policy of the larger society. Does the turnaround that is
occurring in elite views tell us what will happen within the smaller
system of the family? How can the elite control the family-building
practices of their masses? Certainly they cannot do so directly or imme-
diately. By the 1990s we should have a clear idea of the manner and
degree in which currently visible economic and political forces of the
larger society will penetrate the family. Sooner or later they will; it is
the timing that is important. How much will the current fall in mortality
and rapid population growth affect wages in the LDCs? One has trouble
seeing how such a question can be answered by analysis of the forces
operating in preindustrial England.
But this doubt about generalizing to the late twentieth century in no
way lessens my admiration of Lee's historical work. His choice of models
is judicious, and the method will be exemplary for others who use time
series and parish registers to answer real questions.
Comment Marc Nerlove
In 1973 Lee published a paper entitled "Population in Preindustrial
England: An Econometric Analysis," based on his 1971 dissertation.1
In that paper Lee presented a model relating crude birthrates and death
rates, population size, and the real wage rate that is the same in all
essentials as that underlying figures 9.7, 9.8, 9.9 and 9.10 in the present
paper. In the model of economic demographic equilibrium, real wages
and population sizes are inversely related, whereas fertility, as measured
by the crude birthrate, is positively related and mortality, as measured
by the crude death rate, is' negatively related to real wages. Population
size is simply connected with the crude birthrate and death rate by the
identity
Marc Nerlove is associated with Northwestern University.
560 Ronald Demos Lee
(1) dP
d/P=b-d,
where P is population size and band d are the crude birthrate and death
rate, respectively.
Lee estimated the basic relationships of his model using fifty-year
averages of population size (aggregate data from Wrigley and Russell),
a wage index (from Phelps-Brown and Hopkins) deflated by an index
of prices for both agricultural and nonagricultural commodities, and life
expectancies at birth for the peerage (from Russell and Hollingsworth).
Assuming a stable population, Lee was able to derive estimates of the
crude birthrate and death rate from the growth of population over time.
The basic equations of the model-real wages as a function of popula-
tion size, and crude birthrate and death rate as functions of the real
wage rate-were estimated for the period 1250-1700 using both ordi-
nary least squares and two-stage least squares, assuming mortality to be
exogenous.2
Indeed, the simple correlation between mortality and the
real wage turns out to be positive in this period, a result that can be
attributed almost entirely to the simultaneity of the system Lee con-
siders. It is also possible to estimate many of the basic parameters of the
system without using the wage data at all, or without using the popula-
tion or fertility data but only the crude death rates related to the life-
expectancy data, by exploiting the overidentification of Lee's system.
These estimates provide tests of the overidentification of the system and
its consistency with the data, unreliable as these may be.
On the basis of his 1973 analysis, Lee concluded that "long-run
changes in the real wage are adequately accounted for by changes in
population size" and that "there were no dramatic shifts in the demand
for labor over this period.... The relationship between population and
the real wage was stable until the beginning of the eighteenth century, at
which time it began to change markedly.... The great swings in popu-
lation during this period were due to swings in mortality." These latter
were largely exogenous according to Lee (1973, pp. 604-5). Lee found
a "highly variable equilibrium wage in conjunction with a relatively
constant demand for labor" (1973, p. 606).
It is worth stressing two aspects of Lee's earlier paper in conjunction
with the one presented at this conference. First, "The end point, 1700
[of the period analyzed], was chosen because the relation between wages
and population size began to shift unmistakably after this, and because
the mortality of the aristocracy, from which we have derived our esti-
mates, was no longer representative of that of the general population"
(Lee 1973, p. 583). Second, the interpretation of the wage-population
relationship, in terms of a one-sector model with a Cobb-Douglas pro-
duction function, is a key element in assessing the adequacy of this
561 Perspective on Economic Aspects of the Population Explosion
central relationship of the economic-demographic model. Lee's difficul-
ties in this connection have led to an extensive investigation, in the
present paper, of a two-sector model with a CES production function
for agriculture and fixed-coefficients technology for the nonagricultural
sector. This two-sector model was discussed in detail at the conference
in an appendix to these comments. That material, however, has been
largely incorporated in Lee's Appendix 2 and is therefore omitted here.
The paper under discussion contains four important innovations:
1. Lee utilizes greatly superior population data derived from the
sample of 404 parish registers collected by the Cambridge Group for
the History of Population and Social Structure, spanning the period
1538-1840. For some analyses Lee has used decadal averages, for
others the annual data themselves, and the latter are clearly essential to
the cross-spectral statistical analyses he carries out in section 9.3.2.
2. This paper focuses on a later period, 1530-1800 (sometimes
1839) for which the clearly superior data are available. Use of better
data is certainly desirable, but, especially in view of Lee's earlier cau-
tionary statement concerning the noncomparability of the period after
1700 with the period before, combining data for the period after indus-
trialization had clearly gotten under way with prior data may raise some
serious questions about the stability of the relationships estimated. To
some degree Lee tries to handle this problem in his regression (eq. 3),
but he succeeds only in capturing an acceleration of the trend in real
wages after 1809 and does not detect a significant shift in the two sub-
periods 1639-1745 and 1746-1839. However, this analysis should be
reworked using real wage data more appropriate to the two-sector model
(deflating money wages by agricultural prices alone rather than"an index
of both agricultural and industrial prices). The regression result reported
in equation 20 uses data from 1540 only to 1800 and omits a variable
designed to detect acceleration of the trend in the demand for labor
after the Napoleonic wars and is thus not so directly comparable.
Using the older set of data, Lee reports a significant shift of the wage-
population relation between 1250-1700 and 1705-89 in the form of a
fivefold increase in the rate of exponential trend.
3. A central, and most attractive, feature of the present paper is its
attempt to interpret the real wage-population relation within the frame-
work of a two-sector model that assumes CES technology in the agricul-
tural sector and fixed coefficients in the nonagricultural sector. Despite
several limitations, this new model allows a much richer set of tests for
consistency of the relationship between real wages and population im-
portant in Lee's later analysis of economic-demographic interactions.
The two-sector model and its implications are described in detail in
Appendix 2 to Lee's paper.
A Historical Perspective On Economic Aspects Of The Population Explosion  The Case Of Preindustrial England

More Related Content

Similar to A Historical Perspective On Economic Aspects Of The Population Explosion The Case Of Preindustrial England

Humanities Graduates and the British Economy - University of Oxford
Humanities Graduates and the British Economy - University of OxfordHumanities Graduates and the British Economy - University of Oxford
Humanities Graduates and the British Economy - University of OxfordZoe Burgess
 
Longer run economic consequence of pandemic
Longer run economic consequence of pandemicLonger run economic consequence of pandemic
Longer run economic consequence of pandemicRein Mahatma
 
Population growth decelerating faster than expected; potential consequences f...
Population growth decelerating faster than expected; potential consequences f...Population growth decelerating faster than expected; potential consequences f...
Population growth decelerating faster than expected; potential consequences f...Lewis Larsen
 
Technology and economic growth
Technology and economic growthTechnology and economic growth
Technology and economic growthalexa_vani
 
Technology and economic growth
Technology and economic growthTechnology and economic growth
Technology and economic growthalexa_vani
 
Crises etanol economia
Crises etanol economiaCrises etanol economia
Crises etanol economiaEduardo Garcia
 
energy use, demographics & environment (López-Lemus, 1997)
energy use, demographics & environment (López-Lemus, 1997)energy use, demographics & environment (López-Lemus, 1997)
energy use, demographics & environment (López-Lemus, 1997)Luis Gerardo López Lemus
 
How has Income Inequality and Wage Disparity Between Native and Foreign Sub-p...
How has Income Inequality and Wage Disparity Between Native and Foreign Sub-p...How has Income Inequality and Wage Disparity Between Native and Foreign Sub-p...
How has Income Inequality and Wage Disparity Between Native and Foreign Sub-p...Dinal Shah
 
The future ageing of the ethnic minority population of England and Wales
The future ageing of the ethnic minority population of England and WalesThe future ageing of the ethnic minority population of England and Wales
The future ageing of the ethnic minority population of England and WalesThink Ethnic
 
Urbanization & functionalist view...
Urbanization & functionalist view...Urbanization & functionalist view...
Urbanization & functionalist view...HuXaifa Qureshi
 
Project Proposal WBS and Project ScheduleOverviewIn the assi.docx
Project Proposal WBS and Project ScheduleOverviewIn the assi.docxProject Proposal WBS and Project ScheduleOverviewIn the assi.docx
Project Proposal WBS and Project ScheduleOverviewIn the assi.docxsimonlbentley59018
 
Econmoic growth studies
Econmoic growth studiesEconmoic growth studies
Econmoic growth studiesSaadullah Khan
 
Bhattarai_Econmodelling_UN1-s2.0-S0264999316301298-main
Bhattarai_Econmodelling_UN1-s2.0-S0264999316301298-mainBhattarai_Econmodelling_UN1-s2.0-S0264999316301298-main
Bhattarai_Econmodelling_UN1-s2.0-S0264999316301298-mainKeshab Bhattarai
 
An Empirical And Theoretical Literature Review On Endogenous Growth In Latin ...
An Empirical And Theoretical Literature Review On Endogenous Growth In Latin ...An Empirical And Theoretical Literature Review On Endogenous Growth In Latin ...
An Empirical And Theoretical Literature Review On Endogenous Growth In Latin ...Wendy Hager
 
Growth in margin of ecological thought by perez
Growth in margin of ecological thought by perezGrowth in margin of ecological thought by perez
Growth in margin of ecological thought by perezLucie Evers
 
The Economics of Biofuels A New Industrial Revolutuion
The Economics of Biofuels A New Industrial Revolutuion  The Economics of Biofuels A New Industrial Revolutuion
The Economics of Biofuels A New Industrial Revolutuion QZ1
 

Similar to A Historical Perspective On Economic Aspects Of The Population Explosion The Case Of Preindustrial England (20)

Humanities Graduates and the British Economy - University of Oxford
Humanities Graduates and the British Economy - University of OxfordHumanities Graduates and the British Economy - University of Oxford
Humanities Graduates and the British Economy - University of Oxford
 
Economic roots (1)
Economic roots (1)Economic roots (1)
Economic roots (1)
 
Longer run economic consequence of pandemic
Longer run economic consequence of pandemicLonger run economic consequence of pandemic
Longer run economic consequence of pandemic
 
Population growth decelerating faster than expected; potential consequences f...
Population growth decelerating faster than expected; potential consequences f...Population growth decelerating faster than expected; potential consequences f...
Population growth decelerating faster than expected; potential consequences f...
 
Why a city growt
Why a city growtWhy a city growt
Why a city growt
 
Technology and economic growth
Technology and economic growthTechnology and economic growth
Technology and economic growth
 
Technology and economic growth
Technology and economic growthTechnology and economic growth
Technology and economic growth
 
Crises etanol economia
Crises etanol economiaCrises etanol economia
Crises etanol economia
 
EKC
EKCEKC
EKC
 
Gentrification_Chicago
Gentrification_ChicagoGentrification_Chicago
Gentrification_Chicago
 
energy use, demographics & environment (López-Lemus, 1997)
energy use, demographics & environment (López-Lemus, 1997)energy use, demographics & environment (López-Lemus, 1997)
energy use, demographics & environment (López-Lemus, 1997)
 
How has Income Inequality and Wage Disparity Between Native and Foreign Sub-p...
How has Income Inequality and Wage Disparity Between Native and Foreign Sub-p...How has Income Inequality and Wage Disparity Between Native and Foreign Sub-p...
How has Income Inequality and Wage Disparity Between Native and Foreign Sub-p...
 
The future ageing of the ethnic minority population of England and Wales
The future ageing of the ethnic minority population of England and WalesThe future ageing of the ethnic minority population of England and Wales
The future ageing of the ethnic minority population of England and Wales
 
Urbanization & functionalist view...
Urbanization & functionalist view...Urbanization & functionalist view...
Urbanization & functionalist view...
 
Project Proposal WBS and Project ScheduleOverviewIn the assi.docx
Project Proposal WBS and Project ScheduleOverviewIn the assi.docxProject Proposal WBS and Project ScheduleOverviewIn the assi.docx
Project Proposal WBS and Project ScheduleOverviewIn the assi.docx
 
Econmoic growth studies
Econmoic growth studiesEconmoic growth studies
Econmoic growth studies
 
Bhattarai_Econmodelling_UN1-s2.0-S0264999316301298-main
Bhattarai_Econmodelling_UN1-s2.0-S0264999316301298-mainBhattarai_Econmodelling_UN1-s2.0-S0264999316301298-main
Bhattarai_Econmodelling_UN1-s2.0-S0264999316301298-main
 
An Empirical And Theoretical Literature Review On Endogenous Growth In Latin ...
An Empirical And Theoretical Literature Review On Endogenous Growth In Latin ...An Empirical And Theoretical Literature Review On Endogenous Growth In Latin ...
An Empirical And Theoretical Literature Review On Endogenous Growth In Latin ...
 
Growth in margin of ecological thought by perez
Growth in margin of ecological thought by perezGrowth in margin of ecological thought by perez
Growth in margin of ecological thought by perez
 
The Economics of Biofuels A New Industrial Revolutuion
The Economics of Biofuels A New Industrial Revolutuion  The Economics of Biofuels A New Industrial Revolutuion
The Economics of Biofuels A New Industrial Revolutuion
 

More from Finni Rice

Against Gun Control Essay. Persuasive essay on anti gun control - mfacourses8...
Against Gun Control Essay. Persuasive essay on anti gun control - mfacourses8...Against Gun Control Essay. Persuasive essay on anti gun control - mfacourses8...
Against Gun Control Essay. Persuasive essay on anti gun control - mfacourses8...Finni Rice
 
Essay On Assessment For Learning. PDF Reflective Essay on Assessment
Essay On Assessment For Learning. PDF Reflective Essay on AssessmentEssay On Assessment For Learning. PDF Reflective Essay on Assessment
Essay On Assessment For Learning. PDF Reflective Essay on AssessmentFinni Rice
 
Essay Outline Online. Outline example essay. Argumentative Essay Outline Wit...
Essay Outline Online.  Outline example essay. Argumentative Essay Outline Wit...Essay Outline Online.  Outline example essay. Argumentative Essay Outline Wit...
Essay Outline Online. Outline example essay. Argumentative Essay Outline Wit...Finni Rice
 
Maslow Hierarchy Of Needs Essay. MaslowsHierarchyOfNeeds Maslows hierarchy o...
Maslow Hierarchy Of Needs Essay. MaslowsHierarchyOfNeeds  Maslows hierarchy o...Maslow Hierarchy Of Needs Essay. MaslowsHierarchyOfNeeds  Maslows hierarchy o...
Maslow Hierarchy Of Needs Essay. MaslowsHierarchyOfNeeds Maslows hierarchy o...Finni Rice
 
Homeschooling Essay. Pros And Cons Of Homeschooling
Homeschooling Essay. Pros And Cons Of HomeschoolingHomeschooling Essay. Pros And Cons Of Homeschooling
Homeschooling Essay. Pros And Cons Of HomeschoolingFinni Rice
 
Pay For Someone To Write A Pape. Online assignment writing service.
Pay For Someone To Write A Pape. Online assignment writing service.Pay For Someone To Write A Pape. Online assignment writing service.
Pay For Someone To Write A Pape. Online assignment writing service.Finni Rice
 
2023-24 University Of Maryland Supplemental Es
2023-24 University Of Maryland Supplemental Es2023-24 University Of Maryland Supplemental Es
2023-24 University Of Maryland Supplemental EsFinni Rice
 
Recommendation Letter Meaning In Marathi Wallp
Recommendation Letter Meaning In Marathi WallpRecommendation Letter Meaning In Marathi Wallp
Recommendation Letter Meaning In Marathi WallpFinni Rice
 
Cheap Term Paper Help Cheap Term Papers Info,
Cheap Term Paper Help Cheap Term Papers Info,Cheap Term Paper Help Cheap Term Papers Info,
Cheap Term Paper Help Cheap Term Papers Info,Finni Rice
 
Pin By Augustus Bessah On English Teacher Essay Wri
Pin By Augustus Bessah On English Teacher Essay WriPin By Augustus Bessah On English Teacher Essay Wri
Pin By Augustus Bessah On English Teacher Essay WriFinni Rice
 
How To Write An Argumentative Essay - Ch
How To Write An Argumentative Essay - ChHow To Write An Argumentative Essay - Ch
How To Write An Argumentative Essay - ChFinni Rice
 
Lined Handwriting Paper Printable. Online assignment writing service.
Lined Handwriting Paper Printable. Online assignment writing service.Lined Handwriting Paper Printable. Online assignment writing service.
Lined Handwriting Paper Printable. Online assignment writing service.Finni Rice
 
Check Out Our Personal Stateme. Online assignment writing service.
Check Out Our Personal Stateme. Online assignment writing service.Check Out Our Personal Stateme. Online assignment writing service.
Check Out Our Personal Stateme. Online assignment writing service.Finni Rice
 
Academic Writing Companies. TOP. Online assignment writing service.
Academic Writing Companies. TOP. Online assignment writing service.Academic Writing Companies. TOP. Online assignment writing service.
Academic Writing Companies. TOP. Online assignment writing service.Finni Rice
 
The Journey, Creative Writing - GCSE English - Marked B
The Journey, Creative Writing - GCSE English - Marked BThe Journey, Creative Writing - GCSE English - Marked B
The Journey, Creative Writing - GCSE English - Marked BFinni Rice
 
Writing Workshop Anchor Charts - Distance Learnin
Writing Workshop Anchor Charts - Distance LearninWriting Workshop Anchor Charts - Distance Learnin
Writing Workshop Anchor Charts - Distance LearninFinni Rice
 
Back To School Writing Pages - My Teaching Libra
Back To School Writing Pages - My Teaching LibraBack To School Writing Pages - My Teaching Libra
Back To School Writing Pages - My Teaching LibraFinni Rice
 
Problem Of Global Warming Argument. Online assignment writing service.
Problem Of Global Warming Argument. Online assignment writing service.Problem Of Global Warming Argument. Online assignment writing service.
Problem Of Global Warming Argument. Online assignment writing service.Finni Rice
 
Plain Premium Writing Paper Packs Envelopes
Plain Premium Writing Paper Packs EnvelopesPlain Premium Writing Paper Packs Envelopes
Plain Premium Writing Paper Packs EnvelopesFinni Rice
 
Essay Plan Essay Plan, Study Notes, College Esse
Essay Plan Essay Plan, Study Notes, College EsseEssay Plan Essay Plan, Study Notes, College Esse
Essay Plan Essay Plan, Study Notes, College EsseFinni Rice
 

More from Finni Rice (20)

Against Gun Control Essay. Persuasive essay on anti gun control - mfacourses8...
Against Gun Control Essay. Persuasive essay on anti gun control - mfacourses8...Against Gun Control Essay. Persuasive essay on anti gun control - mfacourses8...
Against Gun Control Essay. Persuasive essay on anti gun control - mfacourses8...
 
Essay On Assessment For Learning. PDF Reflective Essay on Assessment
Essay On Assessment For Learning. PDF Reflective Essay on AssessmentEssay On Assessment For Learning. PDF Reflective Essay on Assessment
Essay On Assessment For Learning. PDF Reflective Essay on Assessment
 
Essay Outline Online. Outline example essay. Argumentative Essay Outline Wit...
Essay Outline Online.  Outline example essay. Argumentative Essay Outline Wit...Essay Outline Online.  Outline example essay. Argumentative Essay Outline Wit...
Essay Outline Online. Outline example essay. Argumentative Essay Outline Wit...
 
Maslow Hierarchy Of Needs Essay. MaslowsHierarchyOfNeeds Maslows hierarchy o...
Maslow Hierarchy Of Needs Essay. MaslowsHierarchyOfNeeds  Maslows hierarchy o...Maslow Hierarchy Of Needs Essay. MaslowsHierarchyOfNeeds  Maslows hierarchy o...
Maslow Hierarchy Of Needs Essay. MaslowsHierarchyOfNeeds Maslows hierarchy o...
 
Homeschooling Essay. Pros And Cons Of Homeschooling
Homeschooling Essay. Pros And Cons Of HomeschoolingHomeschooling Essay. Pros And Cons Of Homeschooling
Homeschooling Essay. Pros And Cons Of Homeschooling
 
Pay For Someone To Write A Pape. Online assignment writing service.
Pay For Someone To Write A Pape. Online assignment writing service.Pay For Someone To Write A Pape. Online assignment writing service.
Pay For Someone To Write A Pape. Online assignment writing service.
 
2023-24 University Of Maryland Supplemental Es
2023-24 University Of Maryland Supplemental Es2023-24 University Of Maryland Supplemental Es
2023-24 University Of Maryland Supplemental Es
 
Recommendation Letter Meaning In Marathi Wallp
Recommendation Letter Meaning In Marathi WallpRecommendation Letter Meaning In Marathi Wallp
Recommendation Letter Meaning In Marathi Wallp
 
Cheap Term Paper Help Cheap Term Papers Info,
Cheap Term Paper Help Cheap Term Papers Info,Cheap Term Paper Help Cheap Term Papers Info,
Cheap Term Paper Help Cheap Term Papers Info,
 
Pin By Augustus Bessah On English Teacher Essay Wri
Pin By Augustus Bessah On English Teacher Essay WriPin By Augustus Bessah On English Teacher Essay Wri
Pin By Augustus Bessah On English Teacher Essay Wri
 
How To Write An Argumentative Essay - Ch
How To Write An Argumentative Essay - ChHow To Write An Argumentative Essay - Ch
How To Write An Argumentative Essay - Ch
 
Lined Handwriting Paper Printable. Online assignment writing service.
Lined Handwriting Paper Printable. Online assignment writing service.Lined Handwriting Paper Printable. Online assignment writing service.
Lined Handwriting Paper Printable. Online assignment writing service.
 
Check Out Our Personal Stateme. Online assignment writing service.
Check Out Our Personal Stateme. Online assignment writing service.Check Out Our Personal Stateme. Online assignment writing service.
Check Out Our Personal Stateme. Online assignment writing service.
 
Academic Writing Companies. TOP. Online assignment writing service.
Academic Writing Companies. TOP. Online assignment writing service.Academic Writing Companies. TOP. Online assignment writing service.
Academic Writing Companies. TOP. Online assignment writing service.
 
The Journey, Creative Writing - GCSE English - Marked B
The Journey, Creative Writing - GCSE English - Marked BThe Journey, Creative Writing - GCSE English - Marked B
The Journey, Creative Writing - GCSE English - Marked B
 
Writing Workshop Anchor Charts - Distance Learnin
Writing Workshop Anchor Charts - Distance LearninWriting Workshop Anchor Charts - Distance Learnin
Writing Workshop Anchor Charts - Distance Learnin
 
Back To School Writing Pages - My Teaching Libra
Back To School Writing Pages - My Teaching LibraBack To School Writing Pages - My Teaching Libra
Back To School Writing Pages - My Teaching Libra
 
Problem Of Global Warming Argument. Online assignment writing service.
Problem Of Global Warming Argument. Online assignment writing service.Problem Of Global Warming Argument. Online assignment writing service.
Problem Of Global Warming Argument. Online assignment writing service.
 
Plain Premium Writing Paper Packs Envelopes
Plain Premium Writing Paper Packs EnvelopesPlain Premium Writing Paper Packs Envelopes
Plain Premium Writing Paper Packs Envelopes
 
Essay Plan Essay Plan, Study Notes, College Esse
Essay Plan Essay Plan, Study Notes, College EsseEssay Plan Essay Plan, Study Notes, College Esse
Essay Plan Essay Plan, Study Notes, College Esse
 

Recently uploaded

microwave assisted reaction. General introduction
microwave assisted reaction. General introductionmicrowave assisted reaction. General introduction
microwave assisted reaction. General introductionMaksud Ahmed
 
ECONOMIC CONTEXT - LONG FORM TV DRAMA - PPT
ECONOMIC CONTEXT - LONG FORM TV DRAMA - PPTECONOMIC CONTEXT - LONG FORM TV DRAMA - PPT
ECONOMIC CONTEXT - LONG FORM TV DRAMA - PPTiammrhaywood
 
Presiding Officer Training module 2024 lok sabha elections
Presiding Officer Training module 2024 lok sabha electionsPresiding Officer Training module 2024 lok sabha elections
Presiding Officer Training module 2024 lok sabha electionsanshu789521
 
MENTAL STATUS EXAMINATION format.docx
MENTAL     STATUS EXAMINATION format.docxMENTAL     STATUS EXAMINATION format.docx
MENTAL STATUS EXAMINATION format.docxPoojaSen20
 
Crayon Activity Handout For the Crayon A
Crayon Activity Handout For the Crayon ACrayon Activity Handout For the Crayon A
Crayon Activity Handout For the Crayon AUnboundStockton
 
How to Make a Pirate ship Primary Education.pptx
How to Make a Pirate ship Primary Education.pptxHow to Make a Pirate ship Primary Education.pptx
How to Make a Pirate ship Primary Education.pptxmanuelaromero2013
 
Hybridoma Technology ( Production , Purification , and Application )
Hybridoma Technology  ( Production , Purification , and Application  ) Hybridoma Technology  ( Production , Purification , and Application  )
Hybridoma Technology ( Production , Purification , and Application ) Sakshi Ghasle
 
Employee wellbeing at the workplace.pptx
Employee wellbeing at the workplace.pptxEmployee wellbeing at the workplace.pptx
Employee wellbeing at the workplace.pptxNirmalaLoungPoorunde1
 
Contemporary philippine arts from the regions_PPT_Module_12 [Autosaved] (1).pptx
Contemporary philippine arts from the regions_PPT_Module_12 [Autosaved] (1).pptxContemporary philippine arts from the regions_PPT_Module_12 [Autosaved] (1).pptx
Contemporary philippine arts from the regions_PPT_Module_12 [Autosaved] (1).pptxRoyAbrique
 
POINT- BIOCHEMISTRY SEM 2 ENZYMES UNIT 5.pptx
POINT- BIOCHEMISTRY SEM 2 ENZYMES UNIT 5.pptxPOINT- BIOCHEMISTRY SEM 2 ENZYMES UNIT 5.pptx
POINT- BIOCHEMISTRY SEM 2 ENZYMES UNIT 5.pptxSayali Powar
 
_Math 4-Q4 Week 5.pptx Steps in Collecting Data
_Math 4-Q4 Week 5.pptx Steps in Collecting Data_Math 4-Q4 Week 5.pptx Steps in Collecting Data
_Math 4-Q4 Week 5.pptx Steps in Collecting DataJhengPantaleon
 
SOCIAL AND HISTORICAL CONTEXT - LFTVD.pptx
SOCIAL AND HISTORICAL CONTEXT - LFTVD.pptxSOCIAL AND HISTORICAL CONTEXT - LFTVD.pptx
SOCIAL AND HISTORICAL CONTEXT - LFTVD.pptxiammrhaywood
 
Solving Puzzles Benefits Everyone (English).pptx
Solving Puzzles Benefits Everyone (English).pptxSolving Puzzles Benefits Everyone (English).pptx
Solving Puzzles Benefits Everyone (English).pptxOH TEIK BIN
 
Organic Name Reactions for the students and aspirants of Chemistry12th.pptx
Organic Name Reactions  for the students and aspirants of Chemistry12th.pptxOrganic Name Reactions  for the students and aspirants of Chemistry12th.pptx
Organic Name Reactions for the students and aspirants of Chemistry12th.pptxVS Mahajan Coaching Centre
 
Class 11 Legal Studies Ch-1 Concept of State .pdf
Class 11 Legal Studies Ch-1 Concept of State .pdfClass 11 Legal Studies Ch-1 Concept of State .pdf
Class 11 Legal Studies Ch-1 Concept of State .pdfakmcokerachita
 
Science 7 - LAND and SEA BREEZE and its Characteristics
Science 7 - LAND and SEA BREEZE and its CharacteristicsScience 7 - LAND and SEA BREEZE and its Characteristics
Science 7 - LAND and SEA BREEZE and its CharacteristicsKarinaGenton
 

Recently uploaded (20)

Model Call Girl in Tilak Nagar Delhi reach out to us at 🔝9953056974🔝
Model Call Girl in Tilak Nagar Delhi reach out to us at 🔝9953056974🔝Model Call Girl in Tilak Nagar Delhi reach out to us at 🔝9953056974🔝
Model Call Girl in Tilak Nagar Delhi reach out to us at 🔝9953056974🔝
 
microwave assisted reaction. General introduction
microwave assisted reaction. General introductionmicrowave assisted reaction. General introduction
microwave assisted reaction. General introduction
 
ECONOMIC CONTEXT - LONG FORM TV DRAMA - PPT
ECONOMIC CONTEXT - LONG FORM TV DRAMA - PPTECONOMIC CONTEXT - LONG FORM TV DRAMA - PPT
ECONOMIC CONTEXT - LONG FORM TV DRAMA - PPT
 
Presiding Officer Training module 2024 lok sabha elections
Presiding Officer Training module 2024 lok sabha electionsPresiding Officer Training module 2024 lok sabha elections
Presiding Officer Training module 2024 lok sabha elections
 
MENTAL STATUS EXAMINATION format.docx
MENTAL     STATUS EXAMINATION format.docxMENTAL     STATUS EXAMINATION format.docx
MENTAL STATUS EXAMINATION format.docx
 
Model Call Girl in Bikash Puri Delhi reach out to us at 🔝9953056974🔝
Model Call Girl in Bikash Puri  Delhi reach out to us at 🔝9953056974🔝Model Call Girl in Bikash Puri  Delhi reach out to us at 🔝9953056974🔝
Model Call Girl in Bikash Puri Delhi reach out to us at 🔝9953056974🔝
 
Crayon Activity Handout For the Crayon A
Crayon Activity Handout For the Crayon ACrayon Activity Handout For the Crayon A
Crayon Activity Handout For the Crayon A
 
How to Make a Pirate ship Primary Education.pptx
How to Make a Pirate ship Primary Education.pptxHow to Make a Pirate ship Primary Education.pptx
How to Make a Pirate ship Primary Education.pptx
 
Hybridoma Technology ( Production , Purification , and Application )
Hybridoma Technology  ( Production , Purification , and Application  ) Hybridoma Technology  ( Production , Purification , and Application  )
Hybridoma Technology ( Production , Purification , and Application )
 
Employee wellbeing at the workplace.pptx
Employee wellbeing at the workplace.pptxEmployee wellbeing at the workplace.pptx
Employee wellbeing at the workplace.pptx
 
9953330565 Low Rate Call Girls In Rohini Delhi NCR
9953330565 Low Rate Call Girls In Rohini  Delhi NCR9953330565 Low Rate Call Girls In Rohini  Delhi NCR
9953330565 Low Rate Call Girls In Rohini Delhi NCR
 
Contemporary philippine arts from the regions_PPT_Module_12 [Autosaved] (1).pptx
Contemporary philippine arts from the regions_PPT_Module_12 [Autosaved] (1).pptxContemporary philippine arts from the regions_PPT_Module_12 [Autosaved] (1).pptx
Contemporary philippine arts from the regions_PPT_Module_12 [Autosaved] (1).pptx
 
POINT- BIOCHEMISTRY SEM 2 ENZYMES UNIT 5.pptx
POINT- BIOCHEMISTRY SEM 2 ENZYMES UNIT 5.pptxPOINT- BIOCHEMISTRY SEM 2 ENZYMES UNIT 5.pptx
POINT- BIOCHEMISTRY SEM 2 ENZYMES UNIT 5.pptx
 
_Math 4-Q4 Week 5.pptx Steps in Collecting Data
_Math 4-Q4 Week 5.pptx Steps in Collecting Data_Math 4-Q4 Week 5.pptx Steps in Collecting Data
_Math 4-Q4 Week 5.pptx Steps in Collecting Data
 
Staff of Color (SOC) Retention Efforts DDSD
Staff of Color (SOC) Retention Efforts DDSDStaff of Color (SOC) Retention Efforts DDSD
Staff of Color (SOC) Retention Efforts DDSD
 
SOCIAL AND HISTORICAL CONTEXT - LFTVD.pptx
SOCIAL AND HISTORICAL CONTEXT - LFTVD.pptxSOCIAL AND HISTORICAL CONTEXT - LFTVD.pptx
SOCIAL AND HISTORICAL CONTEXT - LFTVD.pptx
 
Solving Puzzles Benefits Everyone (English).pptx
Solving Puzzles Benefits Everyone (English).pptxSolving Puzzles Benefits Everyone (English).pptx
Solving Puzzles Benefits Everyone (English).pptx
 
Organic Name Reactions for the students and aspirants of Chemistry12th.pptx
Organic Name Reactions  for the students and aspirants of Chemistry12th.pptxOrganic Name Reactions  for the students and aspirants of Chemistry12th.pptx
Organic Name Reactions for the students and aspirants of Chemistry12th.pptx
 
Class 11 Legal Studies Ch-1 Concept of State .pdf
Class 11 Legal Studies Ch-1 Concept of State .pdfClass 11 Legal Studies Ch-1 Concept of State .pdf
Class 11 Legal Studies Ch-1 Concept of State .pdf
 
Science 7 - LAND and SEA BREEZE and its Characteristics
Science 7 - LAND and SEA BREEZE and its CharacteristicsScience 7 - LAND and SEA BREEZE and its Characteristics
Science 7 - LAND and SEA BREEZE and its Characteristics
 

A Historical Perspective On Economic Aspects Of The Population Explosion The Case Of Preindustrial England

  • 1. This PDF is a selection from an out-of-print volume from the National Bureau of Economic Research Volume Title: Population and Economic Change in Developing Countries Volume Author/Editor: Richard A. Easterlin, ed. Volume Publisher: University of Chicago Press Volume ISBN: 0-226-18027-1 Volume URL: http://www.nber.org/books/east80-1 Publication Date: 1980 Chapter Title: A Historical Perspective on Economic Aspects of the Population Explosion: The Case of Preindustrial England Chapter Author: Ronald Lee Chapter URL: http://www.nber.org/chapters/c9671 Chapter pages in book: (p. 517 - 566)
  • 2. 9 A Historical Perspective on Economic Aspects of the Population Explosion: The Case of Preindustrial England Ronald Demos Lee 9.1 Introduction The preindustrial context offers particular advantages for the study of population change and its consequences. Over the course of centuries the effects of population pressure on resources have a chance to emerge and to dominate the more transitory influences. And other sources of long-run economic change, such as technology, capital accumulation, education, and institutional reorganization, were formerly weaker or absent. Thus history may provide us with an actual ceteris paribus situa- tion where statistical attempts to control for extraneous influences on contemporary development have failed. Of course there is always the risk that changing circumstances may have rendered the lessons of his- tory obsolete, but one has to start someplace; the drunk looks for his dime under the lamppost, though he lost it down the street. There have been many studies of the effects of population growth on economic development, but only a few of these studies are empirical. Ronald Demos Lee is associated with the Department of Economics and the Population Studies Center, the University of Michigan. This research was funded by NICHD grant HD 08586-03. I am very grateful to Professor E. A. Wrigley and Professor R. Schofield of the Cambridge Group for the History of Population and Social Structure for making the aggregate parish data set available to me. Philip Mirowski provided valuable research assistance at all stages of this project, and I also profited from his knowledge of English history and his creative insights. Professors Gavin Wright, Gary Saxonhouse, C. K. Har- ley, and Albert Fishlow made helpful comments on earlier drafts. I am particularly indebted to Professor Marc Nerlove for his detailed comments and his solutions to some of the analytic problems. 517
  • 3. 518 Ronald Demos Lee Theoretical studies, and the many simulation studies in the tradition of the classic work by Coale and Hoover (1958), can be queried on their premises (see Simon 1976). Cost-benefit studies of marginal lives, pio- neered by Enke (1960), are empirical only in appearance; their results can actually be derived a priori for virtually any country, regardless of its economic situation, as Ohlin (1969) has shown in an ingenious article.l Cross-national studies, seeking correlations of population growth rates and growth rates of per capita income (see, e.g., Kuznets 1967; Chesnai and Sauvy 1973; Easterlin 1972) have invariably found no significant association.2 Leff's (1969) well-known article on savings rates and dependency rates has been so heavily criticized as to leave the results in serious doubt. So although most economists and almost all demographers believe high population growth rates are a problem, there is a surprising shortage of empirical evidence. A study of the conse- quences of population change in a historical context may help demon- strate the importance of the variable in at least the simplest case. Historical studies may also aid our understanding of the causes of population change. It is sometimes suggested that until a couple of centuries ago the size of human populations in relation to resources was effectively regulated by socioeconomic institutions, but that in recent times these mechanisms have broken down under the influences of mor- tality decline, urbanization, technical change, and modernization in gen- eral. However, there is little understanding of how such mechanisms functioned in the past, how effective they were, and how they reacted to various kinds of external shocks. An examination of these historical mechanisms should help us understand to what extent modern and his- torical experience differ qualitatively, and should provide some perspec- tive on current high rates of population growth. This paper has three major parts. The first discusses the consequences of population change in preindustrial England, concentrating on wages, rents, and the ratio of industrial to agricultural prices. A simple two- sector model is developed to organize the analysis. The second part discusses the cause of population change, focusing on the nature of the social mechanisms that controlled it and their reaction to variations in mortality and productivity. In the third part, a simple model of eco- nomic-demographic equilibrium is developed, in which steady shifts in labor demand are the main determinant of sustained population growth, while the equilibrium living standards maintained during expansion re- sult from the interplay of largely exogenous mortality and institutionally regulated fertility. These three parts are followed by a brief summary and conclusion. Appendixes describe the data sources and the formal development of the dual-sector model.
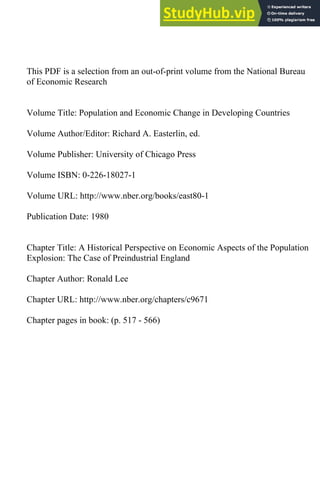
  • 4. 519 Perspective on Economic Aspects of the Population Explosion 9.2 Effects of Population Change 9.2.1 Overview For those who care for the overmastering pattern, the elements are evidently there for a heroically simplified version of English history before the nineteenth century in which the long-term movements in prices, in income distribution, in investment, in real wages, and in migration are dominated by changes in the growth of population. [Habakkuk 1965, p. 148] This "heroically simplified version" of English history, which gives the central role to population change, appears to be accepted by a ma- jority of economic historians. And since there was a rough synchronism of changes in population, wages, rents, and industrial and agricultural prices across Western Europe, many economic historians extend the same argument to the Continent as well.3 The assertion is that when population grew, the additional labor that was applied to a relatively fixed amount of land brought diminishing returns, leading to falling real wages and rising real rents. Since industry's main input was labor, indus- trial prices closely followed the real wage. Thus a large population caused low prices for industrial goods relative to agricultural ones. Since, however, total agricultural incomes rose with population, so did the demand for industrial goods; thus industrial output-and with it urbani- zation-increased when population grew. This extension of the market encouraged specialization and trade. Figure 9.1 shows the basic data series for England over the period 1250 to 1800. This analysis will focus on the latter part, from 1540 to 1800, for which better data are available; however, the earlier data help put this later period into perspective and strengthen the findings by sug- gesting their wider applicability. The data plotted in figure 9.1 are de- scribed in Appendix 9.1; however, the population series merits special mention. It is based on data from 404 parishes, collected and aggregated by the Cambridge Group for the History of Population and Social Struc- ture. Although the population estimates used here are still preliminary, they are far superior to the demographic data previously available. The series in figure 9.1 shows that the population-induced changes in the preindustrial economy were not trivial; rather, they were of fun- damental importance to the people of the time. For example, the seg- ment of society dependent primarily on wage income was comfortably off at the end of the fifteenth century; after a century of population growth their wages had fallen by 60% and their situation was desperate. Landlords were enriched over this period; industry grew rapidly; and industrial prices plummeted in relation to agricultural prices.
  • 5. Life Expectancy (upper classes) --,.... - ...Oセ セ ...... 50 .c 40 t iii 30 :;; V> 20 セ 10 oGMMMセMMMGMM⦅NlM⦅MMMiN⦅MMGMMMMMG Population Size x '" "0 E x '" "0 E Industrial Price Divided by Agricultural Price x '" "0 E Rent/Wage Ratio x '" "0 E 1200 1300 1400 1500 1600 1700 1800 Fig. 9.1 Basic data for England, 1250-1800. For a description of the data and sources, see Appendix 9.1.
  • 6. 521 Perspective on Economic Aspects of the Population Explosion 9.2.2 Population and Wages Before developing and estimating the dual-sector model, I will ex- amine the relation between population and wages in a simpler context. This will allow me to use annual data and to develop results comparable to my earlier work. The wage is of interest because it reflects the marginal product of labor throughout the economy. It is also of interest because it represents the chief source of income for a large and growing segment of the popu- lation, rising from about 30% in rural areas in the sixteenth century to about 50% in 1700, and perhaps 75% in 1800 (Everitt 1967, pp. 397- 99). While the wages of labor varied by skill and location, the various wage rates seem to have maintained rather fixed ratios one to the other (see Finberg 1967, p. 599, and Phelps-Brown and Hopkins 1955), so that a single wage can be used to represent changes over time in the experience of most workers. Under competitive conditions, the real wage is determined by the intersection of the schedules relating labor supply and demand to the real wage. The labor demand schedule corresponds to the relation be- tween the amount of labor utilized in the economy and its marginal productivity. This will depend on available land, capital, and technology, among other things, and in England during this period it is reasonable to expect changes in these to have increased the demand for labor in a cumulative manner. If the demand schedule shifts outward at a constant rate p, while maintaining its shape, then its position over time will be indexed by ePt• Now consider labor supply. In the short run, the labor services pro- vided by the population might depend positively or negatively on the real wage, but there is no possibility of identifying such an effect empiri- cally with these data. Over the longer run, the supply of labor varies roughly in proportion to population size, although the age-sex distribu- tion of the population should also be taken into account. The combined effects of the shifting supply and demand schedules on the short-run equilibrium wage may be expressed as: (1) or, in log form, as: (2) In Wt = p. +pt - 7JlnNt + fot. If the the short-run labor supply schedule is inelastic to the wage, then 7J measures the elasticity of the labor-demand schedule. The rate of shift of labor demand is p; p. is a scale parameter; and fot reflects the influence of climate and other omitted variables. The rate at which population
  • 7. 522 Robert Demos Lee can grow without altering the wage, or the rate of population "absorp- tion," is plY]. Note that from equation 2 the rate of change of wages (wlw) should be related to the rate of population change (IVIN) by: wlw = p + 'YJNIN. The data on wand N that were plotted in figure 9.1 can be used to get a rough idea of 'YJ and pl'YJ' Inspection of the population series suggests the following periodization: Population Rate of Change Growth Rate of Wages Date (% per year) (% per year) 1535-1605 .65 -.72 1605-45 .49 .15 1645-95 .08 .54 1695-1745 .23 .60 1745-95 .58 -.86 Figure 9.2 plots wlw against N/N, treating each subperiod as an obser- vation. There is indeed a clear negative relationship between the growth rates of population and wages, and the slope suggests that 'YJ is about -2 or -2.5. The rate of absorption is apparently about 0.4% per year, since at that rate of population growth, w/w = O. More rapid popula- tion growth sharply depresses wages; slower growth allows wages to rise. The relation of wages to population over this period can be explored more exactly with regression analysis. For this purpose I have used not the real wage series shown in figure 9.1, which is deflated by agricultural prices alone, but the Phelps-Brown and Hopkins (1956) series, which is deflated by the cost of a mixed basket of goods including both agri- cultural and industrial commodities. This deflator is more appropriate for measuring welfare changes. The estimated equation is similar to equation 2, but somewhat more flexible. In addition to N, population size, I included variables Nl and N2, which give population size in sub- periods, allowing the wage-population elasticities to be different in 1539- 1638, 1639-1745, and 1746-1839. In addition to t, I also included t3 . This allows for the rate of shift to be quadratic in time, accelerating in the eighteenth century. Omitting the t2 term constrains the rate of shift to change monotonically over the period. A special time variable, Dt, allows the period after 1809 to have a different rate of shift; this was included after inspection of residuals from earlier specifications. Finally, the error term was corrected for first-order autocorrelation, using the noniterative Cochrane-Orcutt procedure. The equation was fitted to an- nual data for 1539-1839, with the following result:
  • 8. 523 Perspective on Economic Aspects of the Population Explosion 12 8 _ 1695-1745 - 1645-95 Cl) .4 OJ セ '0 Cl) g' 0 '" .t:: U '0 Cl) <ii 0:: -.4 -.8 -1605-45 _1545-1605 -1745-95 Fig. 9.2 (3) -1.2 ャMMMMャ⦅セMMlNNMNlNNMNjャNMMNQNNMセMNNNiMMャMMMMj o .2 .4 .6 .8 1.0 Rate of Change of Population Rates of change for population and wages in England, 1540-1800. Rates are given in percentage per year. Rates of change of wages are calculated from centered thirty- year averages of wages, except for 1795. 1nWt = 6.81 + .0057t - .18 X 10-8 t3 + .008Dt (7.27) (3.16) (.13) (3.77) - 1.511nNt + .0071 InNl t + .0075 InN2t (5.61) (.87) (.58) R2 = .161 (for changes in Inw); t-statistics are given in parentheses below each estimate. The results may be interpreted as follows: i. Real wage levels were very sensitive to population size, with an elasticity of -1.5; thus a 10% increase in population caused a 15% decrease in real wages. This estimate is significant at the .001 level. The elasticity is lower than that suggested by figure 9.2 because of the difference in deflators.
  • 9. 524 Robert Demos Lee ii. Surprisingly, there is virtually no change in this elasticity from sub- period to subperiod, as is shown by the small and insignificant coeffi- cients for 1nN1 and 1nN2. lll. The coefficients of ( and (3 show that the rate of shift in the relation between population and wages, reflecting technical change and capi- tal accumulation, did not accelerate in the eighteenth century with early stages of the industrial revolution. This also is a surprising result. IV. From 1539 to 1810, a population growth rate of 0.38% per year would have been consistent with a constant real wage. After the Napoleonic wars, the rate of shift more than doubled, and a growth rate of 0.88% per year would have left wages unchanged. This shows a dramatic alteration in the growth rate of the demand for labor. v. The low R2 is due to the Cochrane-Orcutt transformation, which causes quasi-differences in the data, emphasizing their short-run variability. Perhaps the most striking aspect of all these estimates is the size of the wage-population elasticity. If production obeyed a Cobb-Douglas production function, these elasticities would equal minus the share of nonlabor inputs, or 0.4 to 0.6. The estimate above is about three times this great, suggesting that the Cobb-Douglas interpretation is incorrect. I will discuss this point in detail in the next section. Since (3, N1, and N2 all had insignificant effects, and the period after 1809 seemed quite different, I reestimated a simpler version of equation 3 for 1539-1809, correcting for second-order autocorrelation using an iterative Cochrane-Orcutt procedure. (4) lnWt = 25.59 + .00645( - 1.62lnNt (11.73) (10.03) (9.23) R2 = .75 DW = 1.97 R2 for changes = .19; (-statistics are given in parentheses. These estimates are consistent with equation 3. The implied rate of absorption is 0.4% per year, and the wage-population elasticity is -1.62. It is interesting to compare the results of this part with previous work I have done using less satisfactory demographic data4 (see table on next page). The elasticities estimated in equations 3 and 4 are larger in absolute value than the earlier estimates, but given the differences in data, time periods, and time units, I do not find the differences troubling. The principal inconsistency arises from the estimates of rate of population absorption. The previous studies, taken together, suggest a fivefold in-
  • 10. 525 Perspective on Economic Aspects of the Population Explosion Annual Period Time Wage-Population Rate of Source Covered Units Elasticity ('YJ) Absorption Lee 1973 1250-1700 50 years -1.10 .00089 (7.05) Lee 1977 1705-89 5 years -1.29 .0046 (3.69) Equation 4 1539-1809 1 year -1.62 .0040 (9.23 ) crease in this rate between 1250-1700 and 1705-89. This increase seems a plausible reflection of the agricultural and industrial revolutions. However the estimate in equation 3 shows no sign of an accelerating rate of shift. I have no explanation for this inconsistency, although the estimated dual-sector model will show that this constant rate of absorp- tion masks important differences in rates of shift between sectors. 9.2.3 A Dual-Sector Model The effects of population growth on the economy can be understood in richer detail if we distinguish between the agricultural and nonagri- cultural sectors. In this section I will develop a simple model of a dual- sector economy; in a subsequent section I will test it empirically. In the model, agricultural production exhibits sharply diminishing returns to labor, owing to the relatively fixed supply of land. Industrial production, which uses labor and agricultural output in fixed proportions, encounters no such bottleneck. The demand for industrial and agricultural output is such as to leave their shares in national income constant, when valued at current prices. Throughout I will assume that the English economy was closed. In fact, exports made up about 5% or 6% of national income in 1688, rising to 14% by 1800 (see Deane and Cole 1969, p. 309). Some justi- fication for the closure assumption is given by Kelley and Williamson in the context of Meiji Japan (1974, chap. 12).5 Capital and capitalists are ignored completely by the model, except that land-augmenting investment and technical progress at a constant rate are allowed in agriculture.« This is a model of a preindustrial econ- omy; the industrial sector is largely passive and is not intended to pro- vide insights into the beginnings of the industrial revolution. Details of the development of the model are given in Appendix 9.2; here I will discuss only the assumptions and the main results. Industrial Production The nonagricultural sector, which I will for convenience call "indus- trial," provides such diverse items as domestic service, buildings, textiles,
  • 11. 526 Ronald Demos Lee lace, household goods, iron products, and so on.7 Production in this sector directly requires only trivial amounts of land. The main inputs are labor and agricultural output, such as skins, wool, and grain. I assume that these inputs are combined in fixed proportions. By appropriate choice of units of measure for agricultural output, A, and labor, N, the fixed input coefficients can be made to equal unity. Thus, (5) where I is "industrial" output, NI is labor employed in the industrial sector, and Al is agricultural output used in the industrial sector. If no inputs are wasted, then: (6) I will further assume that there are no profits in this sector, so that the price of industrial output, PI, just equals the cost of inputs, WI + P.{, where WI is the industrial-sector wage and p.{ is the price of agricultural output. A comparison of the wages of builders' helpers (Phelps-Brown and Hopkins 1955) and agricultural laborers employed in nonseasonal work without remuneration in kind (Finberg 1967) shows that these were equal in southern England from 1450 to 1650. I will therefore assume that WI = WA and drop the subscript. Thus: (7) or, taking A as the numeraire, as I will throughout, (8) p = w + 1, where p = PAIPl and w = WIPA • From equation 8 it is easy to determine the effect of population change on the terms of trade between industry and agriculture. Let YI = wip be labor costs as a proportion of total costs in industry. Then, if N = N.{ +NI is the total labor force (by assumption, fully employed), and E denotes "elasticity," (9) Ep,N = yIEw.N' Changes in technology and formation of industrial capital can best be described as labor-saving rather than material-saving. This was particu- larly true for textile manufacture but probably was false for the iron industry, which became important only at the very end of the period. Labor-augmenting change at the constant rate p has the effect of reduc- ing labor requirements by a factor of e- pt. Thus, for example, equation 8 can be rewritten: (10) p = e-ptw + 1.
  • 12. 527 Perspective on Economic Aspects of the Population Explosion The Demand for Industrial Output The amount of industrial output demanded by a household typically depends on its income, with an elasticity greater than 1, and on the relative price of industrial goods, with an elasticity less than O. These effects can be incorporated at the household level by a linear expendi- ture system, which has the advantage of being aggregable. Although it would be desirable to incorporate such a demand specification, in the present model I assume that the shares of agriculture and industry in national income, valued at current prices, are fixed. This is equivalent to assuming income elasticities of unity for both kinds of goods, and price elasticities of minus one. The assumption is not so implausible as it may first appear, since the incomes of landlords and laborers typically moved in opposite directions. Historical data suggest a major decline in agriculture's share at the end of the eighteenth century but have been interpreted in conflicting ways concerning earlier changes.8 Final product in agriculture is total product less the portion used in the industrial sector: A - I. The value of total output is: A - I + pI = A + I (p - 1). The assumption of constant shares can conveniently be written: (11) pI = A(A -l), since this yields a share of final product in agriculture of 1/(1 + A), a constant. This does not mean, of course, that in real terms the ratio of nonagri- cultural to agricultural consumption was constant; quite the contrary. Growing population would confront diminishing returns in agriculture, depressing wages and industrial prices, as indicated by equation 9. The assumption of a constant share of industry in national income would therefore require an increasing share of industry in real output, when population grew. And indeed this is historically accurate (see Deane and Cole 1969, p. 162). The ratio of industrial to agricultural output, both intermediate and final, 1/A, turns out to be: (12) I/A = ,j(w + 1 +A). This clearly increases as w falls; therefore, when population grows, in- dustrial output increases more, proportionately, than does agricultural output. For a detailed discussion, see Appendix 2F. Agricultural Production Unlike industry, agricultural production is constrained by a relatively invariant supply of potentially arable land. However, conditions of agri-
  • 13. 528 Ronald Demos Lee cultural production certainly did not remain static over the period under consideration. On the one hand, new rotations were adopted and new crops sown, land tenure arrangements were altered, and greater use was made of farm animals and fertilizer. Some of these changes may be regarded as reactions to changing factor prices, themselves due to popu- lation change; others represent genuine technological progress. On the other hand, the supply of land was increased through investment in such projects as draining the fens; and investments also facilitated the more efficient use of existing arable land, particularly in association with en- closure. These changes can be described as "land-augmenting." Lacking detailed information on the timing and extent of these changes, I will attempt to capture them by an exponential trend. As noted above, the large (in absolute value) estimated wage-popula- tion elasticity is inconsistent with a Cobb-Douglas production function; so aCES (constant elasticity of substitution) production function will be assumed in agriculture. Denoting by F the initial quantity of land, and by p the rate at which land is augmented by reclamation, invest- ment, and technological progress, the CES production function can be written: (13) If agricultural labor is paid its marginal product, then w = [(1 - 01)/ 0o/l](A/NA)lH or, alternatively, for appropriate a and b: (14) w = a[NA13e-{1pt + b]-(l+/l)/I3. This relation can be estimated from data on real wages and employment in agriculture. Total rents-whether explicitly treated as such or merely imputed to land-are the remainder after labor has been paid: R = A - wNA , where R is total money rents divided by PA • In a CES production func- tion, the ratio of returns to inputs is simply related to the ratio of input quantities; here: (15) Alternatively, the rent per efficiency-unit of land, r = R/ (FePt ), is re- lated to wages by: (16) These equations are easily estimable after a log transformation. How- ever, it is impossible to know for any particular rent series whether it indexes R or r, since it mayor may not include the return to new invest- ments in the land. An important shortcoming of this analysis is that investment in agri- culture is left exogenous and is indeed assumed to take place at a con-
  • 14. 529 Perspective on Economic Aspects of the Population Explosion stant rate. But it is clear that agricultural investment and also perhaps technical change was more rapid when rents and agricultural prices were relatively high, and these themselves depended on population. It might be possible to get at these issues empiricaIIy through analysis of bills of enclosure. By ignoring these effects, I have surely overstated the long- run negative effects of population growth in England. However, regres- sions that do not include a shift term do not suffer from this bias, and they confirm the negative effects of population, although with a lower elasticity (see Lee 1973, p. 588). Labor Force Allocation In this model, wages vary because of variation in the labor employed in agriculture, NA. However, data on NA are not available; there are only data on N, the total labor force. Estimated relations between wand N reflect in part the effect of N on the allocation of labor between the two sectors. For this reason it is important to analyze the determinants of sectoral labor force aIIocation. In Appendix 9.2.B it is shown that: (17) where /,A is labor's proportional share of agricultural output, which makes it possible to calculate the implied labor force share of agriculture. In Appendix 9.2.C, foIIowing Marc Nerlove's analysis of this model, it is shown that: (18) eセ .N = セQ +Ew .N ZI (p:aIセ / セQ - (1 - /'A) セiャN This result is particularly useful, because it makes possible the calcula- tion of EW 'N.4 and (T = 1/(1 + f3). In Appendix 9.2.D it is shown that: (19) (T = -(1 - /'A)ENA .N/Ew .N. 9.2.4 Empirical Results for the Two-Sector Model Population and Wages Under the CES specification, the elasticity of wages with respect to labor is a variable, not a constant. It is therefore inappropriate to esti- mate log-linear equations such as equations 1 through 4 above. The appropriate procedure is to estimate the highly nonlinear equation 14, using maximum likelihood methods. My attempts to do so failed; the program encountered nearly singular matrixes it could not invert. An alternative approach is to estimate a log-quadratic approximation (see
  • 15. 530 Ronald Demos Lee Kmenta 1971, pp. 462-65); my attempts to estimate f3 and (J in this way were also unsuccessful. Therefore I reverted to estimates of the log- linear equation, a decidedly inferior procedure. In the dual-sector context, the log-linear wage-population regressions discussed above in section 9.2.2 are not appropriate, since the real wage employed there was based on a fixed basket of goods that included both industrial and agricultural products. This is an appropriate standard to use for welfare comparisons, but for the purpose at hand the money wage should be deflated by agricultural prices alone. The regression reported below uses decadal averages of money wages from Phelps- Brown and Hopkins (1955) for 1540 through 1700, and for the eigh- teenth century uses a series reported in Deane and Cole (1969, p. 19), which takes into account regional differences in wages and population growth. The wage is deflated using the agricultural price index described in Appendix 1. Rather than using total population as a proxy for labor supply, it was possible to take account of age structure, as estimated by the inverse projection method (see Lee 1974). Ages 0-14 were weighted by zero, 15-64 by 1, and 65+ by 0.5. Several versions of the log-linear regression were run. The one re- ported below allows for different EW •N in three time periods: 1540-1629, 1630-1719, and 1720-1800. It also includes linear and cubic shift terms. (20) 1n(w) = 14.6 + .0103t - .533 X 1O-7 t3 (9.16) (5.21) (3.43) - 2.22 inN + .0197 inN1 + .0596inN2 (7.08) (1.20) (2.31) R2 = .832 D.W. = 2.14. There are several points worth noting. First, the estimates of Ew.N , which range from -2.22 to -2.16 depending on the period, are even greater in absolute value than those in section 9.2.2. In other specifica- tions of this equation, not reported here, they reach -2.7. There is a simple explanation for the discrepancy between these and the earlier results: when the cost of a mixed bundle of commodities is used to deflate the money wage, population change induces partially offsetting variations in the costs of the industrial and agricultural components. Therefore the estimated elasticity is closer to zero. Second, although there is a statistically significant change in Ew .N for the last subperiod, the effect is numerically inconsequential. Third, and quite striking, the initial annual rate of land-augmenting change, measured as p/YJ, is 0.45 %, but by 1800 it has declined to zero (that is, for fixed N, olnw/ot evaluated at t = 260 is roughly zero).
  • 16. (21) 531 Perspective on Economic Aspects of the Population Explosion In other specifications the rate of shift also declines, but only by about two-thirds. This eighteenth-century retardation in agricultural progress is consistent with the view of Deane and Cole (1969, p. 75), which was based on quite different evidence. Population and Terms of Trade Data for constructing the terms-d-trade index were available for ten- year periods from 1541-50 to 1791-1800, giving 26 observations. Some splicing was necessary, and the last 100 years of the series are not com- pletely comparable with the first 160. This is a serious difficulty with the results presented below, since different industrial commodities have different labor intensities. Nonetheless, I have taken the data at face value for present purposes. In developing the model, I made simplifying assumptions about units of measure. In practice the simplifying transformations can be made only after estimation has taken place. The equation estimated, there- fore, was not equation 10; two scaling parameters were added, as well as a more flexible rate of labor-saving progress. The following are max- imum likelihood estimates: Pt = 12.8 + 1.63e-·OOl7t-.243XIO-7t3Wt (4.24) (14.1) (2.49) (2.79) R2 = .91 D.W. = 1.58. This estimated equation can be transformed to the form of (10) by defining: p= p/12.8 and w= (1.63/12.8)w = .127w. Then: (22) The estimated coefficients of t and t3 imply an annual rate of labor- saving change of only 0.117% in 1540, rising to 0.304% in 1700 and 0.061 % in 1800. Thus, while the rate of progress in agriculture was declining, that in industry was accelerating. The cumulative effect of this change was to reduce the labor inputs per unit of output by 25% be- tween 1540 and 1700, and between 1700 and 1800 by a further 36%. Over the entire 260-year period, labor requirements were reduced to 48% of their initial level. The rates of shift in the two sectors, and their changes over time, are plotted in figure 9.3. The time paths appear to be mirror images, and the sum of the two rates is nearly constant. This reveals clearly the sec- toral differences that were concealed by the constant rate of absorption. The parameter estimates in equation 21 can also be used to estimate Yh labor's share of costs in industry. The average wage was 29.5, which transforms to .127 X 29.5 = 3.75. Initially, therefore, Y1 = 3.75/4.75 = .79; labor costs were about 80% of total costs of industrial produc-
  • 17. 532 Ronald Demos Lee Rate of Labor Augmenting Progress In Industry Rate of Land Augmenting Progress In Agriculture セ OL-_-....L..---L.--_....L_--=,:-:---..L.,_--=::'""../ 1500 1550 1600 1650 1700 0.8 '" oJ!. 0.6 Q) a. 3, 04 '" C セ 0.2 3: Fig. 9.3 Estimated rates of progress in agriculture and industry. Calculated from equations 20 and 21. tion. By 1800, however, "II had fallen to .48 X 3.75/(.48 X 3.75 + 1) = .64. These estimates suggest that the effect of population change on terms of trade also declined (see eq. 9). In 1540, Ep,N = .79(-2.22) = -1.75; in 1800, Ep,N = .64(-2.16) = -1.38. These estimates seem on the high side (in absolute value) when compared directly with his- torical evidence (see Lee 1973, p. 591). I should caution that domestic service, which made up a large propor- tion of the nonagricultural sector, is not included in the industrial price index. The effect of its inclusion would doubtless be to raise "I, labor's share of the cost inputs. Population and Rent Of all the data series, that for rent is undoubtedly the worst (see Appendix 1E). It is the shortest, covering only the period 1540 to 1660, in time units of ten years; thus there are only twelve observations. It is also unclear just what theoretical concept is represented: Does the series include rents on marginal lands brought into cultivation only under pressure of rising agricultural prices? If so, the increase in rents as population grows will be understated. Does it include rent changes re- flecting investment in the land? I used the rent series to form the ratio R/w, which under the CES specification is log-linearly related to N A , as in equations 14 and IS. The actual regression uses N, not NA; results can be interpreted with the help of EN A,N (see Appendix 2E) . (23) In(Rt/wt> = -36.6 - .0420t + 7.50 InN, (2.99) (2.63) (3.08) R2 = .77 D.W. = 2.60. Because the time period is relatively short, and population was growing fairly rapidly over most of it, time is quite colinear with InN. When a
  • 18. 533 Perspective on Economic Aspects of the Population Explosion quadratic or cubic time-shift term is included, population's coefficient becomes small and insignificant. The implied annual rate of land augmenting change is roughly .042/ 7.50 = 0.56%, compared with an estimate of 0.44% for this period from equation 20. From equation 20 or equation 23, we can derive an estimate of the elasticity of substitution in agriculture. First, however, eセ ,N must be evaluated using equation A20 in Appendix 2. This requires estimates of N1/N, YA, Ew,N, and w/(p + "). Reasonable mean values of these variables are NriN = .35, YA = .45, Ew .N = -2.22, and w/(p +,.) = .6.9 These imply ENA ,N = .66, so that as population rises, the propor- tion of the labor force agriculture declines quite markedly. Using equa- tions A22 and A27, the implied estimates of (J can be derived. These are 0.16 from equation 20 or 0.09 from equation 23. The first figure is surely more accurate, since it is based on the full 260 years, while the second is based on only 120 years. Is an estimated elasticity of substitution as low as 0.16 at all plau- sible? I am not sufficiently familiar with the agricultural techniques used to be able to form a judgment. Most modern studies of agricultural production report values in the neighborhood of unity, although low values, near 0.2, have been estimated for Meiji Japan (Sawada 1970) and India (Srivastava and Heady 1973). The reader may have noted that all the estimates of population's effects were made using single-equation methods. However, if population growth rates are themselves dependent on economic welfare, then the system is simultaneously determined, and single equation methods will yield biased parameter estimates. In previous work (1973, 1978a, b) I have dealt with this problem at length. It turns out that simultaneity bias is not very important when estimating effects of population change; it is, however, a serious problem when examining the causes of population change. So the results reported in this part should not have been seri- ously biased by the use of single-equation methods. Miscellaneous Effects at Population Growth I have already discussed the effects of population growth, relative to augmented land, on wages, rents, and the terms of trade. Population also affected the composition of output. In Appendix 2, expressions for the effect of population on I and on 1/A are derived (see eq. A29, A30). Evaluating these expressions gives E1/A,N = 1.33 and E 1.N = 1.65. Thus a 10% increase in population would increase 1/A by 13% and increase I by 16.5%. Labor-saving progress in industry has a similar effect on the composi- tion of output. Evaluating expression A42 yields E1•a = -.85; thus al-
  • 19. 534 Ronald Demos Lee most all the labor released by progress in industry is used to boost output in industry. The effects of technical change and population growth taken together go a long way toward explaining the rapid industrial growth of the late eighteenth century. Using expression A28 for 1/A and evaluating it in 1731-40 and in 1791-1800, I find that over this sixty-year period, industrial output in real terms should have increased by 60% more than did agricultural output. This compares with a figure of 90% derived from Deane and Cole (1969, p. 78). Thus the combination of rapid population growth, rapid improvement in industrial technology, and slowing change in agricultural technology accounts for much of the increased importance of industry. Population growth also had an important effect on the factor distribu- tion of income. For farmers working their own land, these effects would have been relatively unimportant; but for landlords and laborers the effects were very large. Evaluating expression A37, I find Es.x = -1.4, where S is labor's share of total output. Thus a 10% increase in popu- lation would reduce S from perhaps 55% to 47%. Finally, I should stress that the estimated value of EII'.,Y = -2.22 greatly overstates the effect of population change on material welfare, because the wage is expressed in terms of the agricultural commodity. Consider instead a wage deflator based on a 50-50 mix (in terms of mean value) of agricultural and industrial commodities. This is essen- tially the real wage concept measured by Phelps-Brown and Hopkins (1956), and used in section 9.2.2 above. Call this real wage w*. Then, given actual mean values for wand p, it can be shown that E,c'.,Y . (5/8)Ew •N . _1.4.10 This agrees very well with the estimates of section 9.2.2 above (-1.5 and -1.6). 9.3 Causes of Population Change 9.3.1 A Test of Two Simple Theories The broad issues were already sketched in the Introduction: Is popu- lation an endogenous element in the socioeconomic system, regulated by norms and institutions so as to establish and protect a culturally defined standard of living? Or is population an independent force that determines levels of living, and to which the society and economy must adjust as best they can? The former view has been held by many classi- cal and neoclassical economists from Malthus to Harberger (1958, pp. 109-10), and by many biologists and ecologists as well (e.g., Dubos 1965, pp. 286-87). The latter view is generally held by historians, demographers, and some economists.
  • 20. 535 Perspective on Economic Aspects of the Population Explosion In its simplest form the classical theory-which makes population endogenous-posits a functional relation between the population growth rate and the level of wages. There will be some wage corresponding to zero population growth; this equilibrium wage is the conventional living standard or natural price of labor. In figure 9.4 I have plotted popula- tion growth rates against the wage level for twenty-five-year periods, 1550 to 1799, using the data introduced above. It is clear that there is no strong relation between the two; the scatter provides no support for the classical theory as applied to this period. In fact, similar results hold for the entire period 1250 to 1789 (see Lee 1973, 1978a). The alternate theory holds that population varied independently. The simplest version argues that fertility is maintained at relatively fixed levels by institutions and customs that have evolved over the long run to ensure population replacement. Over the shorter run, population growth rates are determined by variations in mortality, since fertility does not change. In figure 9.5 I have plotted English population growth rates against the life expectancy of the British aristocracy (see Appendix lA) for twenty-five-year periods, 1550 to 1724. After 1724, this life- expectancy series is no longer representative of the general population; before then, it compares well with other series in so far as changes are concerned, if not levels.u Figure 9.5 shows a very close relation between mortality and population change over this 175-year period. And since the data come from totally different sources, there is no possibility that the relation is an artifact due to errors in measurement. .8 • • • • • • • • • • 40 50 60 70 Wage Rate (Index) Fig. 9.4 Population growth rates and the real wage for twenty-five year periods, 1550-74 to 1775-1799.
  • 21. 536 Ronald Demos Lee 38 :2 36 t: 15 10 V> セ 34 2:: >- " c: '" 1:3 '" セ 32 2 .:; 30 •• • • • • • o 2 .4 .6 .8 Fig. 9.5 Rate of Change of Population (percentage per year) Population growth rates and life expectancy of the British aristocracy, by twenty-fIve-year periods 1550-74 to 1700- 1724. This is strong support for the view that population growth rates varied independently, not primarily in response to changes in wages or the de- mand for labor (for formal tests of these hypotheses see Lee 1973, 1978a, b). But how then are we to explain the broad historical agree- ment of economic and demographic trends? In subsequent sections I will discuss in more detail the mechanisms thought to have regulated population in relation to resources in preindustrial Western Europe and attempt to reconcile the dependent and independent aspects of popula- tion change. 9.3.2 Fertility and Mortality The Preventive Check To the extent that European societies controlled population, it was almost entirely through regulation of fertility, not mortality. The con- ventional view of the mechanism linking fertility to resources in prein- dustrial Western Europe has not changed in broad outline since Malthus: Marriage required a sufficient livelihood, in the form of property or an adequate wage income. "Sufficiency" was defined by longstanding norms and institutions, which varied from country to country. Thus Malthus thought that the English were more prosperous than other Europeans because they regarded wheat and meat as necessities and would not
  • 22. 537 Perspective on Economic Aspects of the Population Explosion marry without income enough to provide them for their families. Euro- peans in general were regarded as more prosperous than other peoples because they required more comfortable circumstances before they were willing to marry. Once married, couples were believed to bear children at a "natural" rate, while making no efforts to control family size. Such a system would relate aggregate fertility rates to per capita income or wealth, and to wage rates. Whereas historical demographers have confirmed the general outline of the natural fertility theory, a number of studies have shown that in the eighteenth and nineteenth centuries, at least, marital fertility as well as nuptiality responded positively to the harvest cycle. There is also some mixed evidence that on balance suggests that wealthier couples may not only have married earlier, but also have had higher fertility within mar- riage (see Smith 1977). The Cambridge Group's aggregate parish register data set makes it possible to analyze the effect on vital rates of short-run variations in the real wage. It provides series of the annual numbers of baptisms, burials, and marriages in 404 parishes from 1539 to 1839. In theoretical work described elsewhere (Lee 1975, 1978a) I have shown that short-run fluctuations in such series can be interpreted as fluctuations in marital fertility, mortality, and nuptiality. This enables us to draw demographic inferences from changes in the numbers of events without bothering about the size and structure of the population at risk. I have also shown (Lee 1978a) that short-run fluctuations can be used to study the causes of population change without contamination by the simultaneity in the system. I have used cross-spectral analysis to estimate these relations, in part because for compelling reasons the theoretical analysis mentioned above had to be carried out in spectral terms.12 However, given the theoretical results, the empirical work could have been carried out by regression analysis after suitable "filtering" of the series. Spectral analysis examines the variances and covariances of sets of series by frequency or periodicity. Any detrended series may be exam- ined in this way; there is no presumption that there are cycles in the data. It is convenient, although not entirely accurate, to think of fre- quency here as distinguishing, say, between long-run (low-frequency) and short-run (high-frequency) components of variation in the series. My previous work has established that for wavelengths of less than fifteen years or so, the population size and age structure, and the dura- tion structure of marriages, have only negligible effects on births, deaths, and marriages. For my purposes, therefore, I will refer to these as "short run." I will use three basic cross-spectral concepts in this paper. The first is "coherence squared," denoted C'2(A), which is analogous to R2 in
  • 23. 538 Ronald Demos Lee regression analysis but is specific to wavelength '. The second is phase shift, cj> ('), which measures the lag of one series behind the other in radians at each wavelength. The third is "gain squared," G2(,), which is analogous to the square of a regression coefficient, again specific to wavelength. Estimated cross spectra for births and marriages in relation to wages are presented in figure 9.6. First consider births. For periods of thirteen years or less, C2 (,) is typically significantly greater than zero, indicating that wage fluctuations did indeed affect marital fertility, explaining per- haps 25 % of the variance. The phase shift diagram indicates that mari- tal fertility lagged slightly behind the wage rate, by something less than a year. I have not drawn in confidence bands for the phase estimates, but Births by Wages Marnages by Wages o 」ッlNNZRャZZPNNNLQGZZMPMZVGMZNWLNMMMNNjTLNMMMMZSセN SZZMZZGRM]UセR .6 oLag 2 oC..J.,..-J-......l-.--'------,-L--L --: co 2010 6.7 4 3.3 2.5 2 4 6 055',,,,,,,",, '''I .6 C>U .4 U c"o セ セ セ セ .2 o a- UUl "" セ ol:' セvI セ セ 2 ","0 .I: '" 。NNセ 4 3.32.5 2 .6 Wavelength, I., In Years Wavelength, ;" In Years Fig. 9.6 Cross-spectral estimates of births and marriages by wages for England, 1539-1839. Phase estimates indicated by solid circles correspond to significant estimates of coherence squared and are more accurate than others. Estimates were made using a Parzen window with T = 301, M = 20. Births, marriages, and wages were measured as the resi- duals from a regression of the lag of the basic series on time.
  • 24. 539 Perspective on Economic Aspects of the Population Explosion they are very narrow, typically about ±0.3 radians. The estimates of 02(A) can here be interpreted as elasticities,13 suggesting a value of 0.3. I also estimated separate cross spectra for each of the periods 1539- 1638, 1639-1745, and 1746-1839 and found virtually identical results within each subperiod. This establishes the existence of a procyclical response of marital fertility to wages as far back as the sixteenth century, with no noticeable change in the timing or sensitivity of the relationship. The estimated cross spectrum for marriages and wages shows a co- herence-squared very similar to that for fertility. The phase diagram shows that nuptiality responded to wages with no lag at all, in contrast to fertility. The gain-squared estimates show that the elasticity for nup- tiality was on the order of 0.5, or nearly twice as high as that of fertility. Generally, the association was closer and more sensitive for fluctuations of about ten years' periodicity than it was for very short-run fluctuations. To summarize, these results show that as far back as the sixteenth cen- tury, both marital fertility and nuptiality were strongly influenced by short-run variations in the real wage, which explained 20% to 30% of their short-run variance. Without making any judgment on whether the association of marital fertility with wage variations was due to voluntary limitation of fertility, these results provide some support for the existence of an aggregate relation between general fertility and wages.14 The Positive Check While the role of exogenous mortality decline in the current LDCs' rapid population growth is widely acknowledged, it is less well known that large exogenous changes in mortality occurred in the past, leading to major population swings in Europe from the thirteenth through the eighteenth centuries. And I refer not to catastrophic mortality associated with periodic harvest failure or epidemic, but rather to long-run changes persisting for decades or centuries. The causes of these shifts are ob- scure; they may have been climatic, or the by-product of independent epidemiological and ecological changes, or the result of voyages of ex- ploration. But that these changes occurred is clear; their magnitude is suggested by the life expectancy series for upper-class Englishmen shown in figure 9.1. Other confirming evidence is found both for Eng- land and for the Continent in reconstitution studies based on parish registers, in data from religious orders and the professions, and in the analysis of wills and death taxes. The exogeneity of the changes is clear from their temporal relation to changes in wages and population size, and from their disregard for class distinctions (see Chambers 1972; Lee 1973, 1978a and 1978b). I do not mean to suggest that mortality was completely independent of income; but the importance of this endogenous component has been greatly exaggerated. The extent to which mortality was associated with
  • 25. 540 Ronald Demos Lee wages in the short-run can be studied with the Cambridge Group's par- ish data; figure 9.7 shows the relevant cross-spectral estimates. The coherence-squared indicates that only about 10% of the variance is explained, less than half the amount explained for nuptiality and marital fertility. The phase diagram is somewhat erratic but suggests that mor- tality and wages were negatively related, with mortality lagging by from zero to one year. The squared gain, not shown here, suggests an elas- ticity of about -0.5. (For an analysis of wages and mortality by cause of death in sixteenth- and seventeenth-century London, see Mirowski 1976.) I have also analyzed the relation of wages to the rate of natural in- crease; these results are also shown in figure 9.7. The coherence-squared averages about 0.15, with a very small lag of growth behind wages. The elasticity is not a useful measure of sensitivity in this case. It is more helpful to note that a doubling of the real wage would increase the pop- ulation growth rate by about 1.25% per year, ceteris paribus. Direct Links of Fertility to Mortality I have so far discussed the relations of fertility and mortality to wages. Now I will briefly consider the possibility that there were direct links of fertility to mortality, such that fertility would adjust to changes in mor- tality. Several such links have been suggested in the literature. One is that, through inheritance, high mortality resulted in the transfer of assets to the nubile, thus increasing nuptiality, then fertility (Ohlin 1961). The cross spectrum of marriages and deaths lends some support to this hy- pothesis. However, it is only the redistributive effect that should be counted here; changes in the population/wealth ratio are an indirect influence of mortality on fertility, already reflected in the wage rate. Another suggested link is that couples may have attempted to replace unexpected infant and child deaths and that, when mortality changed, they would eventually revise their mortality expectations and adjust their fertility accordingly. This argument requires the assumption that couples controlled their fertility and strove for some number of surviving chil- dren, in contrast to the natural-fertility hypothesis. Knodel (1975) has shown that this "replacement hypothesis" is false for a sample of pre- industrial European parish populations. My own studies of the short-run relation of fertility to mortality show a very strong negative relation. Perhaps the most convincing evidence that fertility did not strongly compensate for mortality changes even over the long run is given by figure 9.5, which shows a very close correlation of mortality and popu- lation growth rates over a period of 175 years. To sum up section 9.3, I have shown that, at least in the short-run, there was an endogenous component to population change, operating through nuptiality, marital fertility, and mortality. Presumably these
  • 26. 541 Perspective on Economic Aspects of the Population Explosion Deaths by Wages Rate of Natural Increase by Wages 2 o PPGMZZMRGZZMPセQolMMMjVMNWMNNNャNTMMZSNNNャNN 3-'-2.-5--'2 .6 セッ Lag -- Mセ ----f'Yr. Lag °00'-=2'::0-,''::O--::6'-::.7:-....I 4 :---:: 3 ,-'.3::---:'-2--=.5-...=-::.o.J. 2 4 6 .6 :::s <b U .4 u c"o セ e Q) '" .c ::J o cs UVl Nセ -0. セ.c _ Vl セ セ -6 2 .c '" clセ Wavelength. i,. In Years Wavelength. 2. In Years Fig. 9.7 Cross-spectral estimates of deaths and rate of natural in- crease in relation to real wages for England, 1539-1839. Phase estimates indicated by solid circles correspond to sig- nificant estimates of coherence-squared and are more ac- curate than the others. Estimates were made using a Parzen window with T = 301, M = 20. Deaths and wages were measured as residuals from the regression of the log of the basic series on time. Natural increase was used untransformed. short-run relations also held over the long run, although these data provide no evidence on this point. Even in the short run, however, wages account for only about 15 % of the variance in growth rates, so that most of the variation is exogenous. Furthermore, inspection of long-run life-expectancy series, as in figures 9.1 and 9.4, suggests that long-run variation in population growth rates was also dominated by exogenous variation. Under these circumstances, over the very long run, the average wage level will be an important determinant of average population growth rates. But even over the course of centuries, fluctuations of growth rates about that average level may be largely exogenous. 9.4 A Model of Economic-Demographic Equilibrium At this point it will be helpful to introduce a simple equilibrating model relating fertility, mortality, wages, and population. Rent and terms of trade could also be added, but they play an essentially passive role and would only clutter the diagram. The relation of fertility and mortality to wages, measured by their crude rates band d, may be plotted as in the top half of figure 9.8. The
  • 27. 542 Ronald Demos Lee Wage (w) ----d(w) セ :!l Ui c Q <0 :; N· a. 0 ll. b(w) w(N) Fig. 9.8 Wage (w) Economic-demographic equilibrium. level and curvature of the birthrate curve are determined primarily by norms and institutions, although at very low wages biological consider- ations may become important. Some societies might have horizontal fertility curves, if neither nuptiality nor marital fertility depended on material well-being. Societies with institutional arrangements conducive to high fertility, such as the extended family system, would have higher birthrate curves than those with less pronatalist institutions, such as the nuclear family. The death-rate curve is primarily biologically deter- mined, although such additional factors as income distribution, central- ized famine precautions, and in some cases infanticide and geronticide are also important. The population growth rate, equal to b - d, is given by the difference between the two schedules; where they intersect, the growth rate is zero and the population is stationary. The corresponding wage, w*, is vari- ously known as the "long-run equilibrium wage," the "natural wage," the "conventional standard of living," or "subsistence." The lower half of the diagram shows the relation between the wage rate and the size of the population; it corresponds to the demand for labor, which I assume is fixed. Corresponding to the equilibrium wage is an equilibrium size of population, N*. There will also be equilibrium levels of rent and terms of trade, which are not shown. Evidently the
  • 28. 543 Perspective on Economic Aspects of the Population Explosion equilibrium is stable; when population size is below N* its growth rate will be positive, and conversely. Now consider the effect of a once-for-all shift in the demand for labor; this situation is shown in figure 9.9. When w(N) shifts out to WI (N), the wage will initially rise, inducing population growth until population attains its new equilibrium at the old wage level. Thus, over the long run, population responds passively to economic advance, while a roughly constant level of material well-being is maintained; this is the "iron law of wages." Now consider the effect of a permanent exogenous decline in mortal- ity, shifting the schedule from d (w) to d1 (w). This is shown in figure 9.10.15 The decline in mortality lowers the equilibrium wage and popu- lation size; growth rates are initially positive until a new equilibrium is established with lower fertility and wages and larger population size. The point to note is that the equilibrium wage is not a culturally deter- mined parameter, as the classical economists thought; it depends also on a level of mortality that was subject to autonomous long-run change. It is this that gives population an independent role in history: within broad limits, the equilibrium population and living standard changed when mortality changed, even if institutions and the economic base of society remained completely unaltered. <l> ;;; a: .<:: ;;; <l> 0 u b(w) c '" <l> セ d(w) 'E to <l> U ::l U w· Wage (w) wl(N) w(N) Fig. 9.9 Increased demand for labor. Wage (w)
  • 29. 544 Ronald Demos Lee b(w) ----d(w) ----d,(w) Wage (w) w(N) I I I I セ i セ I Cf) I 6 I セ Ni ------- セ N' ---------- a a.. Wage (w) Fig. 9.10 Exogenous mortality decline. I have simplified here by ignoring the direct links of fertility to mor- tality; these would cause the fertility curve to shift in response to shifts in the mortality curve. However, such direct links were ver¥ weak (see Lee 1973, p. 598; 1978a, p. 167). Therefore it was only through long- run change in the norms and institutions themselves that society could maintain constant population and wages in the face of exogenous change in mortality. The automatic homeostatic mechanisms were not adequate in these circumstances. In earlier papers (Lee, 1973, 1978a, b) I used estimated forms of this model to simulate the course of wages, population, and fertility, assum- ing that only mortality varied exogenously. These simulations fit the historical data remarkably well for 1250 to 1700 and 1705 to 1784. The diagram can also be used to illustrate the effect of a steady rate of shift of the demand for labor, of the sort included in the equations estimated earlier. Suppose that this rate of shift is such that population growth at rate r leaves wages unchanged; the estimates suggested r = 0.4% per year. Then in steady state growth, population will grow at rate r, and the wage will be constant at a level such that b(w) - d(w) = r. This situation is shown in figure 9.11. Evidently the wage will have to be a bit above its "natural" level in order to induce growth. Exoge- nous change in mortality will alter the steady-state wage but will only temporarily affect the population's growth rate.
  • 30. d(w) b(w) 545 Perspective on Economic Aspects of the Population Explosion Finally, consider a simultaneous decline in mortality and initiation of growth at rate r in the demand for labor. This situation is shown in figure 9.12. In this case we might observe constant fertility, low mortal- ity, and population growth with no diminution in wages. This is the situ- ation T. H. Marshall had in mind when he wrote of eighteenth-century England (1965, p. 248) : The obvious temptation is to assert that the death rate was not only the variable, but also the determining, factor in the increase of popu- lation, and that, to understand the causes of this increase, we should study the deaths rather than the births. But, clearly, a horizontal line on a graph may be as dynamic as a diagonal; the forces that prevent a birth rate from falling may be as significant as those that make it rise. Ordinarily, one would expect a fall in the death rate to be followed by a fall in fertility, as equilibrium is attained at a lower rate and larger population; if this does not happen, it suggests that the underlying cause of continuing population growth is economic progress, not the mortality decline. Might this be similar to the situation in today's LDCs? We often observe exogenously declining mortality, relatively constant fertility and per capita income, and rapid population growth. Without the concurrent '" 10 a: t;:Q) z セ Vi c o 1i5 "3 0. o c- al c ::> o u V> 6 Wage (w) Fig. 9.11 Labor demand increasing at a constant rate.
  • 31. 546 Ronald Demos Lee b(w) セMMM、HキI セMMMM、ャHwI Wage(w) ,.Q) Z a) N Vi C o ';::; m :; c- o c.. al c ::> o u '" (5 Wage(w) Fig. 9.12 Offsetting changes in growth of labor demand and mortality. economic development, surely by now incomes and fertility would have fallen and mortality risen. It is not quite right to attribute the population growth to the mortality decline, although this may be the most conspicu- ous exogenous change; growth in the capacities of these economies to sustain population should perhaps be accorded the major responsibility. A final comment on this model in relation to the LDCs is in order. Whatever the nature of the social mechanisms that may have regulated population in Asia, it is clear that a balance was reached at a much higher level of fertility and mortality than in Europe. Apparently life expectancy in China and India at the turn of this century was about 23 years (see Barclay et ai. 1976; Das Gupta 1971), versus perhaps 30 years in Europe; the total fertility rate must consequently have been about 6.5 versus 4.5 in Europe. The necessary change in fertility-regu- lating institutions, in response to declining mortality, is staggering. 9.5 Summary and Conclusions For today's LDCs there is little empirical evidence on the economic effects of population change. For the economy of preindustrial England and perhaps Europe, on the other hand, population emerges clearly as the dominant cause of long-run change in wages, rents, industrial prices, and income distribution. The economy could absorb population growth
  • 32. 547 Perspective on Economic Aspects of the Population Explosion at about 0.4% per year with little effect; deviations of population size above or below this trend line, however, had dramatic consequences. And perhaps more striking than the existence of these effects is the ex- treme sensitivity of the economy's reaction: reckoning in terms of agri- cultural goods, a 10% increase in population depressed wages by 22%; raised rents by 19%; lowered industrial prices relative to agricultural prices by 17%; raised the ratio of industrial to agricultural production by 13%; and lowered labor's share of national income by 14%. This sensitivity of response poses the principal puzzle to emerge from this research. My attempt to account for these large (in absolute value) elasticities by means of a very low elasticity of substitution of labor for land is not altogether convincing without corroborating evidence. In this study I looked for negative consequences of population growth, and I found them. However, I made no effort to analyze such positive effects as the stimulation of agricultural investment or of technical change, the role of rising domestic demand for basic industrial com- modities, or industrial wage rates held down by population growth and sharply diminishing returns in agriculture.16 Nor can these possible posi- tive effects be brushed aside as merely partially offsetting reactions to dominant adverse effects; if they in any way brought on the industrial revolution, then their net effect was overwhelmingly positive. But surely the links of today's LDCs with the world economy greatly reduce the advantages of scale, home demand, and home-produced technology. Perhaps after all it is the centuries before the industrial revolution that are most relevant for the LDCs, when population growth did have strong and predictable effects, beneficial for some social classes and damaging for others. In any event, a more balanced treatment of these issues would require a second paper. Now let me turn to the causes of population change. There is a notion that social mechanisms cause population to grow and decline in response to changes in productive capacity, in such a way as to keep incomes close to a culturally defined standard of well-being. And some who reject this model as descriptive of the present still believe it is appro- priate for the past. In fact it is a poor description of both. In preindus- trial Europe, as far back as records will take us, population swings were largely autonomous, not a response to economic variation. Their active determinant was mortality, which then as now experienced large exoge- nous variation. Our current experience is not unique in this respect, and, indeed, though the present decline in mortality has been much greater and more sudden than those of the past, its effects on welfare have so far been much less. On the other hand, it would be a mistake to ignore the institutional mechanisms of population control that existed in preindustrial times. The point is not that they were absent, but that the equilibriums to
  • 33. 548 Ronald Demos Lee which they steered society were largely accidental, resulting as they did from the interaction of cultural control with independent mortality. And while mortality largely determined the equilibrium and actual standard of living, it was the social mechanisms that produced sustained popula- tion growth in response to economic progress. In short, the social protection of living standards through population regulation has always been vulnerable to mortality change, and it would be folly to expect longstanding demographic adjustment mechanisms to prevent population growth from forcing material welfare below some conventional standard in today's LDCs. It is only in the very long run, over which the institutional mecha- nisms are themselves variable, that such automaticity can be expected, and the European experience suggests that even centuries may not suf- fice. Appendix 1. Data Used in Figure 9.1 and Section 9.2 A. Life Expectancy For 1250-1450, estimates are based on J. C. Russell's (1958) life tables that refer to the mortality experience of a predominantly upper- class, geographically dispersed group of English males holding property granted by the king. Some errors in the original tables were corrected; the infant mortality rates in the tables were revised; and estimates were converted from a cohort to a period basis. These estimates appear con- sistent with scattered evidence for other social classes. For details on all this, see Lee (1978b, appendix 4). For 1550 to 1725, the estimates are based on Hollingsworth's study of the British peerage (1964). These estimates refer to the mortality of male peers. I have converted them from a cohort to a period basis. Extensive comparisons suggest that these estimates accurately reflect relative changes in the mortality of other social groups through 1725. For details, see Lee (1978b, appendix 2). Between 1450 and 1550, life expectancy estimates are not available. B. Population Size From 1250 to 1540, the dotted line indicates rough estimates of pop- ulation size, based principally on Russell's work (1948); for details see Lee (1978b, appendix 1). The remaining population estimates for 1540 to 1800 are based on a preliminary version of the Cambridge Group's aggregate parish register
  • 34. 549 Perspective on Economic Aspects of the Population Explosion series. These series, generously made available to me by E. A. Wrigley and Roger Schofield, give the annual number of baptisms and burials for a nonrandom sample of 404 English parishes, covering about 6 or 7% of the total population. Various adjustments were made to correct for gaps, underregistration, and the entry and departure of parishes to and from the sample. Using a variety of methods, population size for the sample was estimated to be roughly 230,000 at the beginning of the period. Annual population estimates were formed by cumulating the dif- ference between adjusted baptisms and burials, resulting in a population size of 1,055,000 for 1840. This implies a 4.6-fold increase over the three centuries, agreeing well with estimates from other sources. Esti- mates for the sample were inflated to the national scale using a ratio calculated for the end of the period when national population data are available. These estimates are preliminary. Figure 9.1 shows population size at five-year intervals, for 1540, 1545, ... , 1800. C. Real Wage (w) The numerator (W) of the real wage series is taken from Phelps- Brown and Hopkins (1955), with some interpolation, for 1261 through 1700. It is the wage for building craftsmen. Thereafter, it is taken from Deane and Cole (1969, p. 19) and represents a population-weighted average of regions. A splicing ratio was derived from the overlap. The figure for 1790-99 was again taken from Phelps-Brown and Hppkins (1955). , 1 For 1261-1400, the deflator of the real wage series is the PHelgs- Brown and Hopkins (1956) cost of a composite basket of consumables including both agricultural and industrial commodities. For 1401 to 1800, the deflator is an agricultural price index (PA ). It is taken from Phelps-Brown and Hopkins (1957), through 1700. From 1701 to 1760 it is based on the Phelps-Brown and Hopkins grain index as reported in A. H. John (1967, p. 191), using the overlap 1671-1700 to derive a splicing ratio. For 1761-1800, a wheat price index from Deane and Cole (1969, p. 91), is used, with splicing ratio based on 1641-70. D. Terms of Trade (PFlPA ) The denominator, PA , is exactly as described above in section C. The numerator, PI, is taken from Phelps-Brown and Hopkins (1957) through 1700; thereafter the series is based on the average of the Schumpeter- Gilboy producers' goods index and consumers' goods other-than-cereals index, as reported in Deane and Cole (1969, p. 91). Because this aver- age gives animal products a weight of 1/11, I assumed animal products were similar to wheat and subtracted 1/1 1 of the wheat price series from
  • 35. 550 Ronald Demos Lee it. The splicing ratio was calculated from the Gilboy-Schumpeter index for 1680-1710, as reported in Mitchell and Deane (1962, p. 468). The price ratio, P, was calculated as p = 100(PIiPA ). E. RentlWage Ratio (Rlw) The nominal rent index (RPA ) is taken from Kerridge (1953) and is an average of the two series for the Herbert estates (with weight 114 each) and the Seymour estate (with weight 1/2). The ratio Rlw is cal- culated as RPAIW times 100. Appendix 2. Formal Development of the Two-Sector Model This appendix sets out the assumptions of the model explicitly and de- velops a number of results that are used in the main body of the paper. The development presented here owes much to Marc Nerlove, particu- larly the material in section C. In what follows, agricultural output is the numeraire. A. Assumptions (AI) A = !'-O(IL1F-(3 + (1 - ILl )N.{-Il) -l/ll. Agricultural production follows a constant return to scale, constant elasticity of substitution production function, with inputs of labor and land-plus-other factors. (A2) Nonagricultural production follows a fixed-coefficients production function with inputs of labor and agricultural output; units of mea- sure for labor and agricultural output are chosen so that the produc- tion coefficients are unity. (A3) WI = W.l = W. Wages are equal in the two sectors. (A4) w = (jAlaN..l. The wage in agriculture is competitively determined. (AS) The price of industrial output equals its cost of production. (A6)
  • 36. 551 Perspective on Economic Aspects of the Population Explosion There is full employment (or employment of a constant proportion of the working-age population). (A7) pI = '(A -I) or, equivalently, (A -1)/ (A -I+pl) = 1/(1 +'). The demand for nonagricultural output is such that net agricultural output is a constant proportion of total net output, valued at current prices. B. Derivation of the Sectoral Allocation of Labor Let YA be labor's proportional share of agricultural product; by (A4) this equals EA,NA X NA can be expressed as: (A8) From equation A2 it follows that I = NI, and combining this with equation A7 and solving for N] yields: (A9) N] = AA/(p + '). From equations A8, A9, and A6 it follows that: (AIO) NA/N = YA/[YA + ,w/(p +,)], which gives agricultural employment as a proportion of the total labor force. C. The Effect of Population Growth on the Sectoral Allocation of Labor The goal here is to derive an explicit expression for the elasticity of N A with respect to N, From equations A6 and A9 it follows that: (All) NA=N-AA/(p+,). (AI2) (A13) Differentiating with respect to N gives: oNA _ 1 _ oNA IoA/oNA _ Aow/oNA1 oN - , oN p+, (p+,)2 . Solving equation A 12 for oNA/oN yields: oNA = 1/ 11 + ,oA/oNA _ AAow/oNA 1. oN p +, (p +,)2 From equation A9: (A14) A!(p +,) = NI!A. Substituting in equation A13 yields:
  • 37. (A1S) (A17) 552 Ronald Demos Lee oNA = II 11 + N/oAloNA _ N/owloN,1 ) . oN A p + It Multiplying by NINA on both sides yields: (A16) E = II セ N A NAN/oAloNA _ NAN/owloNA) NA,N ( N + AN N(p + It) This can be rewritten: N] N] w) EN.4 .N = II {1 - (1 - 1'.1) N - N Ew,NA (p + It) Equation A17 relates two unknown and unobservable elasticities, eセa .N and Ew,NA • Fortunately these same two elasticities are also related by the . identity: (A18) (A20) where Ew,N is directly estimable. Substituting from equation A18 into equation A17 yields: (A19) l N[ EIt',N N] w l EN N=11 1-(1-1'.1)------- . A' N ENA ,NN P + It Solving for ENA ,N yields: N/ w i ENA ,N = ( 1 + Ew,N N (p + It) I II-(l - 1'.1) セ I· This last equation permits estimation of ENA ,N from estimable quantities. And it is also true, of course, that: (A2l) D. Estimation of EW,NA and the Elasticity of Substitution in Agriculture Once we have derived the effect of population change on the sectoral allocation of labor, ENA .N, it is simple to find ElV ' NA and (T = I/O + (3). In fact, Ew,N.1 can be calculated directly from equations A20 and A 18. Since the elasticity of substitution equals - (1 - 1'.1) / E" ..,A. ' it is also true that: (A22) Substituting from equation A20, this gives:
  • 38. 553 (A23) or (A24) Perspective on Economic Aspects of the Population Explosion E. Rent and Population From equations Al and A4 it follows that: (A25) This could be estimated in log-linear form, except that NA is not directly observed. However if E Rlw.N is estimated, then ERlw,NA = 1 + f3 = I/O' can be calculated as: (A26) or (A27) F. The Effect of Population on the Ratio of Industrial to Agricultural Output in Real Terms Solving equation A7 for I, and dividing by A, gives: (A28) I/A = AI(>.. + p). Calculation of the elasticity of 1/A with respect to N yields: (A29) ElIA,N = -WEw,N/(P + >..). Inspection shows that this is a positive number; population growth in- creases industrial output more, proportionately, than agricultural output. In fact, since I = Nj, and N[ = N - N.t, the elasticity of I with respect to N is easily shown to be: (A30) Thus, to a first approximation, industrial output increases in proportion to population; more accurately, it increases more than proportionately when EN{ ,N is less than one.
  • 39. 554 Ronald Demos Lee G. Population and Terms of Trade Since p = 1 + w, it is easily shown that: (A31 ) where 'Y1 is w/ (1 + w), the share of labor in the cost of industrial pro- duction. H. Population and Income Distribution In the model, all income accrues either to labor or to "land" (which includes all agricultural nonlabor inputs). Labor's share of output in proportionate terms, denoted S, is therefore: (A32) S = wN/(wN +R) = 1/[1 + R/(wN)]. Dividing numerator and denominator of R/(wN) by A gives (I - 'YA) / ('YAN/NA), so equation A32 can be rewritten: (A33) so that labor's share in all output is greater than it share in agricultural output. Equation A33 can also be used to calculate 'YA, which is unobserved, from Sand N A/N, for which estimates exist. Solving for 'YA yields: (A34) 'YA = (SNA/N)/O - SNIiN). The elasticity of labor's proportionate share with respect to popula- tion size can be calculated from equation A32 as follows: (A35) oS N oNS- -([()(R/w)/oN](l/N) + [o(l/N)/oN](R/w)}N . [1 +R/(wN)]2{1/[1 +R/(wN)']} This simplifies to: (A36) ES•N = -{o(R/w)/oN - R/(wN)} /[1 + R/ (wN)], which further simplifies to: (A37) ES,N = (1 - ER/w,N) (I - S), which is easily evaluated. 1. Nonagricultural Technical Change, Wages, and Labor Force Allocation Suppose equation A2 is altered to: I = min (NIia,A1 ), so that al = N1 and p = aw + 1. Then equation All becomes:
  • 40. (A39) 555 Perspective on Economic Aspects of the Population Explosion (A38) NA = N - aM/Caw + 1 +'). This can be differentiated to find the effect of a change in a on labor force allocation, for constant N. oNA -, oA oNA oa (p+,)2 {(A + oNA OW a)(p+,) (w+ OW oNA ) A} a oNA oa a . After solving for oN.doa and simplifying: (A40) (A4l) 1 + 'aw _ ,a2A ow/oNA ' p + , (p + ,)2 Further simplifying, and expressing as an elasticity, this gives: EN.4 .C< = -1/{pNA/NI - [aw/(l + ,)]EW •NA )- It is also easily shown that ENI.c< = -(NA /NI)EN.4 .c< so that: (A42) And, finally, the effect of changes in a On ware easily assessed, since: (A43) Notes I. He has shown that in a stable population with growth rate r, whose economy has a rate of disembodied technological progress s, and in which savings are less than or equal to profits, the internal rate of return to a marginal birth, viewed as an investment, is less than or equal to r +s. If r is 0.02 and s is 0.01, then dis- counting over a life cycle at a rate above 3% yields a negative present value of a birth. 2. This may in part reflect their methodology. In a single-sector neoclassical growth model, rates of population growth have no effect on steady-state growth rates. Weak negative effects arise in transitional disequilibriums, and strong effects occur in nonneoclassical economies with surplus labor. It might be worth redoing the analysis while distinguishing among these three categories. 3. See, for example, Van Bath (1963); North and Thomas (1973); and Phelps- Brown and Hopkins (1959). Properly put, the argument is that population change accounted for changes in relative prices over the period; some historians, however, go too far and suggest that population growth caused the general 'price inflation of the sixteenth century. For a perceptive review see McCloskey (1972). In a recent paper, Cohen and Weitzman (1975) have suggested that the process of enclosure might also explain these changes; however, they have drastically under- estimated the strength of the demographic data.
  • 41. 556 Ronald Demos Lee 4. For the regression covering the years 1250 to 1700, the Phelps-Brown and Hopkins (1956) real wage series was used, which is money wages deflated by the price of a basket of goods including both agricultural and industrial items. The wage series used for 1705-89 was deflated in a similar manner; it is based on data given in Deane and Cole (1969, p. 19) and takes account of regional differences in wages and population growth rates. 5. In any case, if the economy is viewed as open, then relative prices are deter- mined in large measure exogenously. But until midway through the eighteenth century, Europe accounted for most of England's trade (see Deane and Cole 1969, p. 34), and changes in European factor supplies and factor prices paralleled those in England (see e.g. Phelps-Brown and Hopkins 1959). 6. This view of the English economy, which emphasizes land and labor to the total exclusion of capital, receives some support from estimates of the capital stock in the late seventeenth century. From Gregory King's tabulations, Deane and Cole (1969, p. 270) estimate that 64% of capital was in land, 8% in livestock, 17.5% in buildings, and only 10.5% in transportation, inventories, machines, and the military. The saving rate was 3 to 6%, and savings went to a considerable extent into agriculture. By 1698, the "industrial" category had risen to about 21%, while land had fallen to 55%; but the economy's capital was still largely agricultural (Deane and Cole 1969, p. 271). 7. In 1798, roughly 12% to 16% of the population were "living-in" employees; of these, domestic servants were the largest group. See Mathias (1969, p. 25). In 1801, according to Colquhoun, about 7.5% of the population were personal and household servants. 8. According to Deane and Cole (1969, p. 154-64) the proportional share of agriculture in national income was 40-45% in 1688 and in 1770; by 1801 it had declined to about 32-36%. Pollard and Crossley (1968), put the 1688 figure at 56%, which if correct would change the picture considerably. 9. Mean values are needed for the variables N/N, I'A' Ew,N and w/(p + )1,), all of which are actually endogenous. Based on Gregory King, Deane and Cole (1969, p. 137) estimate that 60 to 80% of the labor force was primarily engaged in agriculture in 1688. Since many of those primarily engaged in agriculture none- theless did nonagricultural work as by-employment or for their own consumption, I will take 65% as the proportion of labor services engaged in agriculture: so N[IN = .35. An estimate of I'A can be derived from an estimate of S, labor's share of total national income, using equation A34. For 1688 Deane and Cole, based on Gregory King, estimate that between 25% and 39% of national income was wages and salaries. However, not included is the labor contribution of farmers and freehold- ers, whose income accounts for about 40% of national income. I will somewhat arbitrarily take S =.55, which implies that I'A =.45. Ew .N has been estimated to be -2.22 in equation 20; w/(p +)1,) should be estimated for the mean amount of labor augmentation. Taking )I, =I (i.e., 50% of final product is in agriculture), and w =3, gives w/(p + )1,) =.6. 10. In transformed terms, w =3 and p =w+I =4. Since agricultural prices are by definition I, the quantity of J consumed must be 114 as large as that of A. Thus w* =wl[e + (eI4)p] =(4Ie)[w/(w + 5)]. From this, EK,N =[5/(5 + w)] Eu;.N =(5/8)Ew ,N evaluated at w =3. I I. See Lee (1971) for a comparison of this series with others for Colyton, a small rural parish, and for "professional men" in England.
  • 42. 557 Perspective on Economic Aspects of the Population Explosion 12. The theoretical cross spectrum is ideally suited to analyze the interactions of two series that are related to one another approximately linearly with known sets of lagged coefficients. as is the case with demographic series. 13. The variables are measured as residuals from the regression of the log of the basic series on time. 14. Many dozens of previous studies of populations, in many social contexts and time periods, have demonstrated this sort of procyclical response, including situa- tions in which the cross-sectional and secular relationship of fertility to income appears to be negative. Therefore this cross-spectral evidence is weak support at best for the existence of a long-run positive aggregate relation of fertility and income. 15. For diagrammatic simplicity. I have assumed that fertility is completely independent of mortality. so that hew) remains unchanged. The results are not qualitatively different so long as compensation is less than perfect. 16. These positive effects of population growth have been stressed by Boserup (1965) and others and have been modeled and simulated in a recent article by Simon (1976). Comment Nathan Keyfitz Is population growth the cause or the result of economic change? Ron- ald Lee tackles nothing smaller than this central problem of demography. The answer he provides is limited in space and time, but his analysis is nonetheless a tour de force combining economic time series, parish records, and simple models. Everyone wants to endogenize population in his economic model, but there are doubts whether the real world is made in a way that permits this. Adam Smith seemed to do it: for him the production of people responded to the demand, just like the supply of shoes. For Malthus the number of people the landscape could support was limited just like the number of animals that could be sustained on a given food supply. Though they did not use the expression, Smith and Malthus in their dif- ferent ways both saw a negative feedback by which the family received signals either from the larger society or from the environment, and so family behavior could never be destabilizing. Neither view is wholly inapplicable-places and times can be found to illustrate both. So can places and times be found in which they do not apply. The Kung Bushmen, with densities of about one person per two square miles, do not seem to produce people up to either the economic or the biological limit. They avoid any sense of population pressure, keeping their numbers below the physiological maximum-by what means and under what motivation no one seems to know. Nathan Keyfitz is professor of sociology at Harvard University.
  • 43. 558 Ronald Demos Lee Thus population in some places goes up either with capital (Smith) or with land (Malthus); among the Kung and elsewhere it stays well below the limits set by either. To make matters more difficult, the dom- inant tendency in most industrial societies has been for the birthrate to go down with the increase of income, a social mobility effect that over- comes the Smith and Malthus effects. The would-be endogenizer does not even know whether to insert in his model a positive, zero, or negative relation of population to income, let alone how strong to make that relation. Lee's empirical finding that in preindustrial Europe income does not affect population accords with the theoretical ambiguity. However, in the other direction there does appear to be clear causation both theo- retically and empirically. The result that when population rose by 10%, as it could easily do in a period of low mortality, wages went down by 15%, is surprising and important. The two-sector model is simple and convincing. My only wish is that he could reassure us more about the quality of the wage and other data to which it was fitted. What is implicit in Lee's paper, as in other work, is two systems: the small system of the family and the large system of the population, whether it be parish, county, nation, or world. Each of the two systems has its own laws and variables, and the two sets of variables mesh differ- ently in different circumstances. This paper tells us something important about both the small and the large systems as well as about the relation between them in preindustrial England. It considers Smith's device for linking the two through the birthrate: with more capital and hence more jobs, young people will be able to marry earlier and so will have children sooner. Lee shows that the num- ber of children within marriage did vary with jobs, a feature Smith did not recognize. But this and marriage seem to have been less important than the exogenously caused fluctuations in the death rates whose action is the main feature of the paper. Lee mentions at the beginning of his paper the belief that in modern times the old regulatory mechanisms have broken down under the influ- ences of mortality decline, urbanization, technical change, and modern- ization in general. He speaks of the finite world of preindustrial England with limits not yet rendered flexible by technology, and of how ancient regulatory mechanisms fail to operate in the twentieth century. But then at the end of the paper he transfers his major result from preindustrial England to the present LDCs. I am more convinced by his initial reser- vation than by his later transfer. For various reasons it seems unlikely that the currently developing countries will duplicate Europe's early experience. The most conspicuous difference is in the rapid urbanization of the LDCs. In past centuries when remnants of feudal class respect were
  • 44. 559 Perspective on Economic Aspects of the Population Explosion still controlling, communication was slow, and most of the population worked on the land, fluctuations of income were accepted even when they brought part of the population below the starvation line. In the 1970s, with huge migration to the cities-Cairo, Calcutta, Mexico City each have as many people as the whole of England and ten times as many as London-surplus population has a social and political visibil- ity that daily reminds the elite of the importance of birth control. Each day's newspapers tell us about a turnaround or accentuation of birth- control policy in one or another country, conspicuously in certain coun- tries where urbanization is most rapid. But this does not say anything about the smaller system-it refers only to the policy of the larger society. Does the turnaround that is occurring in elite views tell us what will happen within the smaller system of the family? How can the elite control the family-building practices of their masses? Certainly they cannot do so directly or imme- diately. By the 1990s we should have a clear idea of the manner and degree in which currently visible economic and political forces of the larger society will penetrate the family. Sooner or later they will; it is the timing that is important. How much will the current fall in mortality and rapid population growth affect wages in the LDCs? One has trouble seeing how such a question can be answered by analysis of the forces operating in preindustrial England. But this doubt about generalizing to the late twentieth century in no way lessens my admiration of Lee's historical work. His choice of models is judicious, and the method will be exemplary for others who use time series and parish registers to answer real questions. Comment Marc Nerlove In 1973 Lee published a paper entitled "Population in Preindustrial England: An Econometric Analysis," based on his 1971 dissertation.1 In that paper Lee presented a model relating crude birthrates and death rates, population size, and the real wage rate that is the same in all essentials as that underlying figures 9.7, 9.8, 9.9 and 9.10 in the present paper. In the model of economic demographic equilibrium, real wages and population sizes are inversely related, whereas fertility, as measured by the crude birthrate, is positively related and mortality, as measured by the crude death rate, is' negatively related to real wages. Population size is simply connected with the crude birthrate and death rate by the identity Marc Nerlove is associated with Northwestern University.
  • 45. 560 Ronald Demos Lee (1) dP d/P=b-d, where P is population size and band d are the crude birthrate and death rate, respectively. Lee estimated the basic relationships of his model using fifty-year averages of population size (aggregate data from Wrigley and Russell), a wage index (from Phelps-Brown and Hopkins) deflated by an index of prices for both agricultural and nonagricultural commodities, and life expectancies at birth for the peerage (from Russell and Hollingsworth). Assuming a stable population, Lee was able to derive estimates of the crude birthrate and death rate from the growth of population over time. The basic equations of the model-real wages as a function of popula- tion size, and crude birthrate and death rate as functions of the real wage rate-were estimated for the period 1250-1700 using both ordi- nary least squares and two-stage least squares, assuming mortality to be exogenous.2 Indeed, the simple correlation between mortality and the real wage turns out to be positive in this period, a result that can be attributed almost entirely to the simultaneity of the system Lee con- siders. It is also possible to estimate many of the basic parameters of the system without using the wage data at all, or without using the popula- tion or fertility data but only the crude death rates related to the life- expectancy data, by exploiting the overidentification of Lee's system. These estimates provide tests of the overidentification of the system and its consistency with the data, unreliable as these may be. On the basis of his 1973 analysis, Lee concluded that "long-run changes in the real wage are adequately accounted for by changes in population size" and that "there were no dramatic shifts in the demand for labor over this period.... The relationship between population and the real wage was stable until the beginning of the eighteenth century, at which time it began to change markedly.... The great swings in popu- lation during this period were due to swings in mortality." These latter were largely exogenous according to Lee (1973, pp. 604-5). Lee found a "highly variable equilibrium wage in conjunction with a relatively constant demand for labor" (1973, p. 606). It is worth stressing two aspects of Lee's earlier paper in conjunction with the one presented at this conference. First, "The end point, 1700 [of the period analyzed], was chosen because the relation between wages and population size began to shift unmistakably after this, and because the mortality of the aristocracy, from which we have derived our esti- mates, was no longer representative of that of the general population" (Lee 1973, p. 583). Second, the interpretation of the wage-population relationship, in terms of a one-sector model with a Cobb-Douglas pro- duction function, is a key element in assessing the adequacy of this
  • 46. 561 Perspective on Economic Aspects of the Population Explosion central relationship of the economic-demographic model. Lee's difficul- ties in this connection have led to an extensive investigation, in the present paper, of a two-sector model with a CES production function for agriculture and fixed-coefficients technology for the nonagricultural sector. This two-sector model was discussed in detail at the conference in an appendix to these comments. That material, however, has been largely incorporated in Lee's Appendix 2 and is therefore omitted here. The paper under discussion contains four important innovations: 1. Lee utilizes greatly superior population data derived from the sample of 404 parish registers collected by the Cambridge Group for the History of Population and Social Structure, spanning the period 1538-1840. For some analyses Lee has used decadal averages, for others the annual data themselves, and the latter are clearly essential to the cross-spectral statistical analyses he carries out in section 9.3.2. 2. This paper focuses on a later period, 1530-1800 (sometimes 1839) for which the clearly superior data are available. Use of better data is certainly desirable, but, especially in view of Lee's earlier cau- tionary statement concerning the noncomparability of the period after 1700 with the period before, combining data for the period after indus- trialization had clearly gotten under way with prior data may raise some serious questions about the stability of the relationships estimated. To some degree Lee tries to handle this problem in his regression (eq. 3), but he succeeds only in capturing an acceleration of the trend in real wages after 1809 and does not detect a significant shift in the two sub- periods 1639-1745 and 1746-1839. However, this analysis should be reworked using real wage data more appropriate to the two-sector model (deflating money wages by agricultural prices alone rather than"an index of both agricultural and industrial prices). The regression result reported in equation 20 uses data from 1540 only to 1800 and omits a variable designed to detect acceleration of the trend in the demand for labor after the Napoleonic wars and is thus not so directly comparable. Using the older set of data, Lee reports a significant shift of the wage- population relation between 1250-1700 and 1705-89 in the form of a fivefold increase in the rate of exponential trend. 3. A central, and most attractive, feature of the present paper is its attempt to interpret the real wage-population relation within the frame- work of a two-sector model that assumes CES technology in the agricul- tural sector and fixed coefficients in the nonagricultural sector. Despite several limitations, this new model allows a much richer set of tests for consistency of the relationship between real wages and population im- portant in Lee's later analysis of economic-demographic interactions. The two-sector model and its implications are described in detail in Appendix 2 to Lee's paper.