Download to read offline


![77
Submitted to
Gujarat Technological University
IN PARTIAL FULFILLMENT OF THE
REQUIREMENT OF THE AWARD FOR THE DEGREE OF
MASTER OF BUSINESS ADMINISTRATION
UNDER THE GUIDANCE OF
Faculty Guide
Ass.Prof. SULABH NARAYAN
Submitted by
Barot Vandana - Enrollment No:-117550592127
Barot Vidhi - Enrollment No:-117550592128
Rami Nikita - Enrollment No:-117550592129
Darji Neel M. - Enrollment No:-117550592130
Prajapati Kinjal - Enrollment No:-117550592131
Vohra Amin - Enrollment No:-117550592132
[Batch: 2011-13,]
MBA SEMESTER IV
SARDAR PATEL EDUCATION CAMPUS
MBA PROGRAMME
Affiliated to Gujarat Technological University, Ahmedabad.
April, 2013](https://image.slidesharecdn.com/aglobalcountrystudyandreport-230807175540-926289e0/85/A-GLOBAL-COUNTRY-STUDY-AND-REPORT-pdf-77-320.jpg)


![103
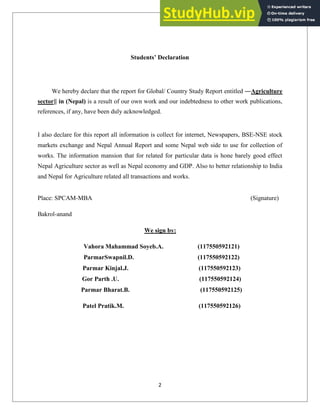
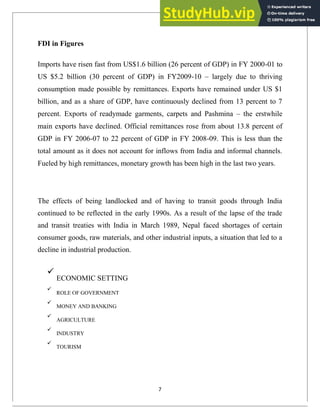
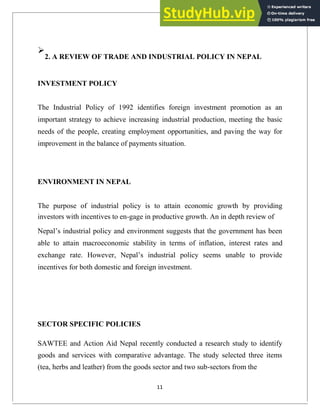
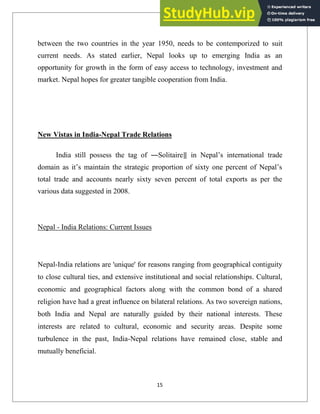
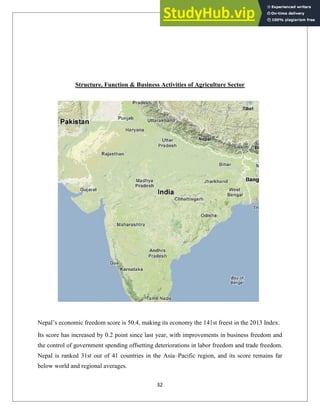
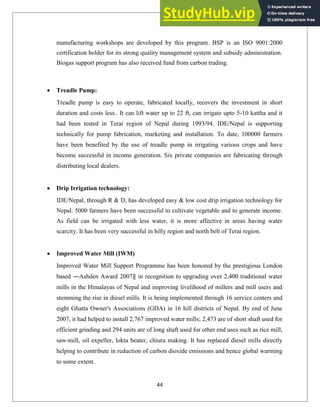
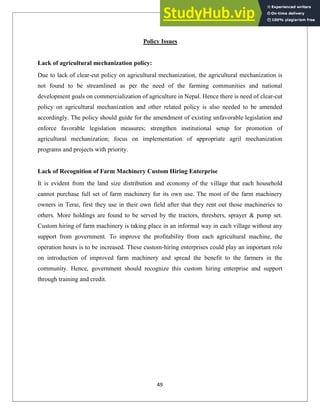
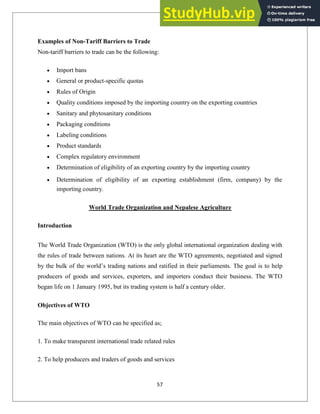
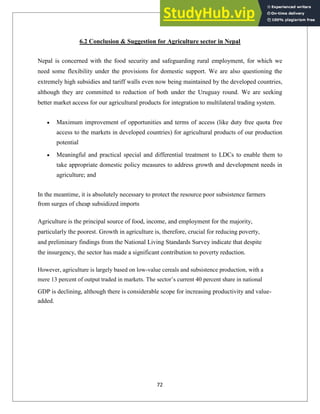
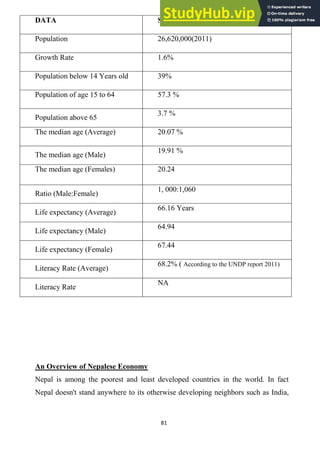
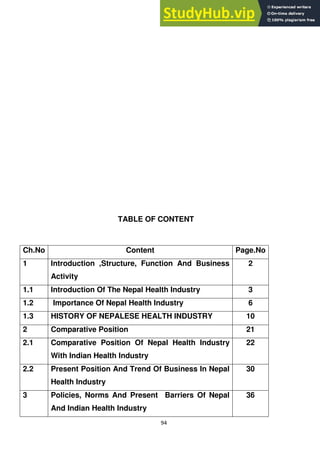
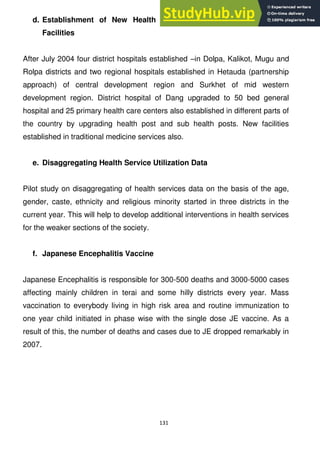
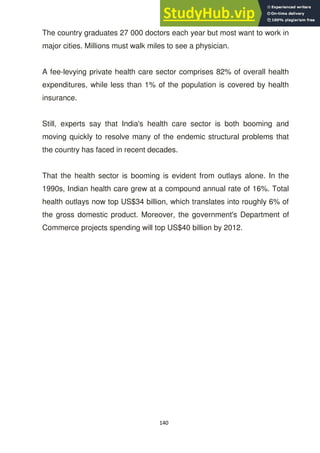
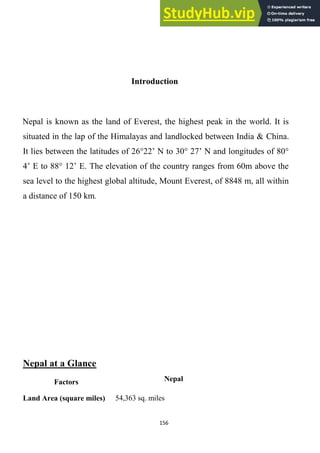
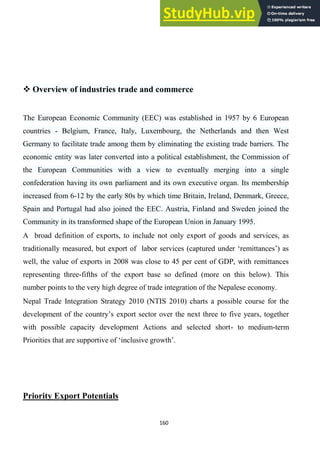
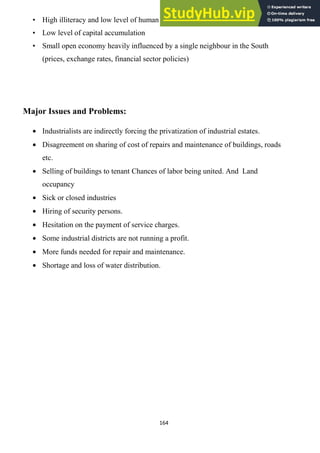
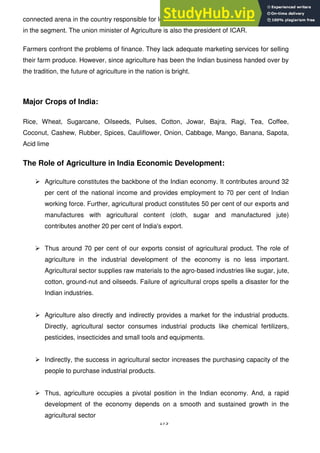
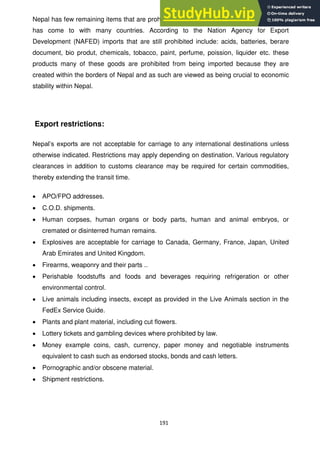
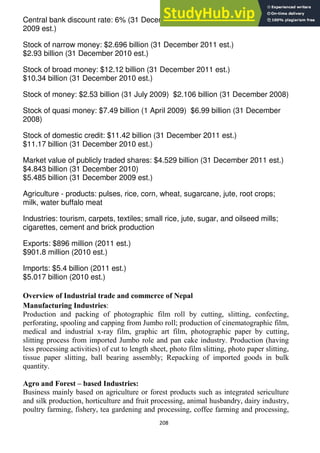
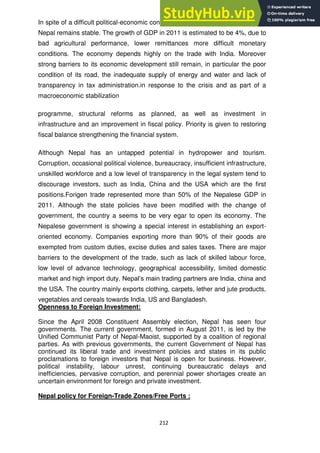
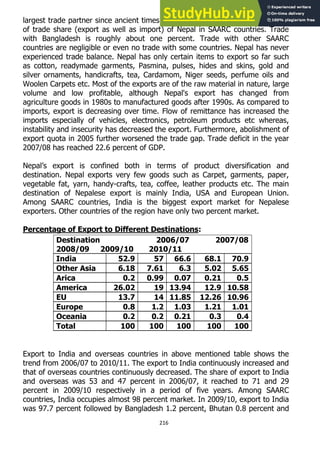
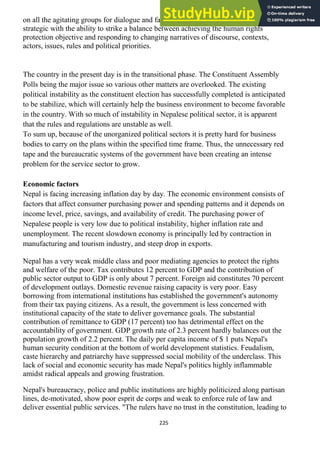
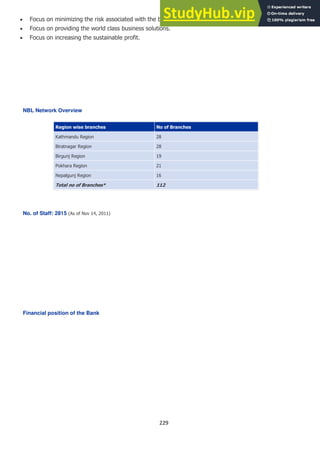
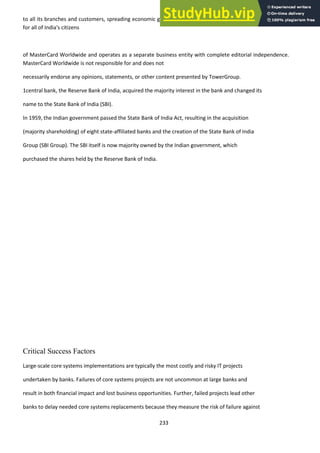
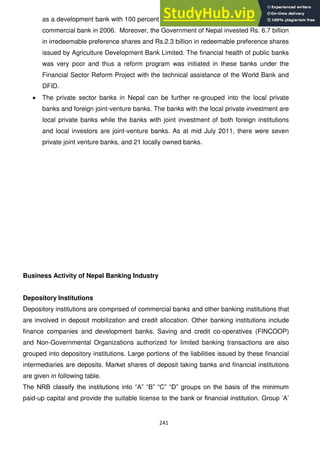
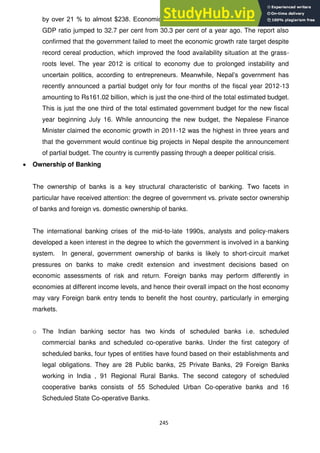
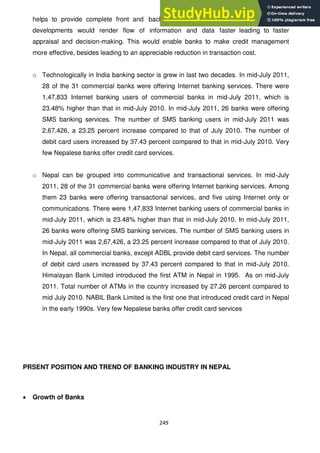
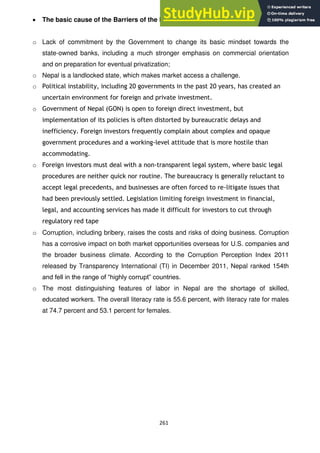
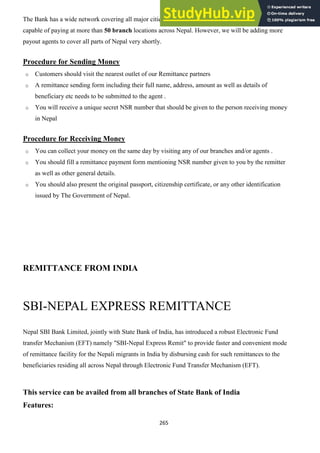
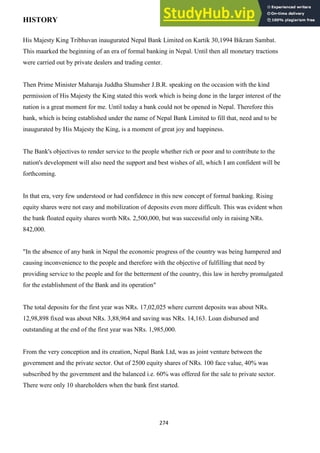
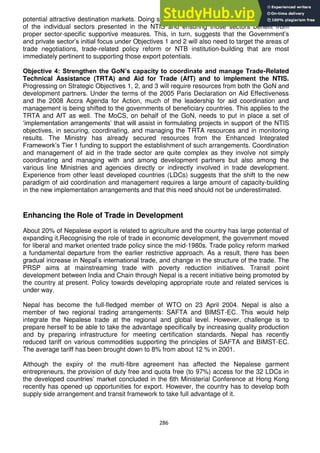
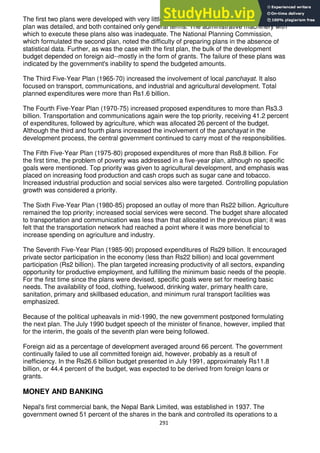
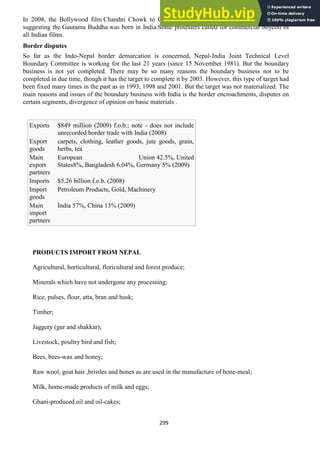
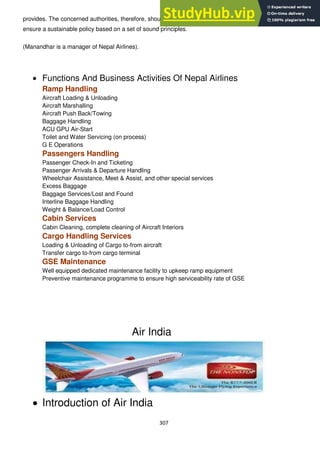
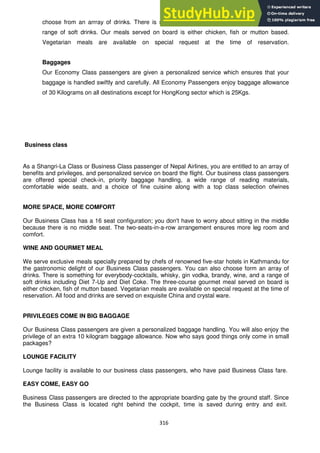
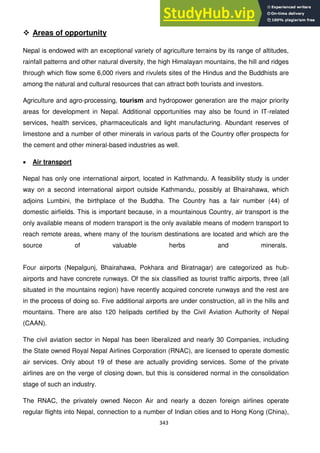
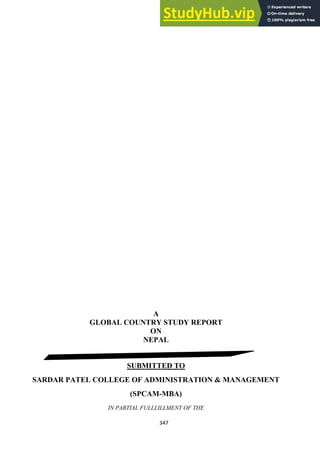
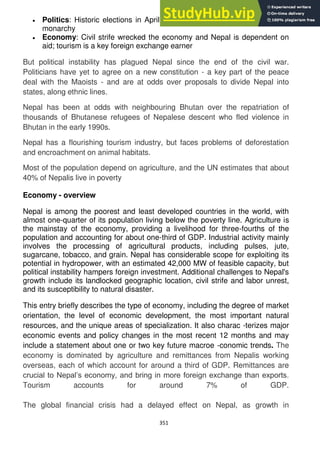
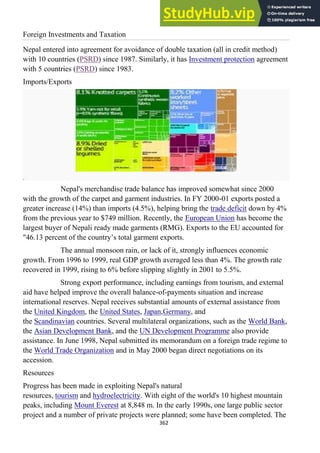
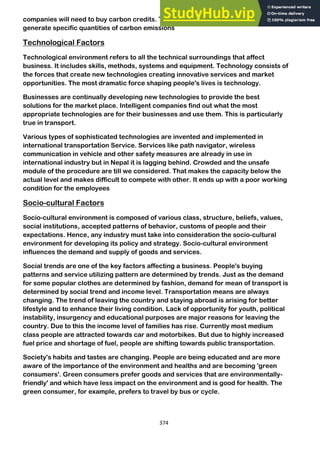
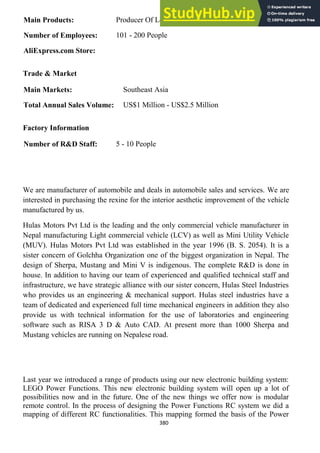
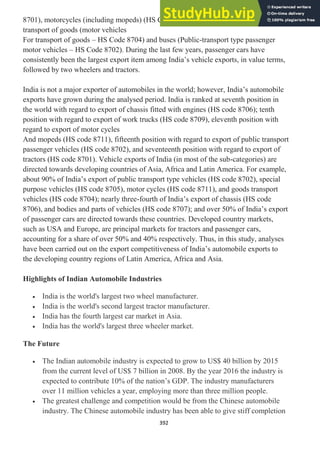
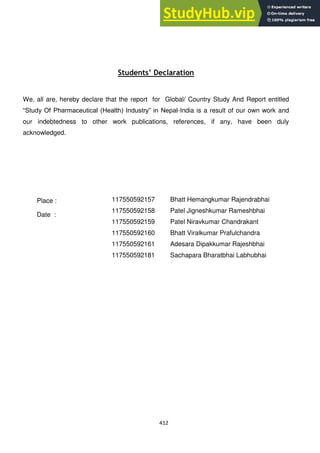
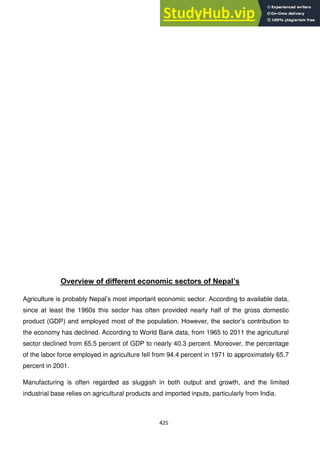
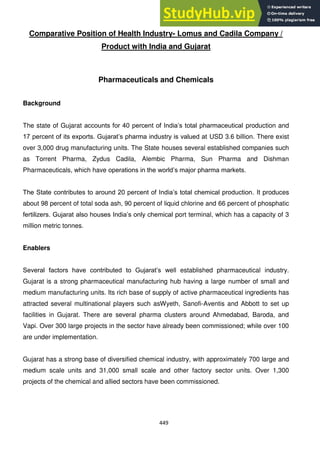
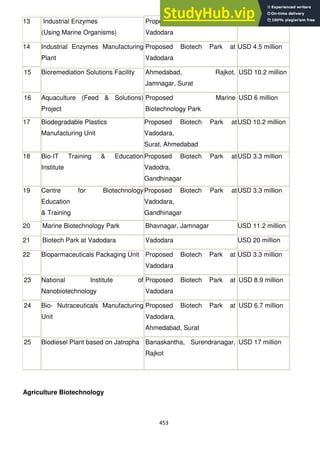
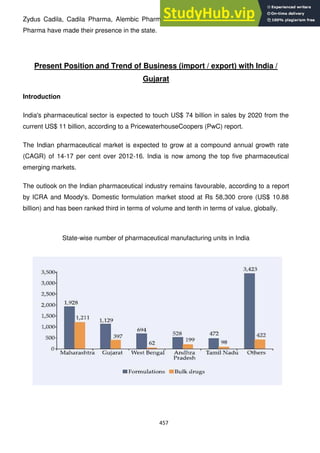
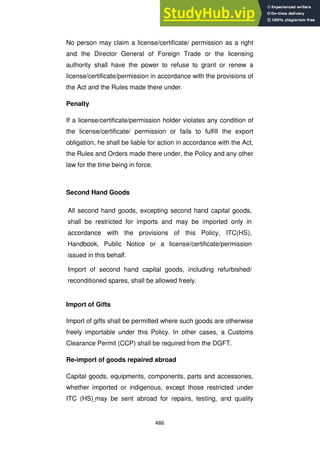
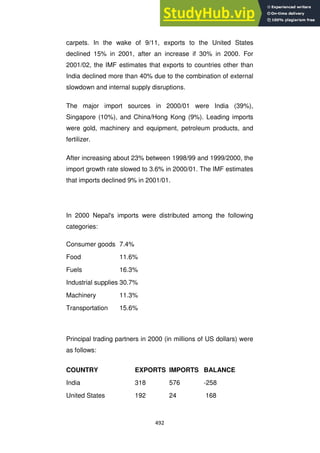
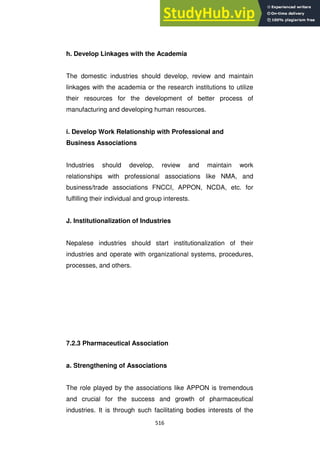
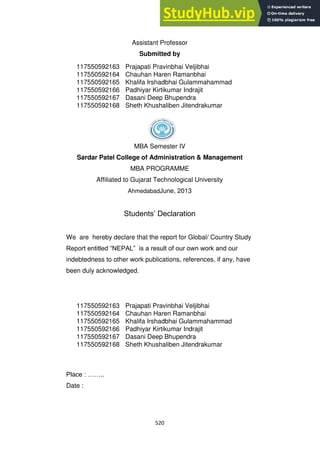
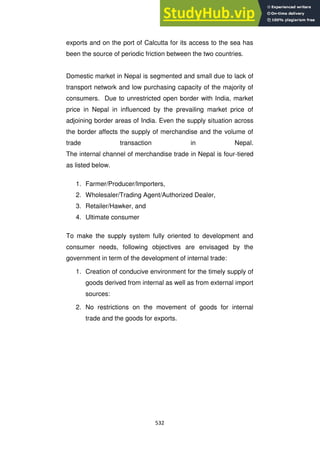
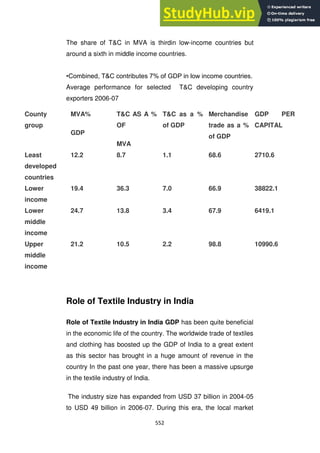
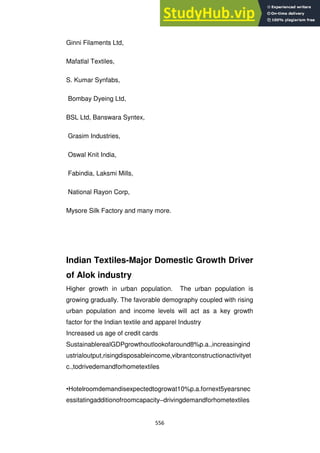
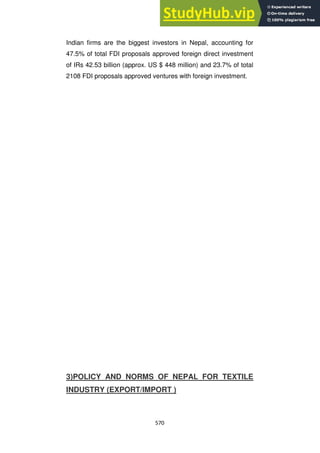
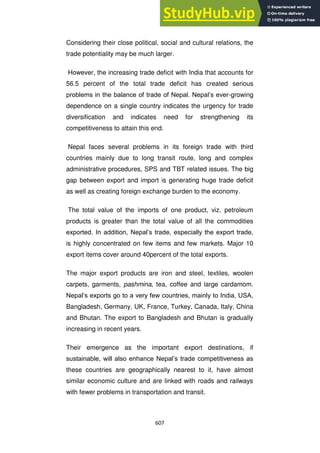
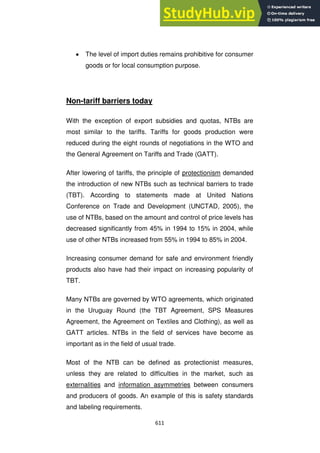
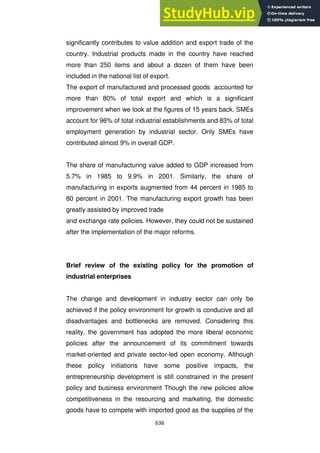
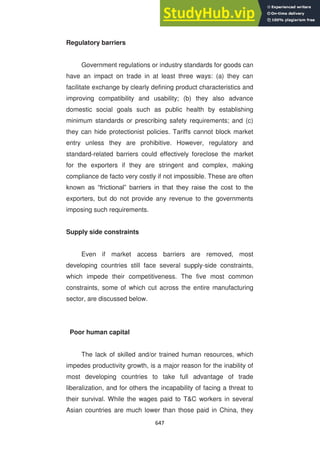
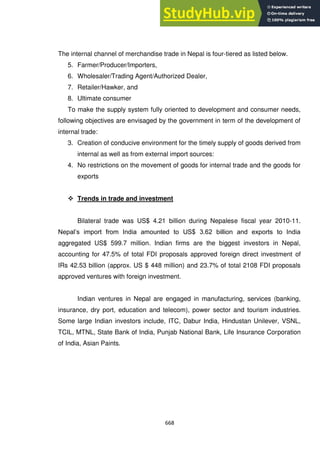
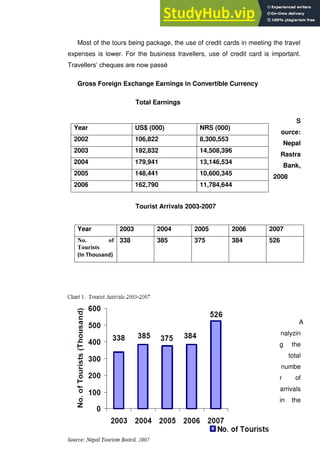
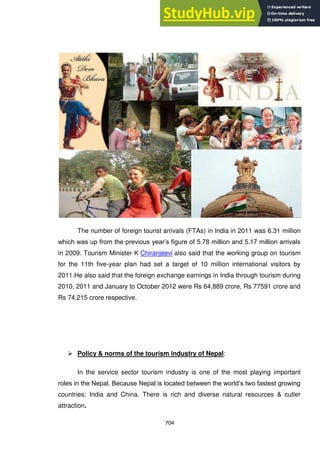
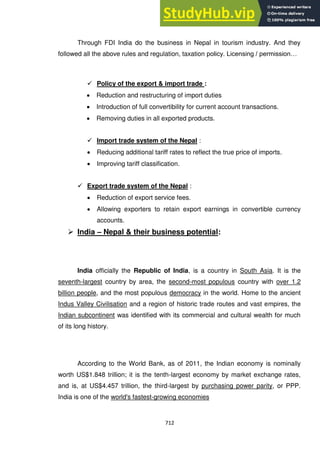
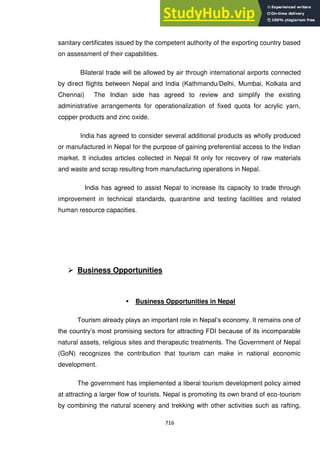
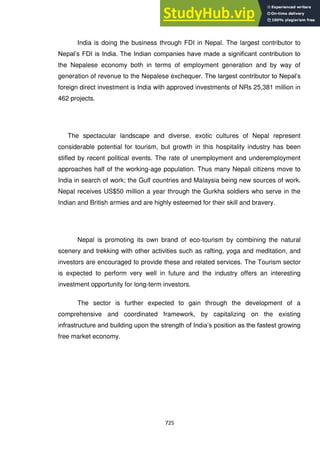
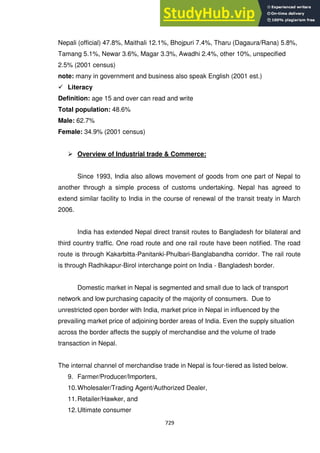
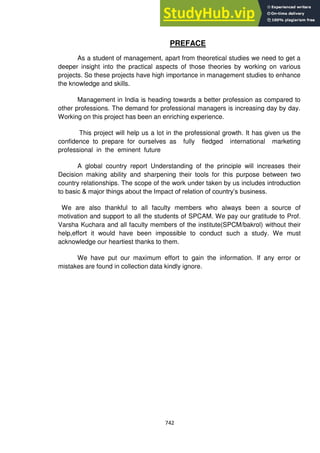
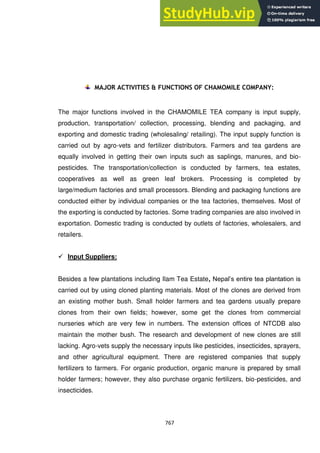
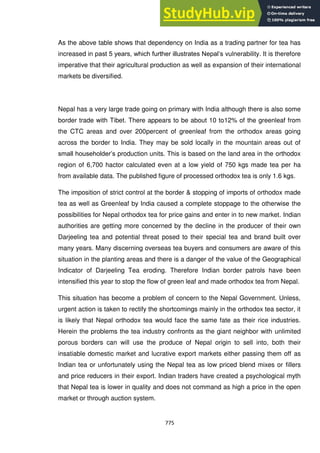
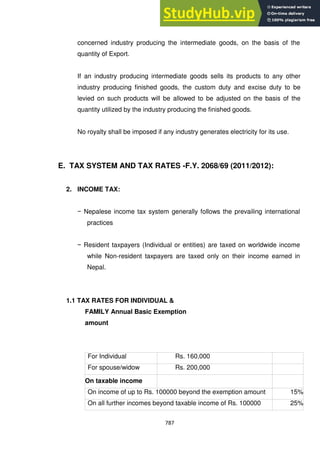
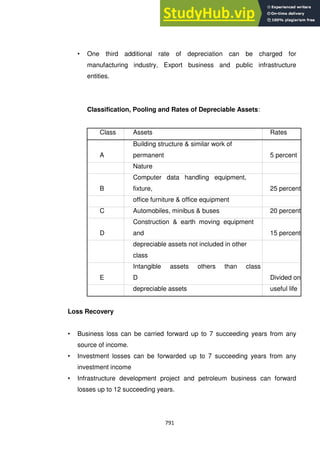
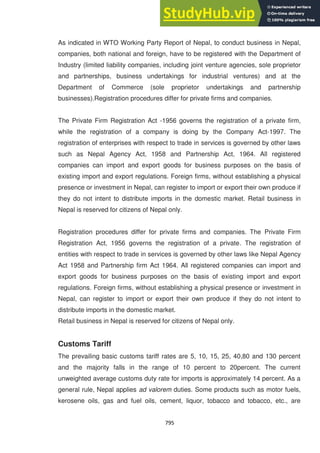
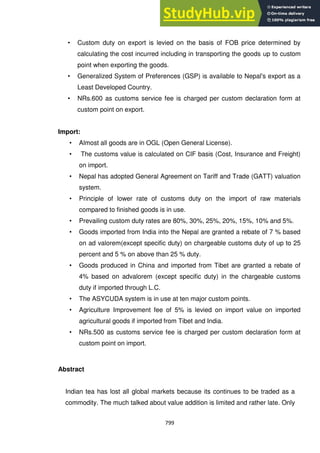
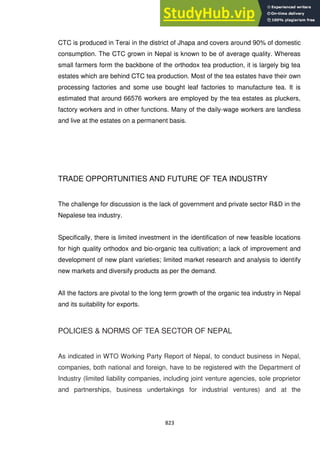
1.3- HISTORY OF NEPALESE HEALTH INDUSTRY
Public health and health care services in Nepal are provided by both the public
and private sector and fares poorly by international standards. According to
2011 census, more than one third (38.17%) of the total households do not have
toilet in their houses. Tap/Piped water is the main source of drinking water for
47.78% of the total households. Tube well/hand pump is the main source of
drinking water for about 35% of the total households, while spout, uncovered
well/kuwa and covered well/kuwa are the main source for 5.74%, 4.71% and
2.45% respectively. Based on 2010 World Health Organization (WHO) data,
Nepal ranked 139 in life expectancy in 2010 with the average Nepalese living to
65.8 years.
Disease prevalence is higher in Nepal than it is in other South Asian countries,
especially in rural areas. Leading diseases and illnesses include diarrhea,
gastrointestinal disorders, goiter, intestinal parasites, leprosy, visceral
leishmaniasis and tuberculosis. About 4 out of 1,000 adults aged 15 to 49 had
human immunodeficiency virus (HIV), and the HIV prevalence rate was 0.5%.
Malnutrition also remains very high: about 47% of children under 5 are stunted,
15 percent wasted, and 36 percent underweight, although there has been a
declining trend for these rates over the past five years, they remain alarmingly
high.In spite of these figures, some improvements in health care have been
made, most notable is the significant progress in maternal-child
health.[105][106] Overall Nepal‘s HDI for health was 0.77 in 2011, ranking
Nepal 126 out of 194 countries, up from 0.444 in 1980.](https://image.slidesharecdn.com/aglobalcountrystudyandreport-230807175540-926289e0/85/A-GLOBAL-COUNTRY-STUDY-AND-REPORT-pdf-103-320.jpg)


![141
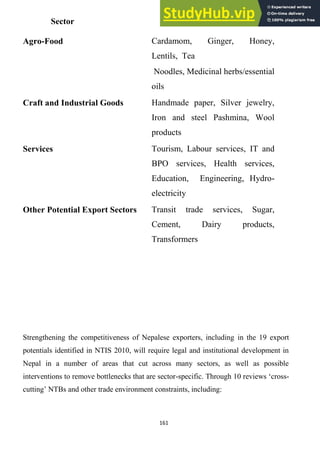
Yet, the challenges are enormous.
Foremost among those is one familiar to Canadians: a shortage of
physicians, particularly ones who are willing to hang up a shingle in rural
and remote areas of the country.
―Every year, about 27 000 graduate doctors [graduate] from Indian
medical colleges. But, more than 75% of Indian doctors are based in
cities, whereas about 70% of patients in this country are village-based,‖
says Dr. Swapan Jana, secretary of the Society for Social Pharmacology,
an Indian nongovernmental organization.](https://image.slidesharecdn.com/aglobalcountrystudyandreport-230807175540-926289e0/85/A-GLOBAL-COUNTRY-STUDY-AND-REPORT-pdf-141-320.jpg)

![151
Submitted for the Partial Fulfillment of
MASTERS OF BUSINESS ADMINISTRATION (MBA) (2012-2013)
Gujarat Technological University - Ahmadabad
Under the Guidance of:
MS. SULABHA NARAYAN (Assistant Professor)
Submitted BY:
VINIT PATEL (117550592133)
JENESH INANI (117550592133)
MUNIR KAPADIYA (117550592135)
RAJESH VIKMA (117550592136)
MOHIT PATEL (117550592137)
MANAN VAGHELA (117550592138)
[BATCH: 2012-13]
SARDAR PATEL COLLEGE OF ADMINISTRATION AND MANAGEMENT (SPCAM M.B.A)
AFFILIATED TO GUJARAT TECHNOLOGICAL UNIVERSITY, AHEMEDABAD. MAY-2013
STUDENT DECLARATION
We, Bearing Enroll 117550592133; 117550592134; 117550592135;
117550592136; 117550592137; 117550592138;hereby declare that the report
for Global/ Country Study Report entitled ―NEPAL AGRICULTURE SECTOR
“is a result of our own work and our indebtedness to other work publications,
references, if any, have been duly acknowledged.](https://image.slidesharecdn.com/aglobalcountrystudyandreport-230807175540-926289e0/85/A-GLOBAL-COUNTRY-STUDY-AND-REPORT-pdf-151-320.jpg)


![179
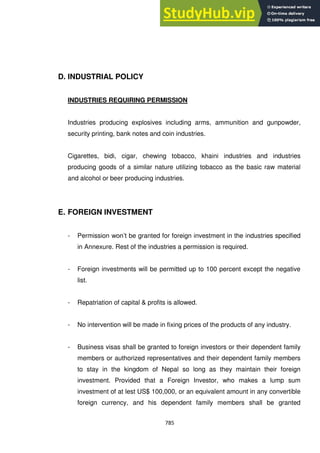
average annual rate of 2.6 percent over the same period.[1]
Further, the annual average
growth rate of food grain production was only 1.2 percent during the same period.
There were some successes. Fertile lands in the Tarai Region and hardworking peasants in
the Hill Region provided greater supplies of food staples (mostly rice and corn), increasing
the daily caloric intake of the population locally to over 2,000 calories per capita
Overview of Nepal policy:
Nepal‘s export were goods and services grew from US$57.1 million in 1965 to
US$712 million in 2004 and increased as a percentage of gross domestic product from 7.8
percent to 16.8 percent, averaging 13.2 percent for the period. There was export earned the
foreign exchange that permitted Nepal‘s to purchase petroleum products, palm oil, and
machinery necessary for industrial production and growth.
During the World Bank and Nepal government data indicate that from 1960 to 2004
total GDP grew from US$1.4 billion to US$6.2 billion, averaging 3.6 percent annual growth
for the period. Although garments was the most impotent export included agricultural product
such as rice, wheat and sugarcane etc. export commodities in Nepal was clothing, pluses,
carpets, textiles, juice, pashima, jute goods and export partners was a India 57.4%, Germany
5.4% and U S 9.6%.
Nepalolian economy was poorest and least developed countries in the
world,with about one-quarter of its population living below the poverty line. The
country has to face several challenges, like the high external debt and inflation rate.
Agriculture is the mainstay of the economy, providing a live lihood for three-
fourths of the population and accounting for a little over one -third of GDP.there
was agriculture GDP 75%, Industry GDP 7% and Services GDP 18%. So
Nepal‘s GDP was agriculture product and 75% population depend in
agriculture.](https://image.slidesharecdn.com/aglobalcountrystudyandreport-230807175540-926289e0/85/A-GLOBAL-COUNTRY-STUDY-AND-REPORT-pdf-179-320.jpg)
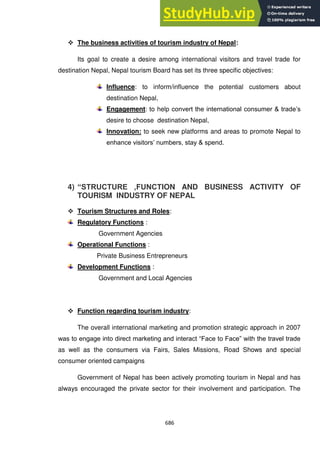
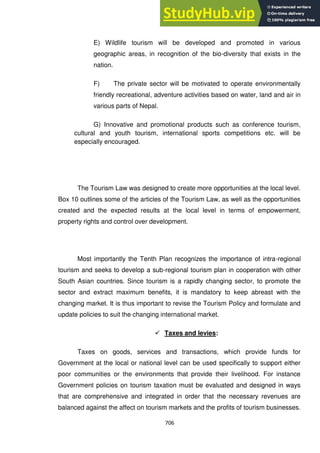
![184
Provide concessional customs duty of 5 per cent to specified agricultural machinery not
manufactured in India;
Provide central excise exemption to specified equipment for preservation, storage and
processing of agriculture and related sectors and exemption from service tax to the
storage and warehousing of their produce; and Provide full exemption from excise duty to
trailers and semi-trailers used in agriculture.
Concessional import duty to specified machinery for use in the plantation sector to be,
extended up to March 31, 2011 along with a CVD exemption.
To exempt the testing and certification of agricultural seeds from service tax.
The transportation by road of cereals, and pulses to be exempted from service tax.
Transportation by rail to remain exempt.
To ease the cash flow position for small-scale manufacturers, they would be permitted to
take full credit of Central Excise duty paid on capital goods in a single installment in the
year of their receipt. Secondly, they would be permitted to pay Central Excise duty on a
quarterly, rather than monthly, basis.
Tax concessions are proposed to assist the growth of agriculture and associated
industries
Estimated agriculture sector growth at 5.4 per cent during this fiscal year
Export taxes. Syria‘s legislation an agricultural production tax is levied on all agricultural
commodities which are exported. Effectively this constitutes an export tax.
Generally, this tax ranges between 9.5 and 12% of the production value. The products
can be categorized as follows:
Products on which an production tax of 12% of their average price at the time of export is
levied. This product group includes fresh and processed vegetables and fruits, olives,
olive oil and other products made from olives (a total of 88 commodities).
Products on which an export tax of 9-9.5% of their average price at the time of exports is
levied (see Table A- xx in the Appendix).]
EXIM policy of Indian country-](https://image.slidesharecdn.com/aglobalcountrystudyandreport-230807175540-926289e0/85/A-GLOBAL-COUNTRY-STUDY-AND-REPORT-pdf-184-320.jpg)
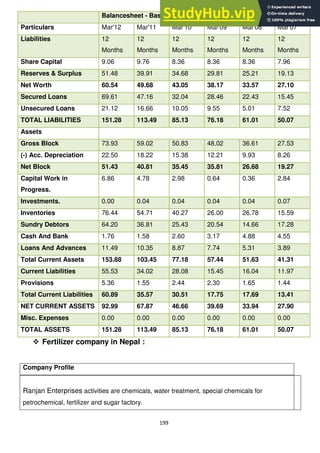
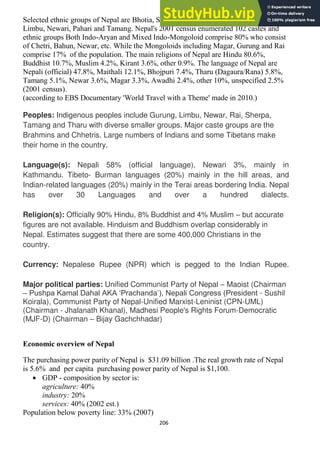
![200
Most of Our Customer is Fertilizer and Sugar Factories in Nepal since 1985.
Ranjan Enterprises also became distributor for Sulphuric Acid and Complex Fertilizer from
one of biggest manufacture in a for west side part of Nepal.
Now, Ranjan Enterprises expand their business in Boiler. Ranjan
Enterprises has 2 office : Kathmandu
Ranjan Enterprises provide engineer who has experience more than 20 years and young
engineer who has a good achievment spirit.
[ Buying Categories ]
- Other Inorganic Chemicals >> Chemicals
- Other Organic Chemicals >> Chemicals
- Fertilizer >> Agriculture
- Timber >> Construction & Real Estate
- Water Treatment >> Environment
[ keyword ]
Chemicals , environment , boiler
Registration Date 2006/08/12 (Year/Month/Date)
Buyer / Seller in EC21 Buyer
Business Type Agent
Year established 1998
Employees total 11 – 50
Annual revenue USD 1,000,001 - 2,000,000
Contact Information
Company
Ranjan Enterprises Pvt. Ltd.
Address
7/144 Resham Kothi
Road No. 2
Birgunj
44301](https://image.slidesharecdn.com/aglobalcountrystudyandreport-230807175540-926289e0/85/A-GLOBAL-COUNTRY-STUDY-AND-REPORT-pdf-200-320.jpg)


![308
Air India is the flag carrier airline of India. It is part of the government owned Air India Limited (AIL).
The airline operates a fleet of Airbus andBoeing aircraft serving Asia, the United States, and Europe.
Its corporate office is located at the Indian Airlines House, in the parliament street ofNew Delhi.Air
India has two major domestic hubs at Indira Gandhi International Airport and ChhatrapatiShivaji
International Airport. The airline formerly operated a hub at Frankfurt Airport which was terminated on
account of high costs.However, another international hub is being planned at the Dubai International
Airport.
Following economic losses in 2012, Air India has slipped to fourth place in the Indian
domestic aviation sector from being the largest operator in the Indian subcontinent, behind low cost
carriers like IndiGo, Spicejet, and its full service rival Jet Airways. Following its merger with Indian
Airlines, Air India has faced multiple problems, including escalating financial losses,Between
September 2007 and May 2011, Air India's domestic market share declined from 19.2% to 14%,
primarily because of stiff competition from private Indian carriers. In August 2011, Air India's invitation
to join Star Alliance was suspended as a result of its failure to meet the minimum standards for the
membership.]
In October 2011, talks between the airline and Star Alliance have resumed.In April
2012, the Indian government granted another bailout package to Air India, including 300 billion
(US$5.5 billion) of subsidies. In order to raise funds for reconstruction, Air India decided to sell and
lease back all its dreamliners.
Air India remains as a state-owned company through Air India Limited. However, government
ownership of the airline has subsequently led to multiple problems, such as enormous market share
losses, declining profits, and escalating labour disputes. Historically, there have been numerous
attempts to privatize Air India in hopes of a better future, but political interference has since prevented
this goal from being achieved. Furthermore, it is also believed that mismanagement and corruption
have impacted Air India's financial performance.
Economy of India
Air India has upgraded its economy offering in recent years as competition has increased. On long-
haul services, there is a choice of western or Indian food, always with a vegetarian choice and free
alcoholic drinks. However, most aircraft do not have personal entertainment systems.
Economy seat pitch on Boeing 747s is 31-34 inches. On A310s it is 31-33 inches and on Boeing 777-
200 Long Range aircraft it is a standard 34 inches. However, there are variations within individual
aircraft types, so check the seat plan.
Air India has decided to add more economy class seats by reducing business class seats in its 24
narrow body aircraft as the airline has been witnessing more passengers in that class.
The national carrier has decided to reconfigure 24 newly acquired narrow body aircraft - 20 Airbus321
and four Airbus320, which are part of 43 newly acquired A320 aircraft - by reducing two rows of
business class and increasing the economy class seating by two or three rows, KC Venugopal,
Minister of State in the Ministry of Civil Aviation informed LokSabha today.
Air India has reconfigured 14 out of 18 of its old Airbus 320 aircraft from two class configuration to a
single class configuration of 168 all economy seats.](https://image.slidesharecdn.com/aglobalcountrystudyandreport-230807175540-926289e0/85/A-GLOBAL-COUNTRY-STUDY-AND-REPORT-pdf-308-320.jpg)

![338
5 November 1960- RNA Douglas C-47A-80-DL (9N-AAD) crashed on take-off at Bhairawa
Airport and caught fire. All four crew members were killed. There were no passengers on board.[10]
1 August 1962- RNA Douglas C-47A-DL (9N-AAH) en route from Kathmandu-Gaucher Airport
to New Delhi, radio contact was lost and the aircraft crashed near Tulachan Dhuri. The wreckage was
found on 9 August 1962 on a mountain top at 11,200 feet. All four crew and six passengers were
killed.[10]
12 July 1969- RNA Douglas DC-3D (9N-AAP) collided with a tree while flying over a cloud
covered ridge at 7,300 feet at Hitauda, Nepal. All four crew and 31 passengers were killed.[10]
25 January 1970- RNA Fokker F27-200 (9N-AAR) after a flight from Kathmandu, was caught in
severe thunderstorms with turbulence and down draughts on final approach to Delhi (Palam Airport).
The pilot couldn't control the aircraft and crashed short of the runway. Of the five crew and 18
passengers only one crew member was killed.[10]
10 June 1973- RNA De Havilland Canada DHC-6 Twin Otter on a flight from Biratnagar to
Kathmandu, was taken over by three hijackers of Nepali Congress party who demanded money and
escaped after landing in Bihar, India. None of the three crew and 18 passengers were injured.[10]
15 October 1973- RNA De Havilland Canada DHC-6 Twin Otter 300 (9N-ABG) was damaged
beyond repair at Lukla Airport. the three crew and three passengers were unhurt.[10]
22 December 1984- RNA De Havilland Canada DHC-6 Twin Otter 300 (9N-ABH) crashed off
course near Bhojpur, Nepal. Bad weather and pilot error could have been the cause. All three crew
were killed as well as 12 of the 20 passengers.[10]
9 June 1991- RNA De Havilland Canada DHC-6 Twin Otter 300 (9N-ABA), after a flight from
Kathmandu, crashed on landing at Lukla Airport following an unstabilized approach in bad weather.
All three crew and 14 passengers were killed.[10]
5 July 1992- RNA De Havilland Canada DHC-6 Twin Otter 300 (9N-ABB), lost directional
control on takeoff from Jumla Airport on a flight to Surkhet. The aircraft ran off the runway and struck
the airport perimeter fence. None of the three crew were injured and there were no passengers on
board.[10]
17 January 1995- RNA De Havilland Canada DHC-6 Twin Otter 300 (9N-ABI), flight RA133
from Kathmandu to Rumjatar, had problems getting airborne at Tribhuvan International Airport,
struck the airfield perimeter fence and plunged into fields. Of three crew and 21 passengers, one crew
member and one passenger were killed.[10]
25 April 1996- RNA BAe 748 Series 2B (9N-ABR) overran the runway at Meghauli Airport, after
a flight from Kathmandu, when landing in rain on the grass airstrip. The aircraft ran across some
ditches, causing the nosegear to collapse. None of the 4 crew and 27 passengers were injured.[10]
27 July 2000- RNA De Havilland Canada DHC-6 Twin Otter 300 (9N-ABP), on a flight from
Bajhang to Dhangadhi, collided with trees on the 4,300 feet Jarayakhali hill on the Churia mountain
range before catching fire. All 3 crew and 22 passengers were killed.[10]
19 April 2010- RNA De Havilland Canada DHC-6 Twin Otter 300 (9N-ABX) on a flight from
Kathmandu (KTM) to Phaplu Airport (PPL) (with Kangel Danda as designated alternate airport). The](https://image.slidesharecdn.com/aglobalcountrystudyandreport-230807175540-926289e0/85/A-GLOBAL-COUNTRY-STUDY-AND-REPORT-pdf-338-320.jpg)

![356
currency and has ended the existing mechanism of duty refund procedure which was
procedurally cumbersome. It has provide Nepal a direct control on the customs duty revenues
on import of manufactured goods from India. It also allows Indian exports to avail benefit of
export promotion schemes prevailing in India, making these products more competitive in
Nepal either for sale or for further value addition. [This change has came into effect from 1st
March 2012]
The time limit for temporary import of machinery and equipment for repair and maintenance
has been raised from 3 to 10 years.
• Several new items of export interest to Nepal have been added to the list of primary products
giving these items duty free access to India without any quantitative restrictions. These include
floriculture products, atta, bran, husk, bristles, herbs, stone aggregates, boulders, sand and
gravel.
Criterion for calculating value addition for gaining preferential access to India has been
changed from ex-factory basis to FOB basis.
India has agreed to consider waiver, on request from GON, of any additional duty that may be
levied over and above CVD.
Both sides have agreed to exempt exports of goods, which are already covered under forward
contract, from imposition of restrictions on exports.
Both sides will grant recognition to the sanitary and phyto-sanitary certificates issued by the
competent authority of the exporting country based on assessment of their capabilities.
Articles manufactured in Nepal, which do not fulfill the criteria for preferential access will be
provided MFN access to the Indian market. The certificate of origin in case of such exports has
been prescribed.
The provisions regarding safeguard measures in case of serious injury to the domestic industry
have been streamlined.
A joint mechanism, comprising local authorities has been established to resolve problems
arising in clearance of perishable goods.
An Inter-Governmental Sub-Committee (IGSC) at the joint secretary-level has been
established. Existing Inter-Governmental Committee (IGC) at the Secretary level will meet
once in six months and the IGSC will meet at the interval of the two IGC meetings.
Four additional Land Customs Stations (LCSs) will be established to facilitate bilateral trade:
Maheshpur/Thutibari (Nawalparasi); Sikta-Bhiswabazar; Laukha-Thadi; and Guleria/Murtia,
bringing the total number of Stations to 26.
For the first time, bilateral trade will be allowed by air through international airports connected
by direct flights between Nepal and India (Kathmandu/Delhi, Mumbai, Kolkata and Chennai).](https://image.slidesharecdn.com/aglobalcountrystudyandreport-230807175540-926289e0/85/A-GLOBAL-COUNTRY-STUDY-AND-REPORT-pdf-356-320.jpg)

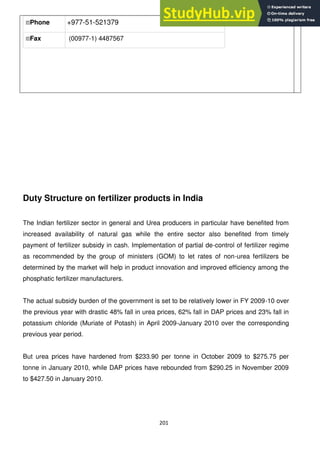
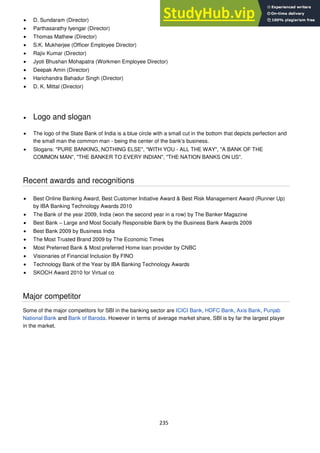
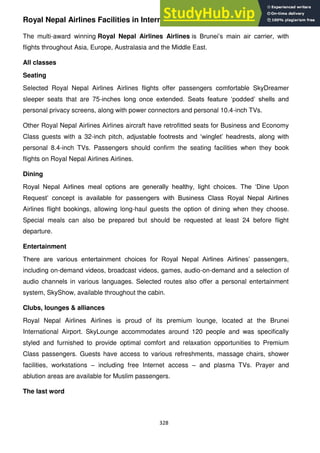
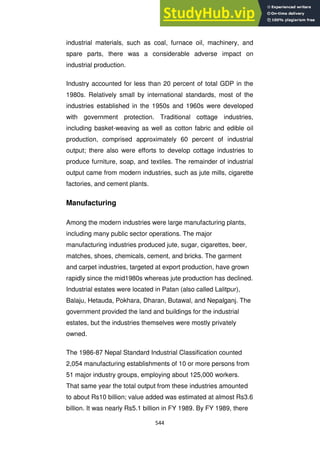
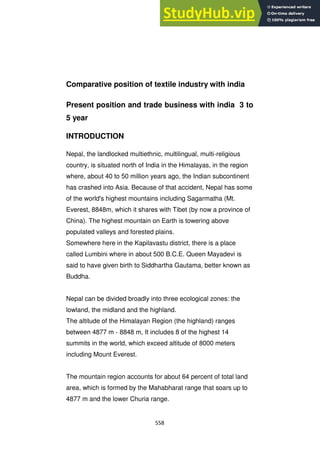
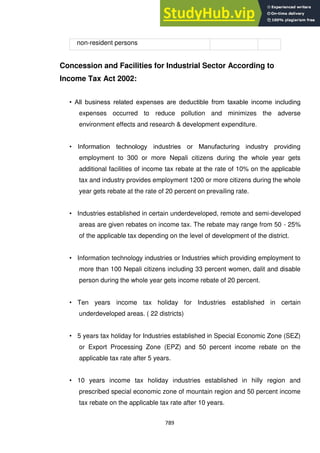
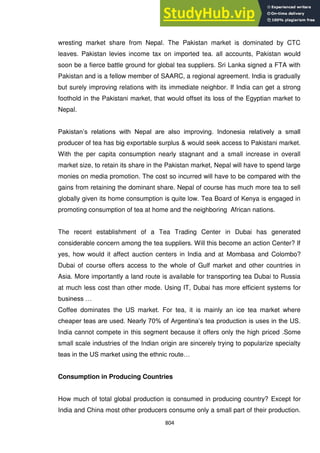
![360
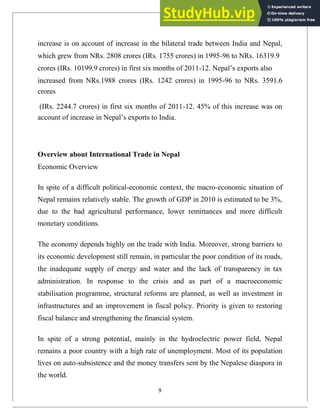
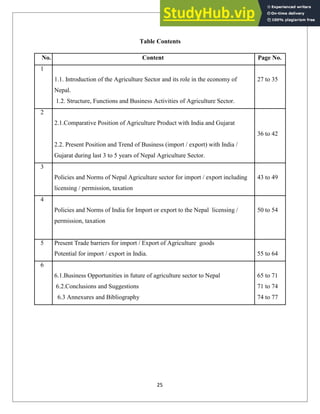
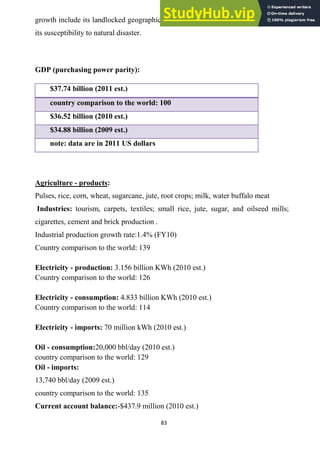
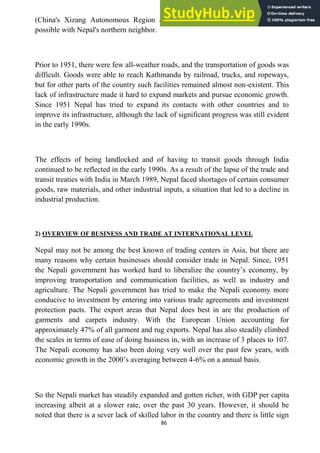
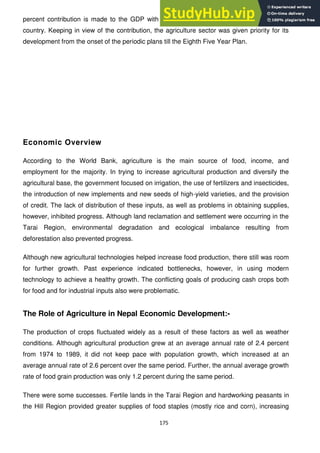
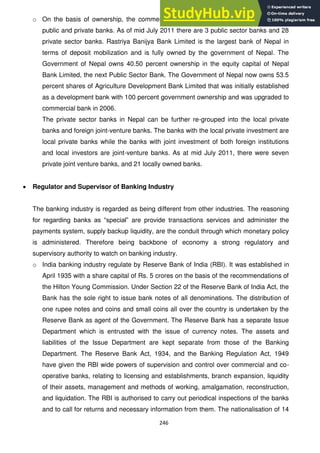
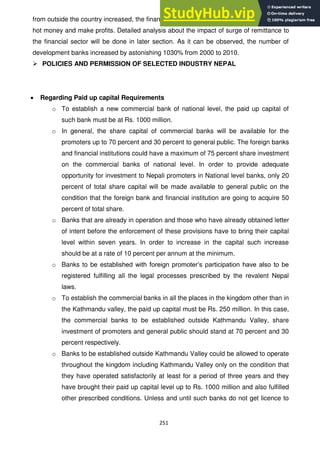
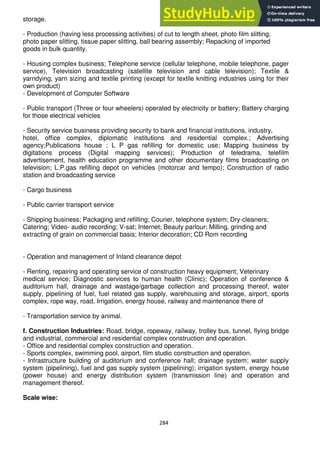
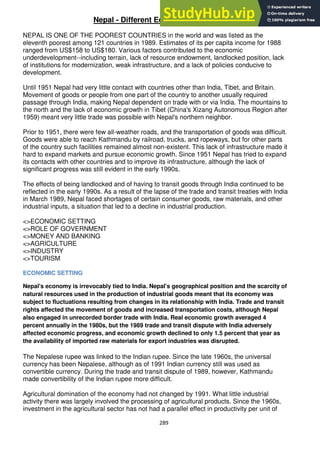
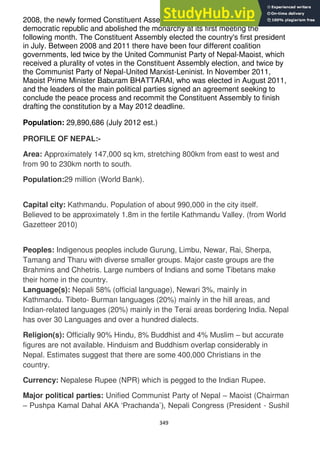
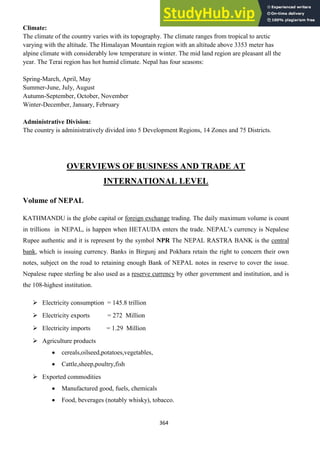
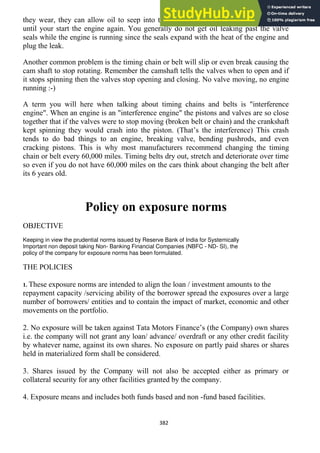
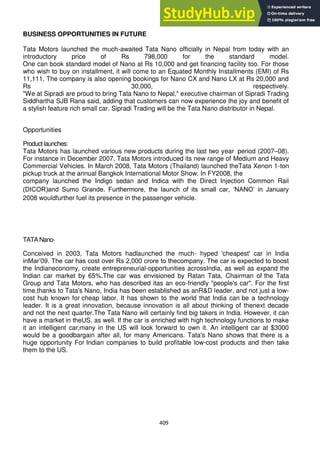
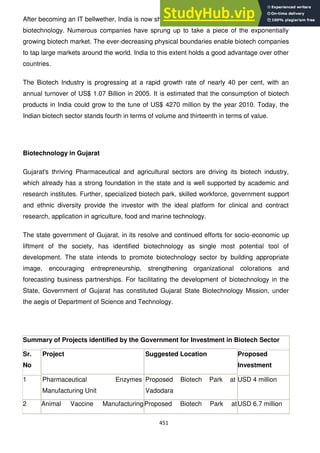
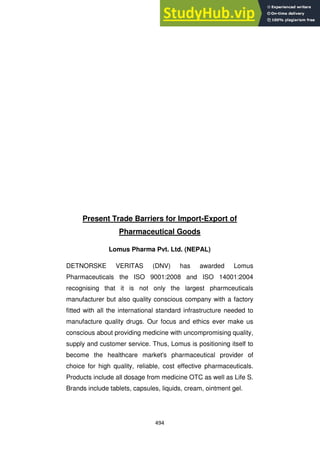
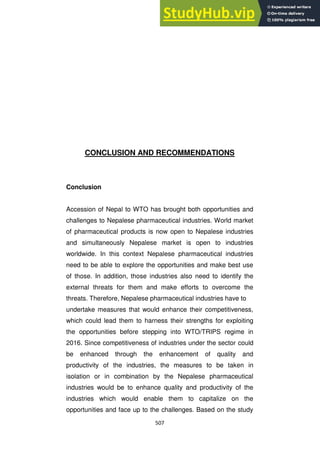
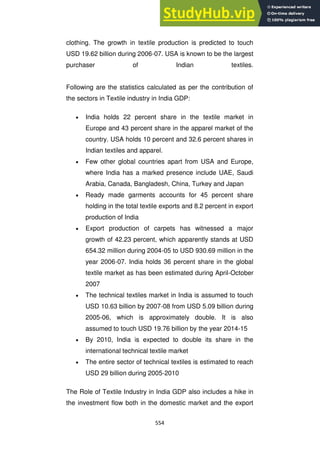
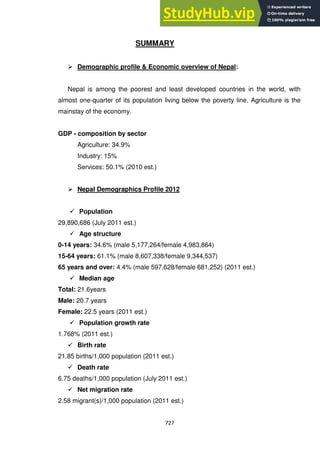
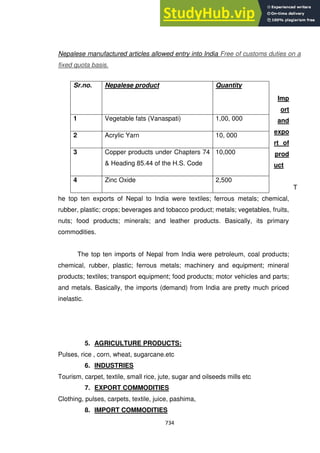
Fiscal year 16 July - 15 July
Trade organizations WTO
Statistics
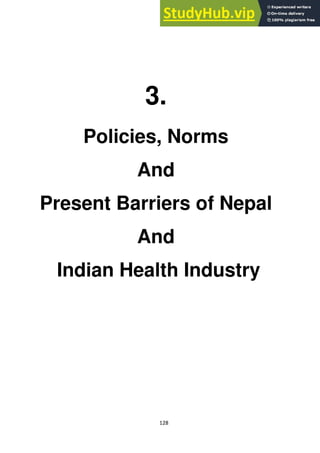
GDP $35.81 billion (2010 est.)
GDP growth 4.6% (2010 est.)
GDP per capita $1,200 (2010 est.)
GDP by sector agriculture (40%), industry (20%), services(40%) (2002 est.)
Inflation (CPI) 8.6% (September 2010 est.), 10.6% (October 2011 est. source: myrepublica.com)
Population
belowpoverty line
24.7% (2008 est.)
Main industries Tourism, garment, food and beverages, metal manufactures, herbs.
Ease of Doing Business
Rank
107th[1]
External
Exports $849 million (2009) f.o.b.; note - does not include unrecorded border trade with India (2008)
Export goods carpets, clothing, leather goods, jute goods, grain, herbs, tea
Main export partners European Union 42.5%, United States 8%,Bangladesh 6.04%, Germany 5% (2009)
Imports $5.26 billion f.o.b. (2008)
Import goods Petroleum Products, Gold, Machinery
Main import partners India 57%, China 13% (2009)
Public finances
Revenues $3 billion (FY 2010)
Expenses $4.6 billion (FY 2010)
Main data source: CIA World Fact Book](https://image.slidesharecdn.com/aglobalcountrystudyandreport-230807175540-926289e0/85/A-GLOBAL-COUNTRY-STUDY-AND-REPORT-pdf-360-320.jpg)
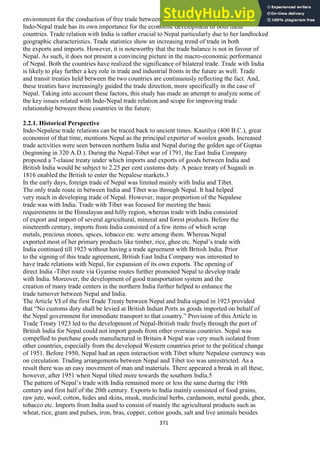
![375
PART – 02 SEM. – 04
HULAS MOTERS LTD AND TATA MOTERS PVT LTD
INTRODUCTION OF TATA MOTORS
Tata Motors Limited (formerly TELCO) is an Indian multinational automotive
manufacturing company headquartered in Mumbai, Maharashtra, India and a subsidiary
of the Tata Group. Its products include passenger cars, trucks, vans, coaches, buses and
military vehicles. It is the world's eighteenth-largest motor vehicle manufacturing
company, fourth-largest truck manufacturer and second-largest bus manufacturer by
volume.[3]
Tata Motors has auto manufacturing and assembly plants in Jamshedpur, Pantnagar,
Lucknow, Sanand, Dharwad and Pune, India, and in Argentina, South Africa, Thailand
and the United Kingdom. It has research and development centres in Pune, Jamshedpur,
Lucknow and Dharwad, India, and in South Korea, Spain, and the United Kingdom. It
has a bus manufacturing joint venture with Marco polo S.A., Tata Marco polo, and a
construction equipment manufacturing joint venture with Hitachi, Telcon Construction
Solutions.
Founded in 1945 as a manufacturer of locomotives, the company manufactured its first
commercial vehicle in 1954 in collaboration with Daimler-Benz AG, which ended in
1969.[4]
Tata Motors entered the passenger vehicle market in 1991 with the launch of](https://image.slidesharecdn.com/aglobalcountrystudyandreport-230807175540-926289e0/85/A-GLOBAL-COUNTRY-STUDY-AND-REPORT-pdf-375-320.jpg)

![393
to India in terms of productivity, cost of manufacturing and technology. Again
the present trend of excess manufacturing capability, reduced margins put
additional pressure on the industry.
The global recession has had a dampener effect on the growth of the industry, but
market experts believe it is only a short term phenomenon and are confident of
the industry bouncing back.
On the positive side, India‘s strength in software sector, combined with skilled
labour and low cost of manufacturing should place it in a favourable position
globally.
Recently Ratan Tata, Chairman (Tata Motors) created history by launching the
world's cheapest car NANO. The cars pricing is around one lakh, gaining instant
recognition in the automobile industry across the globe. It heralded the coming to
age of the Indian Automobile Industry.
The Registration and Licensing of Industrial Undertakings Rules, 1952
1. *S.R.O. 1141 dated the 9
th
July, 1952. - In exercise of the powers conferred by
section 30 read with sections 10 and 11, sub-section (2) of section 12 and sections 13
and 14 of the Industries (Development and Regulation) Act, 1951 (LXV of 1951), the
Central Government hereby makes the following Rules, the same having been
previously published as required under sub-section (1) of section 30 of the Act,
namely:-
1. Short Title: These rules may be called the Registration and Licensing of Industrial
Undertakings Rules, 1952.
2. Definitions: In these rules, unless there is anything repugnant in the subject or
context:-
(I) ―the Act‖ means the Industries (Development and Regulation) Act 1951 (LXV
of 1951),
(ii) ―Effective steps‖ shall mean one or more of the following:-
2*[(a) that 60 per cent or more of the capital issued for an industrial
undertaking which is a public company within the meaning of
the Indian Companies Act, 1913 (VII of 1913) has been paid
up;]
(b) That a substantial part of the factory building has been constructed;
(c) That a firm order has been placed for a substantial part of the plant
and machinery required for the undertaking.
3. Application for Registration: 3*[“(1) An application for the registration of an
existing industrial undertaking shall be made to the Ministry of Industry (Department of](https://image.slidesharecdn.com/aglobalcountrystudyandreport-230807175540-926289e0/85/A-GLOBAL-COUNTRY-STUDY-AND-REPORT-pdf-393-320.jpg)
![394
Industrial Development), Government of India, New Delhi, at least three months before
the expiry of the period fixed under sub-section (1) of section 10 of the Act in relation
to that undertaking in such form and with such number of copies thereof as may be
specified by the said Ministry:
Provided that an application which is not made in time may be entertained by the
said Ministry, if the applicant satisfies that Ministry that there was sufficient cause for
not making the application in time‖.]
2* [(1A) Where an application for the registration of an industrial undertaking is
pending at the commencement of the Industries (Development & Regulation)
Amendment Act, 1953, no fresh application for such registration shall be necessary
under the rule and any such pending application shall be disposed of in accordance with
the provisions of these Rules].
2*[ (2) Each application shall be accompanied by a crossed demand draft for Rs. 2500
drawn on the State Bank of India, Nirman Bhavan, New Delhi, in favour of the Pay and
Accounts Officer, Ministry of Industry, (Department of Industrial Development),
Government of India, New Delhi.]
4. Acknowledgement of Application: On receipt of application, the receiving officer
shall note thereon the date of its receipts, and shall send to the applicant an
acknowledgement stating the date of receipt.
5. Power of Central Government to ask for Additional Information: The
3*[Ministry of Industrial Development] or the authority appointed by it 4*[in this
behalf] may require the applicant to furnish within a period to be specified by it, such
additional information as it may consider necessary for the purpose of registration.
6. Grant of Registration Certificate: If an application made under sub-rule (1) of rule
3 falls within the scope of that rule, the 3*[Ministry of Industrial Development], shall
after such investigation as it may consider necessary, grant to the applicant, before the
[expiry of the period fixed under section 10 of the Act], a certificate of registration in
Form C appended to these rules. If an application made under sub-rule (1) of rule 3
does not fall within the scope of that rule, the 4*[Ministry of Industrial Development]
5***shall inform the applicant accordingly.
7. Application for License :-( 1) an application for a license or permission for the
establishment of a new industrial undertaking or any substantial expansion of [or the
production or manufacture of any new article in] an industrial undertaking shall be
made before taking any of the following steps:
(a) Raising from the public any part of the capital required for the undertaking or
expansion [or the production or manufacture of the new article].
(b) Commencing the construction of any part of the factory building for the
undertaking or expansion [or the production or manufacture of the new
article].](https://image.slidesharecdn.com/aglobalcountrystudyandreport-230807175540-926289e0/85/A-GLOBAL-COUNTRY-STUDY-AND-REPORT-pdf-394-320.jpg)
![395
(a) Placing order for any part of the plant and machinery required for the
undertaking or expansion (or the production or manufacture of the new
article).
1[(1A) an application for a license or permission for changing the location of the
whole or any part of an industrial undertaking which has been registered 2[or in respect
of which a license or permission has been issued] shall be made before taking any of the
following steps:
(a) The acquisition of land or the construction of premises for the purpose of
housing the industrial undertaking at the proposed new site;
(b) The dismantling of any part of the plant and machinery at the existing site)
4[(3) Each application shall be accompanied by a crossed demand draft for Rs.
2500 drawn on the State Bank of India, Nirman Bhavan, New Delhi, in favour of Pay
and Accounts Officer, Ministry of Industry, (Department of Industrial Development),
Government of India, New Delhi.]
8. Acknowledgement of Application: On receipt of the application, the receiving
officer shall note thereon the date of its receipt, and shall send to the applicant an
acknowledgement stating the date of receipt.
9. Power to call for Additional Information: The 6[Ministry of (Industrial
Development)] or the authority appointed by it [in this behalf] may require the applicant
to furnish, within a period to be specified by it, such additional information as it may
consider necessary.
10. Application to be referred to Committee: (1) The Ministry of Industrial
Development shall refer the application to a Committee appointed under sub-rule
(2)[―(Provided that where an application relates to the extension of the period of
validity of an industrial license or to the issue of a carry-on-business license or to
diversification within the existing licensed capacity in respect of such schedule
industries as may, from time to time be decided by the Central Government, having
regard to the maximization of production, better utilization of existing plant and
machinery and other factors, the Ministries concerned may dispose of such application
without reference to the Committee)‖].
(2). The Central Government may, by notification in the Official Gazette, appoint one
or more Committees, consisting of such number of members as it may think fit to
represent the Ministries of the Central Government dealing with
(I) the industry specified in the First Schedule to the Act;
(ii) Finance;
(iii) Science and Technology;
(iv) Environment, Forests and Wildlife;
(v) Small Scale Industries.](https://image.slidesharecdn.com/aglobalcountrystudyandreport-230807175540-926289e0/85/A-GLOBAL-COUNTRY-STUDY-AND-REPORT-pdf-395-320.jpg)
![396
Provided that the Central Government may, if it deems fit, include in such
committee any other member to represent any other Ministry.
(3) A Committee appointed under sub-rule (2) may co-opt one or more
representatives of other Ministries of the Central Government or of any State
Government concerned, wherever it is necessary.
11. Submission of Report by the Committee: After such investigation as may be
necessary, the Committee to which an application has been referred under rule 10 shall
submit a report to the Ministry of Industrial Development.]
12. Contents of the Report: In making the report under Rule 11, [the Committee] shall
have regard to the approved plans, if any, of the Central Government for the
development of the scheduled industry concerned and, where no such plans exist, to the
existing capacity of the scheduled industry, the demand and supply position, availability
of raw materials and plant and machinery. The report should, among other matters,
contain recommendations regarding capital and its structure, suitability of the location
proposed from the point of view of the approved plans for the industry, capacity of the
plant to be installed, availability of rail-transport capacity, availability of technical and
other skilled personnel required, and collaboration, if any, with foreign manufacturers.
13. Recommendation regarding Public Enquiry: If [the Committee referred to in rule
11] is of the opinion that a public enquiry is necessary in respect of any application it
may recommend such a step to the [Ministry of (Industrial Development)]
14. Invitation of Applications: (1) The [Ministry of Industrial Development] or the
authority appointed by it [in this behalf] may , where it considers necessary, invite, by
means of a notice published in the Gazette of India, applications for the grant of
Licenses for the establishment of new industrial undertakings in any scheduled industry.
15. Grant of License or Permission: (1) The ¹[Ministry of Industrial Development]
shall consider the report submitted to it under rule 11, and where it decides that a
license or permission, as the case may be, should be granted it shall inform the
applicant accordingly, not later than 3 months from the date of receipt of the
application, or the date on which additional information under rule 9 is furnished,
whichever is later.
(2) Where the [Ministry of Industrial Development] considers that certain conditions
should be attached to the license or permission or that the license or permission should
be refused, it shall not later than three months from the date of receipt of the application
or the date on which additional information under rule 9 is furnished, whichever is later,
give an opportunity to the applicant to state his case, before reaching decision.
(3) Where a license or permission has been refused the applicant shall be informed of
the reasons for such refusal.](https://image.slidesharecdn.com/aglobalcountrystudyandreport-230807175540-926289e0/85/A-GLOBAL-COUNTRY-STUDY-AND-REPORT-pdf-396-320.jpg)
![397
(4) Licenses or permissions shall be in Form F appended to these rules.
16. Variation or Amendment of Licenses: (1) Any owner of an industrial undertaking
in respect of which a license has been granted, who desires any variation or amendment
in his license shall apply to the [Ministry of Industrial Development] ²* * *giving the
reasons for the variation or amendment.
(2) The [Ministry of Industrial Development] after carrying out such investigation as it
may consider necessary, may vary or amend the license. The Ministry of Commerce
and Industry may also consult the Licensing Committee before coming to a decision.
17. Revocation of Licenses: The [Ministry of Industrial Development] ²* * *shall,
before exercising its power of revocation of a license under sub-section (1) of section
12 of the Act, give an opportunity to the license to state his case.
18. Review of Licenses by a Sub-committee: A sub-committee of the Central
Advisory Council shall be constituted which will review all licenses issued, refused,
varied, amended or revoked from time to time, and advice Government on the general
principles to be followed in the issue of licenses for establishing new undertakings or
substantial expansion of the existing undertakings. The results of the review shall be
reported to the Central Advisory council.
19. Submission of Returns: [(1)] Every owner of an industrial undertaking in respect
of which a license or permission has been granted ²[under the Act] shall send every half
year ending 30
th
June and 31
st
December, commencing from the date of grant of the
license or permission, as the case may be, till such time as the industrial undertaking
commences production a return (with five spare copies), in Form G appended to these
rules, to the [Ministry of Industrial Development], Government of India, New Delhi, [or
to any authority appointed by it in this behalf]. The return relating to every half year
shall be sent within one month after the expiry of that half year.
(2) Whether any condition has been attached to a license or permission granted in
respect of an industrial undertaking to the effect that certain steps should be taken
within a period specified therein every owner of such an undertaking shall send a
return, with five spare copies, in Form G appended to these rules, to the [Ministry of
industrial Development], Government of India, New Delhi (or to any authority
appointed by it in this behalf)showing the progress made in taking such steps at the
expiry of the period so specified. The return shall be sent within a period of seven days
from the expiry of the period so specified.]
(3) Every owner of an industrial undertaking which has been registered by reason of
effective steps having been taken for the establishment of that undertaking before the
commencement of the Act shall send, every half year ending on the 30
th
June and the
31
st
December, and commencing from the 31
st
December 1953, till such time as the
industrial undertaking commences production a return, with five spare copies, in Form](https://image.slidesharecdn.com/aglobalcountrystudyandreport-230807175540-926289e0/85/A-GLOBAL-COUNTRY-STUDY-AND-REPORT-pdf-397-320.jpg)
![398
G appended to these rules, to the [Ministry of industrial Development], Government of
India, New Delhi, or to any authority appointed by it in this behalf. The return relating
to every half year shall be sent within one month of the expiry of that half year].
19A. Notice of certain facts to be given.-(1) If there is any change in the name of
registered industrial undertaking or an undertaking in respect of which a license or
permission has been granted under the Act the owner thereof, shall within fourteen days
from the date of such change, give notice in writing of the fact to the [Ministry of
Industrial Development], Government of India, New Delhi and forward the registration
certificate or the license as the case may be, to that Ministry for endorsing thereon the
change in the name of the undertaking.
(2) If there is any change in the owner of a registered industrial undertaking or an
undertaking in respect of which a license or permission has been granted the new owner
thereof shall, within fourteen days from the date of such change, give notice in writing
of the fact to the [Ministry of Industrial Development], Government of India, New
Delhi; and forward the registration certificate or the license, as the case may be to that
Ministry for endorsing thereon the change in the owner of the industrial undertaking.
(3) If by reason of (a) reduction in the number of workers employed; (b)
discontinuation of the production of articles falling within the scope of the Act; or (c)
any other reason, all or any of the provisions of the Act become inapplicable to a
registered industrial undertaking or an undertaking in respect of which a license or
permission has been granted to be so in-applicable for a period of six months, the owner
thereof shall, within fourteen days of the expiry of the said period of six months give
notice in writing of the fact to the [Ministry of Industrial Development], Government of
India, New Delhi;
(4) If a registered industrial undertaking or an industrial undertaking in respect
of which a license or permission has been granted, has been closed for a period
exceeding thirty days, the owner thereof shall within seven days of the expiry of the
said period of thirty days, give notice in writing of the fact to the [Ministry of Industrial
Development], Government of India, New Delhi.
(5) If any decision has been taken by a competent authority that a registered
industrial undertaking or an industrial undertaking in respect of which a license or
permission has been granted shall be liquidated, the owner thereof shall, within fourteen
days from the date of such a decision, give notice in writing of that fact to the [Ministry
of Industrial Development], Government of India, New Delhi ²[and return the
registration certificate or the license as the case may be to that Ministry].
19B. Loss of Registration Certificate or License, etc.: Where a registration
certificate, a license or a permission granted under these rules is lost, destroyed or
mutilated, a duplicate copy may be granted in receipt of a crossed demand draft for Rs.
25 drawn on the State Bank of India, Nirman Bhavan, New Delhi, in favour of the Pay](https://image.slidesharecdn.com/aglobalcountrystudyandreport-230807175540-926289e0/85/A-GLOBAL-COUNTRY-STUDY-AND-REPORT-pdf-398-320.jpg)
![399
and Accounts Officer, Ministry of Industry (Department of Industrial Development),
Government of India, New Delhi.]
20. Penalty for Contravention of Rules: Whosoever contravenes or attempts to
contravene or abates the contravention of any of these rules shall be punishable under
section 24 of the Act.
21. Allotment of Controlled Commodities to Licensed Undertakings: The owner of
an industrial undertaking in respect of which a license or permission has been granted
shall be eligible to the allotment of controlled commodities required by him for the
construction or operation or for both construction and operation of his undertakings on
such preferential basis as the Central Government may determine from time to time. In
determining such preference the Central Government shall have due regard to the
requirements of existing industrial undertakings.
22. Concession in the Grant of Import Licences to Undertakings: The owner of an
industrial undertaking in respect of which a license or permission has been granted shall
be eligible for the issue of licences for the import of goods required by him for the
construction or operation or for both construction and operation of his undertaking on
such preferential basis as the Central Government may determine from time to time. In
determining this preference which may include such concession as the submission of
one consolidated application in respect of the requirements from each currency area for
all items shown as licensable to actual users, submission of separate application for
highly specialised items even though such items may not be shown as licensable to
actual users and priority in the matter of import from different currency areas, the
Central Government shall have due regard to the requirements of existing Industrial
undertakings.
Policies and Norms of India for Import or export to the NEPAL including licensing /
permission, taxation etc.
General Provisions Regarding Imports and Exports Exports and Imports free unless
regulated
Exports and Imports shall be free, except in cases where they are regulated by the
provisions of this Policy or any other law for the time being in force. The item wise export and
import policy shall be, as specified in ITC (HS) published and notified by Director General of
Foreign Trade, as amended from time to time.
Interpretation of Policy
If any question or doubt arises in respect of the interpretation of any provision contained in
this Policy, or regarding the classification of any item in the ITC(HS) or Handbook (Vol.1) or
Handbook (Vol.2), or Schedule Of DEPB Rate the said question or doubt shall be referred to
the Director General of Foreign Trade whose decision thereon shall be final and binding. If
any question or doubt arises whether a licence/ certificate/permission has been issued in](https://image.slidesharecdn.com/aglobalcountrystudyandreport-230807175540-926289e0/85/A-GLOBAL-COUNTRY-STUDY-AND-REPORT-pdf-399-320.jpg)


![429
Nepal are engaged in manufacturing, services (banking, insurance, dry port, education and
telecom), power sector and tourism industries.
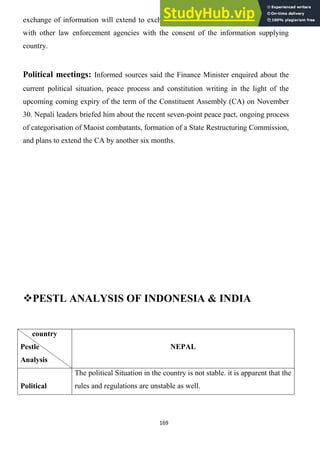
PESTEL Analysis
Politics of Nepal:
The Politics of Nepal function within a framework of a republic with a multi-party system.
Currently, the position of President (head of state) is occupied by Dr. Ram Baran
Yadav. The position of Prime Minister (head of government) is held by Dr. Baburam
Bhattarai.[1]
Executive power is exercised by the Prime Minister and his cabinet, while
legislative power is vested in the Constituent Assembly.
Though Nepal has witnessed great political instabilities in the recent past, the country
has a strong base of parliamentary democracy & constitutional monarchy.](https://image.slidesharecdn.com/aglobalcountrystudyandreport-230807175540-926289e0/85/A-GLOBAL-COUNTRY-STUDY-AND-REPORT-pdf-429-320.jpg)
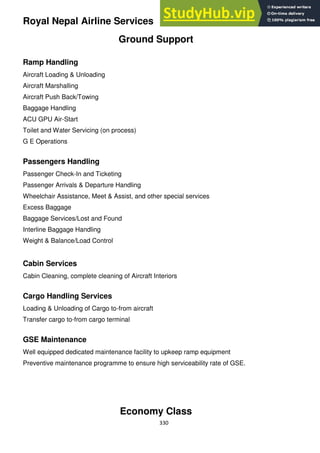
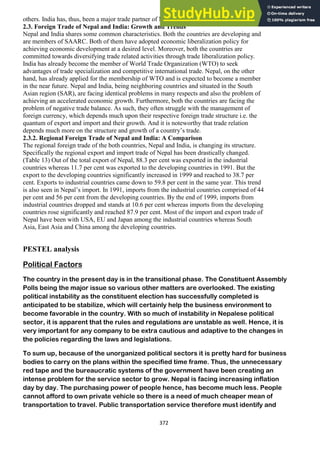
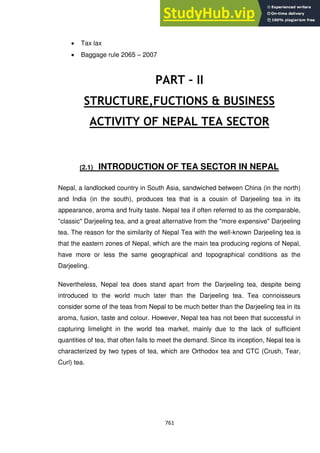
![430
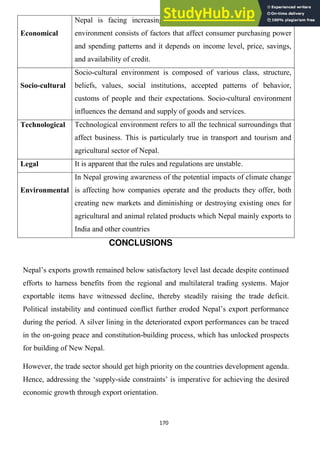
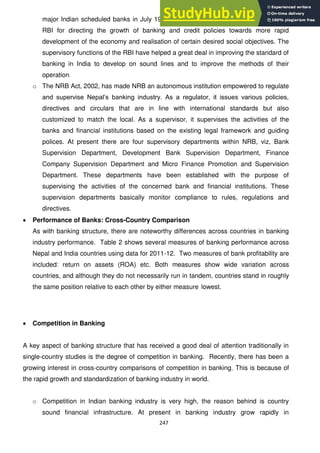
Economics of Nepal:
GDP Composition Agriculture: 40%, Industry: 22%, Services:
37%
GDP Real Growth Rate 4.9% (2000-2001)
Average Inflation Rate 2.1% (2000-2001)
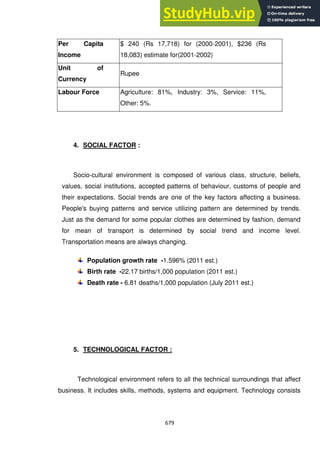
Per Capita Income $ 240 (Rs 17,718) for (2000-2001), $236 (Rs
18,083) estimate for(2001-2002)
Unit of Currency Rupee
Labour Force Agriculture: 81%, Industry: 3%, Service: 11%,
Other: 5%.
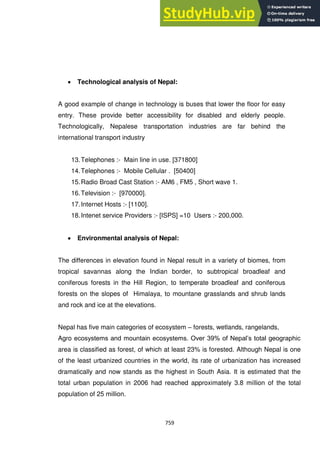
Social Analysis of Nepal:
Population: - 29391883 (July 2012 EST.)
Population Growth Rate :- 1.596%
Birth Rate :- 22.17 Birth / as per 1000 Population.
Death Rate :- 6.81 Death / as per 1000 Population
URBANIZATION :-
Urban Population: - 19% of Total Population.
Rate of Urbanization :- 4.7% Annual rate of change.
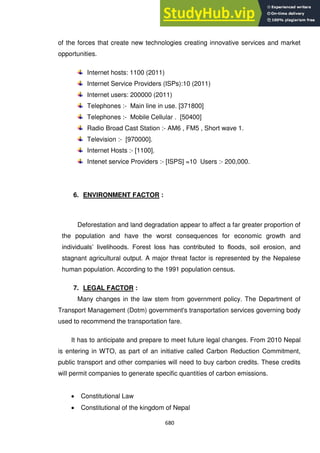
Technology of Nepal:
Businesses are continually developing new technologies to provide the best solutions
for the market place. Intelligent companies find out what the most appropriate
technologies are for their businesses and use them. This is particularly true in transport.
A good example of change in technology is buses that lower the floor for easy entry.
These provide better accessibility for disabled and elderly people. Technologically,
Nepalese transportation industries are far behind the international transport industry.
1. Telephones :- Main line in use. [371800]
2. Telephones :- Mobile Cellular . [50400]
3. Radio Broad Cast Station :- AM6 , FM5 , Short wave 1.
4. Television :- [970000].
5. Internet Hosts :- [1100].](https://image.slidesharecdn.com/aglobalcountrystudyandreport-230807175540-926289e0/85/A-GLOBAL-COUNTRY-STUDY-AND-REPORT-pdf-430-320.jpg)
![431
6. Internet service Providers :- [ISPS] =10 Users :- 200,000.
Environmental analysis of Nepal:
The dramatic differences in elevation found in Nepal result in a variety of biomes, from
tropical savannas along the Indian border, to subtropical broadleaf and coniferous
forests in the Hill Region, to temperate broadleaf and coniferous forests on the slopes
of the Himalaya, to montane grasslands and shrublands and rock and ice at the highest
elevations.
At the lowest elevations is the Terai-Duar savanna and grasslands ecoregion. These
form a mosaic with the Himalayan subtropical broadleaf forests, which occur from 500
to 1,000 metres (1,600 to 3,300 ft) and include the Inner Terai Valleys. Himalayan
subtropical pine forests occur between 1,000 and 2,000 metres (3,300 and 6,600 ft).
Above these elevations, the biogeography of Nepal is generally divided from east to
west by the Gandaki River. Ecoregions to the east tend to receive more precipitation
and to be more species-rich. Those to the west are drier with fewer species.
Legalization of Nepal:
Responsible businesses not only abide by the law, they seek to create standards above
minimum requirements. Public transportation has to be aware of a number of legal
factors. Legal changes that affect business are closely tied up with political ones. Many
changes in the law stem from government policy.
Constitutional Law
Constitutional of the kingdom of Nepal
Administration [Public Law 2047 (1990).
Citizenship Act ,1964
Civil service act , 2049 (1943)
Civil service act , 2049 (1993)
Criminal law](https://image.slidesharecdn.com/aglobalcountrystudyandreport-230807175540-926289e0/85/A-GLOBAL-COUNTRY-STUDY-AND-REPORT-pdf-431-320.jpg)


![497
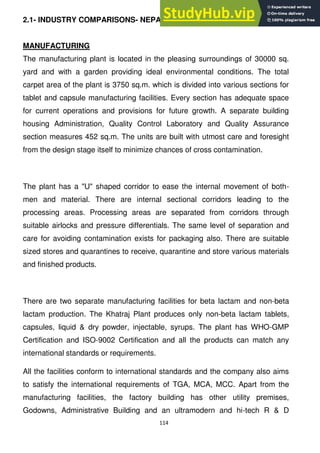
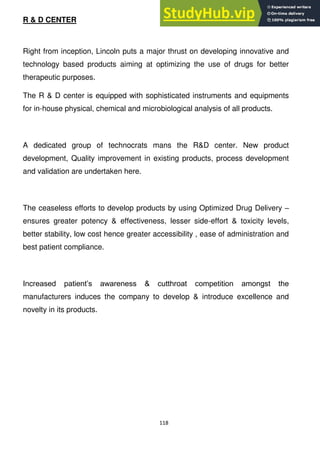
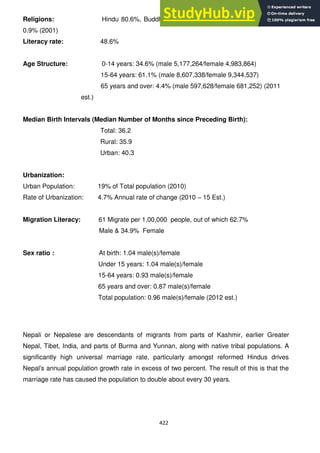
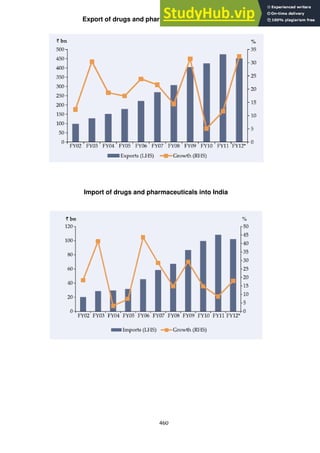
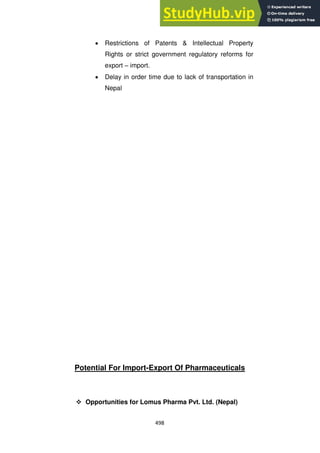
Export Products: Cardiovascular Drugs, Gastrointestinal Drugs,
Anti Inflammatory ,Analgestic Drugs, Antibiotic, Anti Infectives,
Vaccines, Immunomodulators, Anti-Diabetic Drugs, Vitamins,
Anti Allergic Drugs, Anti-Aids[Anti Retroviral] Therapy, Anti-
Cancer [Cytotoxic]Drugs, Ophthalmic Drugs, Veterinary products,
Expectorants, Bronchodilators, Anti-Asthmatic Drugs, Erectile
Dysfunction, Herbal Products.
Barriers:
Indian pharmaceutical company Cadila has sufficient at all
aspect of trade for import export but except following some
barriers:
Increasing span of price control due to government
policy. That create problem of profitability or limited
trade relations.
The expansion of capacities by certain leading
players has also fuelled competition in certain
product categories, which restricts margins of the
smaller players.
Low price erosion at competitive market at all or
market size for export is limited,
Despite the increasing expenditure on R&D, the
introduction of new molecules by Indian players has
been limited. It is, in fact, a hit-and-miss situation in
the field of discovery and developments of new
chemical entity (NCEs), where misses are more
than hits. Very few discoveries reach the final
stages of approvals, and in most of the cases, the
claim for patent gets stuck in legal battles.
Also due to rising expenditure in R&D , investment
in R&D is still low.](https://image.slidesharecdn.com/aglobalcountrystudyandreport-230807175540-926289e0/85/A-GLOBAL-COUNTRY-STUDY-AND-REPORT-pdf-497-320.jpg)
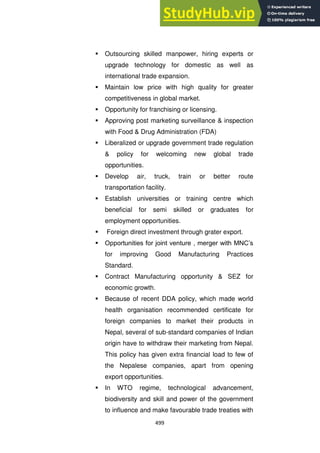


![540
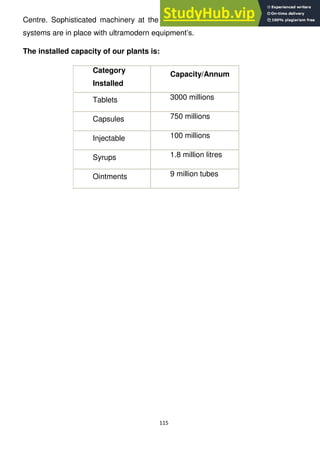
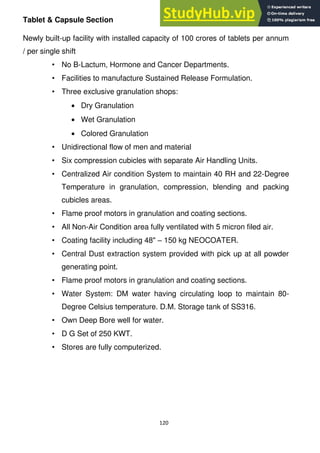
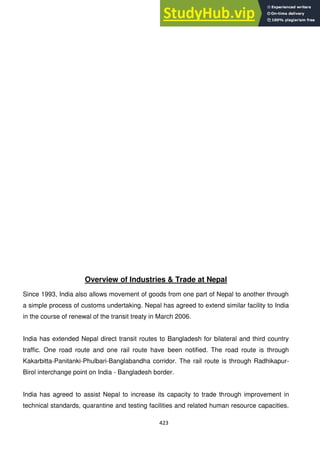
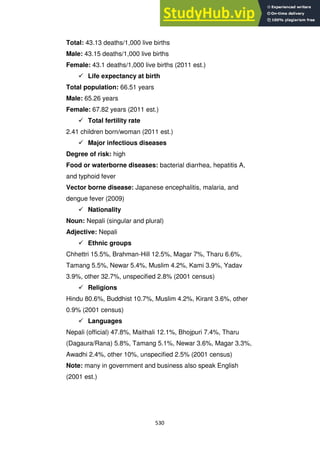
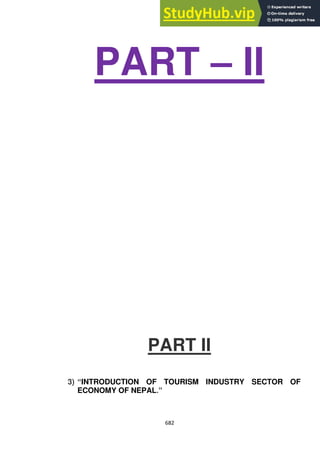
Age Structure :-
0 – 14 Years: - 34.6% [Male 5177264, Female
498364].
15-64 Years: - 61.1% [Male 8607338, Female
9344537].
65 – Years and over: - 4.4 % [Male 597628, Female
681252].
Urbanization :-
Urban Population: - 19% of Total Population.
Rate of Urbanization :- 4.7% Annual rate of change.
Technological Analysis:
A good example of change in technology is buses that lower
the floor for easy entry. These provide better accessibility
for disabled and elderly people. Technologically, Nepalese
transportation industries are far behind the international
transport industry
7. Telephones :- Main line in use. [371800]
8. Telephones :- Mobile Cellular . [50400]
9. Radio Broad Cast Station :- AM6 , FM5 , Short
wave 1.
10.Television :- [970000].
11.Internet Hosts :- [1100].
12.Intenet service Providers :- [ISPS] =10 Users :-
200,000.
Environmental analysis:
The dramatic differences in elevation found in Nepal result
in a variety of biomes, from tropical savannas along the
Indian border, to subtropical broadleaf and coniferous
forests in the Hill Region, to temperate broadleaf and](https://image.slidesharecdn.com/aglobalcountrystudyandreport-230807175540-926289e0/85/A-GLOBAL-COUNTRY-STUDY-AND-REPORT-pdf-540-320.jpg)


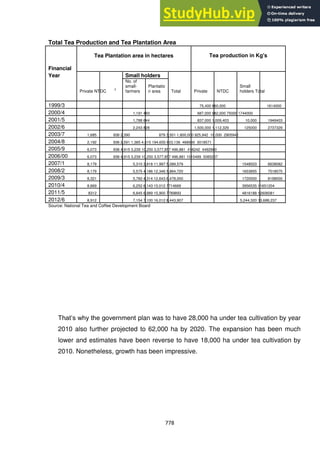

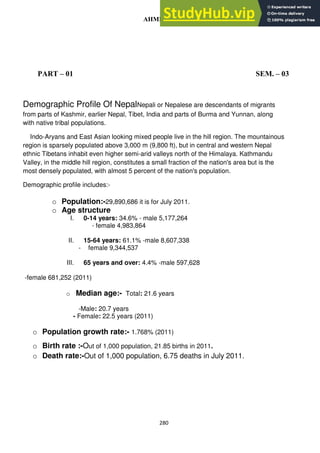
This document provides an overview and analysis of Nepal's agriculture sector and trade policies. It begins with an introduction to Nepal's economic reforms in the 1990s that made the economy more market-oriented. It then reviews Nepal's trade policies and industrial policies, noting the government's goal of promoting foreign investment. The document also discusses Nepal's largest trading partner (India), trends in bilateral trade, key industries and exports. It analyzes the investment environment in Nepal and provides context on macroeconomic stability.


