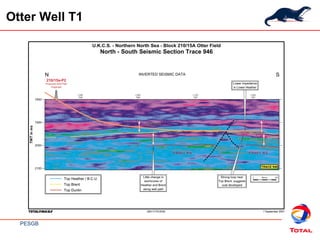
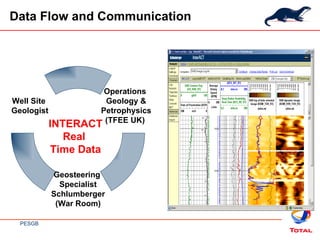
Introduction Introduction to Otter Drilling Targets & Requirements GeoVision Images and Geosteering Data-flow and Communication in the decision process Case Study Otter 210/15a-T1 Conclusions
Field Location
Otter Field Summary 36.5 api Oil density 443 scf/bbl GOR 78.5 C Temp 1970m SS  92m Standoff 2062m SS Crest  OWC Oct. 2002 subsea tie-back to Eider First Oil Approval 2001 Dev. Plan 2000 TotalFina 210/15a-6 Appraisal 1997 Fina 210/15a- DST 7650 BOPD Appraisal 1994 3D Seismic 1977 Philips 210/15-2 DST 4746 BOPD Discovery Brent Gp. Sandstones (98m thick N:G 90% Phi 24% Sw 32% Perm 400 mD Reservoir Easterly tilted fault block 4.3 km 2 Trap
Stratigraphy
Well T1
Otter Well T1
Geoteering Targets – Well T1 210 m 8 m T10 Sand   3000 m OWC N S
Geosteering Objectives Maintain Standoff from OWC Target Best Quality Rock (T10 sands) 8m target (upper part 4 m target) Avoid poor quality sandstones above T10 Avoid Coals in Top Ness immediately below T10 Reinterpret structure real time and adjust trajectory to account for sub-seismic faults
Geosteering Issues Lag time Time between receiving data and making the decision (analysis time) Time between making the decision and achieving the target objective (trajectory adjustment time) 4 deg per 30m, if you want to change the trajectory by 6 deg then 45 m is required Distance between the bit and the measurement device Things can change during the lag time Be prepared for the unexpected No real ‘look ahead’.  You can look up and look down but not ahead
GeoVision Resistivity Logging PowerDrive VADN PowerPulse MWD 6 bps for real-time image GVR Gamma Ray Azimuthal Ring   resistivity electrode  for high resolution laterolog resistivity Button Resistivity electrodes  for azimuthal images (deep, medium, shallow) PDC bit 3.5 m 21 m
GeoVision Resistivity Logging Recorded Mode Image 70 ft
GeoVision Resistivity Logging
Data Flow and Communication Operations  Geology & Petrophysics (TFEE UK)  Geosteering  Specialist Schlumberger (War Room) Well Site  Geologist INTERACT Real  Time Data
T1 Trajectory and Areas of Uncertainty Top Brent Sub-seismic faults Throw on main fault Coal? N S
Forward Model N S
Staying in the Target Zone OUT OF  TOLERANCE Target Zone 330 m of pay Ness plots as T20-T30 Caution
Landing the Well 9m low to prognosis Resistive Conductive
Landing the Well N S Dip = 4.7 deg  Azimuth = 294
Landing the well Good quality T10 Poorer quality T10 Actual Prognosis Good quality T10 Poorer quality T10 T20 T30 T20 T30
Faults 2770m 2770 m
Tagging The Coal In the Ness RHOBB RHOBU Penetrating Coal From Top Below Coal Above Coal Below Coal Above Coal 2810m 2770m Fault
Sub-Horizontal to Coal
Top Ness Coal & Sub-Seismic Faults N S
Problematic (Shaley?) Section Encountered 2840 m 2812 m Ness T10 Fault 2854 m N S Increased GR Decrease RT Separation of ROBB and ROBU – close to bed boundary- thin bed
Tagged Heather? 2810m 2854m T20/T30 L Heather T10 Prognosis Actual
Based on Image Dips - Structural Cross-Section Indicates Silty T10 Unit not Heather. N S
Main Fault BN/BS
Logging Response Into BS BN - Silty T10 BS Prognosis Into T10 Prognosis Into NESS
Dip as Expected – Maintain Pay Zone N S
Tagged Coal at TD (Top Ness Confirmed)
Pre-Drill N S
Post Drill Interpretation OWC 50 m Sand N/G: 95% (218 m) Pay N/G: 91% (210 m) Average Permeability: 1500 mD Average Porosity: 25% N S
Conclusions – Real Time Images Real time images and log data allow rapid adjustment of the structural model The well trajectory can be continually adjusted to maximise pay 4 deg per 30 m Side tracks can be avoided Reduced rig time Reduced well time Value added data for structural review and reservoir interpretation
Acknowledgements Logicom for 3D visualisation of RAB images  Otter Partnership

Otter Paper

  • 1.
  • 2.
    Introduction Introduction toOtter Drilling Targets & Requirements GeoVision Images and Geosteering Data-flow and Communication in the decision process Case Study Otter 210/15a-T1 Conclusions
  • 3.
  • 4.
    Otter Field Summary36.5 api Oil density 443 scf/bbl GOR 78.5 C Temp 1970m SS 92m Standoff 2062m SS Crest OWC Oct. 2002 subsea tie-back to Eider First Oil Approval 2001 Dev. Plan 2000 TotalFina 210/15a-6 Appraisal 1997 Fina 210/15a- DST 7650 BOPD Appraisal 1994 3D Seismic 1977 Philips 210/15-2 DST 4746 BOPD Discovery Brent Gp. Sandstones (98m thick N:G 90% Phi 24% Sw 32% Perm 400 mD Reservoir Easterly tilted fault block 4.3 km 2 Trap
  • 5.
  • 6.
  • 7.
  • 8.
    Geoteering Targets –Well T1 210 m 8 m T10 Sand 3000 m OWC N S
  • 9.
    Geosteering Objectives MaintainStandoff from OWC Target Best Quality Rock (T10 sands) 8m target (upper part 4 m target) Avoid poor quality sandstones above T10 Avoid Coals in Top Ness immediately below T10 Reinterpret structure real time and adjust trajectory to account for sub-seismic faults
  • 10.
    Geosteering Issues Lagtime Time between receiving data and making the decision (analysis time) Time between making the decision and achieving the target objective (trajectory adjustment time) 4 deg per 30m, if you want to change the trajectory by 6 deg then 45 m is required Distance between the bit and the measurement device Things can change during the lag time Be prepared for the unexpected No real ‘look ahead’. You can look up and look down but not ahead
  • 11.
    GeoVision Resistivity LoggingPowerDrive VADN PowerPulse MWD 6 bps for real-time image GVR Gamma Ray Azimuthal Ring resistivity electrode for high resolution laterolog resistivity Button Resistivity electrodes for azimuthal images (deep, medium, shallow) PDC bit 3.5 m 21 m
  • 12.
    GeoVision Resistivity LoggingRecorded Mode Image 70 ft
  • 13.
  • 14.
    Data Flow andCommunication Operations Geology & Petrophysics (TFEE UK) Geosteering Specialist Schlumberger (War Room) Well Site Geologist INTERACT Real Time Data
  • 15.
    T1 Trajectory andAreas of Uncertainty Top Brent Sub-seismic faults Throw on main fault Coal? N S
  • 16.
  • 17.
    Staying in theTarget Zone OUT OF TOLERANCE Target Zone 330 m of pay Ness plots as T20-T30 Caution
  • 18.
    Landing the Well9m low to prognosis Resistive Conductive
  • 19.
    Landing the WellN S Dip = 4.7 deg Azimuth = 294
  • 20.
    Landing the wellGood quality T10 Poorer quality T10 Actual Prognosis Good quality T10 Poorer quality T10 T20 T30 T20 T30
  • 21.
  • 22.
    Tagging The CoalIn the Ness RHOBB RHOBU Penetrating Coal From Top Below Coal Above Coal Below Coal Above Coal 2810m 2770m Fault
  • 23.
  • 24.
    Top Ness Coal& Sub-Seismic Faults N S
  • 25.
    Problematic (Shaley?) SectionEncountered 2840 m 2812 m Ness T10 Fault 2854 m N S Increased GR Decrease RT Separation of ROBB and ROBU – close to bed boundary- thin bed
  • 26.
    Tagged Heather? 2810m2854m T20/T30 L Heather T10 Prognosis Actual
  • 27.
    Based on ImageDips - Structural Cross-Section Indicates Silty T10 Unit not Heather. N S
  • 28.
    Based on ImageDips - Structural Cross-Section Indicates Silty T10 Unit not Heather. N S
  • 29.
  • 30.
    Logging Response IntoBS BN - Silty T10 BS Prognosis Into T10 Prognosis Into NESS
  • 31.
    Dip as Expected– Maintain Pay Zone N S
  • 32.
    Tagged Coal atTD (Top Ness Confirmed)
  • 33.
  • 34.
    Post Drill InterpretationOWC 50 m Sand N/G: 95% (218 m) Pay N/G: 91% (210 m) Average Permeability: 1500 mD Average Porosity: 25% N S
  • 35.
    Conclusions – RealTime Images Real time images and log data allow rapid adjustment of the structural model The well trajectory can be continually adjusted to maximise pay 4 deg per 30 m Side tracks can be avoided Reduced rig time Reduced well time Value added data for structural review and reservoir interpretation
  • 36.
    Acknowledgements Logicom for3D visualisation of RAB images Otter Partnership