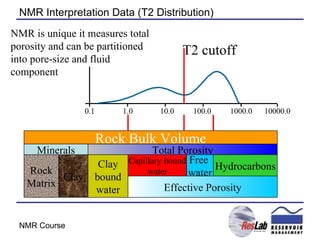
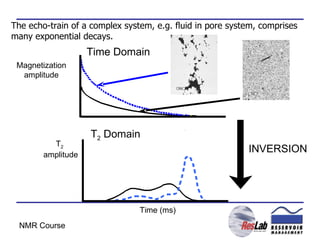
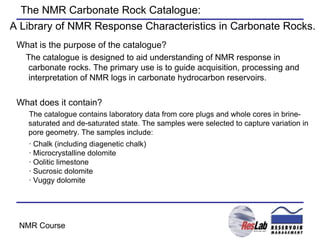
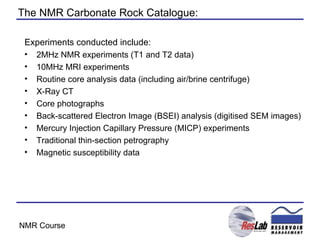
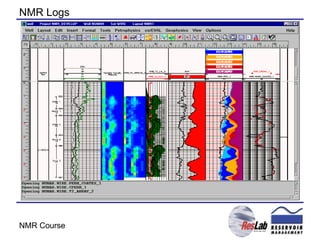
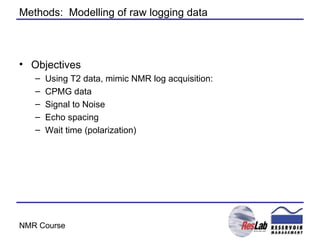
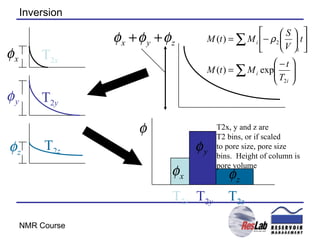
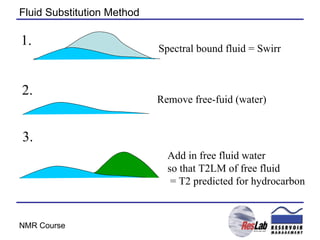
Forward Modelling NMR Log Response Using the Carbonate Rock catalogue Adam Moss,   ResLab ART Simon Stromberg,   Reservoir Management Ltd
Fluid identification (water and oils have different NMR properties) Hydrogen index Pore-size distributions Porosity Bound Fluid / Free Fluid via a T 2  cutoff Prediction of permeability Trend analysis and response typing to identify major bed/unit boundaries and flow units Identification of clays and asphaltines …  and potentially wettability What information can NMR achieve?
NMR Interpretation Data (T2 Distribution) 0.1 1.0 10.0 100.0 1000.0 10000.0 Rock Bulk Volume Rock Matrix Clay Clay bound water Total Porosity Effective Porosity Capillary bound water Free  water Hydrocarbons Minerals T2 cutoff NMR is unique it measures total porosity and can be partitioned into pore-size and fluid component
Fluid and T2 response 100 % Water saturated pores: Surface limited relaxation Pore-size information   Oil in water wet pores: Oil does not see pore wall Bulk relaxation Water sees pore wall Surface limited relaxation Relaxation is a function of film thickness  h   h
Hydrocarbon effect on T2 distribution 100% Brine Saturated Water wet with oil Producible water (free fluid) Bound fluid (irreducible water) Producible hydrocarbon (free fluid) Bound fluid (irreducible water) T2 increases since hydrocarbon Is not limited by pore-size T2 is limited by pore size in 100% Sw rocks
CPMG pulse sequence f s s s s s s f f f f f 90  180  180  180  echo echo 90  180  180  180  180  180  180 
The echo-train of a complex system, e.g. fluid in pore system, comprises many exponential decays. Time Domain T 2  Domain   INVERSION Magnetization amplitude T 2   amplitude Time (ms)
The NMR Carbonate Rock Catalogue: What is the purpose of the catalogue? The catalogue is designed to aid understanding of NMR response in carbonate rocks. The primary use is to guide acquisition, processing and interpretation of NMR logs in carbonate hydrocarbon reservoirs.  What does it contain? The catalogue contains laboratory data from core plugs and whole cores in brine-saturated and de-saturated state. The samples were selected to capture variation in pore geometry. The samples include: · Chalk (including diagenetic chalk) · Microcrystalline dolomite · Oolitic limestone · Sucrosic dolomite · Vuggy dolomite A Library of NMR Response Characteristics in Carbonate Rocks.
The NMR Carbonate Rock Catalogue: Experiments conducted include: 2MHz NMR experiments (T1 and T2 data) 10MHz MRI experiments Routine core analysis data (including air/brine centrifuge) X-Ray CT Core photographs Back-scattered Electron Image (BSEI) analysis (digitised SEM images) Mercury Injection Capillary Pressure (MICP) experiments Traditional thin-section petrography Magnetic susceptibility data
Chalk NMR and Mercury Injection Open Forams Matched Peaks
Diagenetic Chalk NMR and Mercury Injection Large Pores Matched Peaks
Microcrystalline Dolomite NMR and Mercury Injection Surface irregularities possibly associated with fractures  Matched Peaks
Oolites NMR and Mercury Injection Large pores are genuine rock features, seen in BESI. Intergranular pores associated with ooids  Matched Peaks
Vuggy Dolomite NMR and Mercury Injection Large pores are genuine rock features, seen in BESI. Intergranular pores assoc. with ooids   Diffusion Diffusive pore coupling
Analogue Data (Carbonate Rock Catalogue) chalk Diagenetic chalk Microcryst Dolomite Oolite Sucrosic dolomite Vuggy Dolomite
Philosophy Log NMR data can only be calibrated if the core data is reconfigured to simulate the logging response. Core data is used to forward model log response with appropriate acquisition parameters.
Methods Analogue core data (or calibration core) Modelling of raw logging data from analogue T2 data Match log acquisition parameters Fluid substitution Fluid property prediction Testing of processing & Interpretation parameters
NMR Logs
Analogue Data (Carbonate Rock Catalogue) chalk Diagenetic chalk Microcryst Dolomite Oolite Sucrosic dolomite Vuggy Dolomite
Methods:  Modelling of raw logging data Objectives Using T2 data, mimic NMR log acquisition: CPMG data Signal to Noise Echo spacing Wait time (polarization)
Inversion T 2 x T 2 y T 2 z
Inversion T 2 x T 2 y T 2 z T 2 x T 2 y T 2 z T2x, y and z are T2 bins, or if scaled to pore size, pore size bins.  Height of column is  pore volume
Modelling T 2 x T 2 y T 2 z T 2 x T 2 y T 2 z T2x, y and z are T2 bins, or if scaled to pore size, pore size bins.  Height of column is  pore volume
Modelling Example CMR data Echo spacing 200 u/sec Noise = 0.05 v/v (Gaussian Distribution) Wait time = 10 secs
Fluid modelling: Fluid and T2 bulk relaxation Oil viscosity and T2 (150 degF) Density of gas (150 degF)
Density and diffusion coefficient of gas 150 deg F
Fluid Substitution Predict fluid properties of hydrocarbon Calculate bound fluid T2 cutoff Spectral Bound Fluid Use core calibration (i.e. porous plate de-saturation) Remove free fluid from T2 distribution Substitute in ‘hydrocarbon’ with bulk properties Model raw data
Spectral Bound Fluid Model Bound fluid = Capillary bound + Surface film b W = f(T2) Carbonate Model: m = 0.0113; b = 1.
Fluid Substitution Method Spectral bound fluid = Swirr 2. Remove free-fuid (water) 3.  Add in free fluid water so that T2LM of free fluid  = T2 predicted for hydrocarbon 1.
Modelling Example 1: Optimising Inversion of Log Data Inversion: SVD T1 min = 0.3 T2 max = 3000 No Bins = 30 T2 maximum is not long enough to capture Long T2 associated with carbonate Analogue Model Inversion
Modelling Example 1: Optimising Inversion of Log Data Inversion: SVD T1 min = 5 T2 max = 5000 No Bins = 30 Analogue Model Inversion New bin range better captures the full T2 spectrum
Modelling example 2: Fluid Substitution 3 CP Oil T2 = 1130 msec (150 deg F) Analogue Model Inversion Fluid Sub
Modelling Example 3:  Decreased Wait Time (1 sec) Analogue Model Inversion Fluid Sub Tw = 1 sec Lost porosity With Tw = 1 sec
Conclusions NMR T2 distributions capture the whole pore size distribution, independently of pore arrangement.  Diffusion pore coupling may occur in samples with micro and macro pores.  Paramagnetic minerals can influence T2 distributions.
Conclusions Forward modelling from analogue or core calibration data Synthetic log data (Modelling) Fluid substitution Inversion Evaluate NMR log response and Interpretation Effect of acquisition parameters on T2 interpretation Evaluate effect of hydrocarbons Optimise inversion Parameters Investigate TW effects Make Better use of calibration core NMR data

Nmr Spwla Carbonates

  • 1.
    Forward Modelling NMRLog Response Using the Carbonate Rock catalogue Adam Moss, ResLab ART Simon Stromberg, Reservoir Management Ltd
  • 2.
    Fluid identification (waterand oils have different NMR properties) Hydrogen index Pore-size distributions Porosity Bound Fluid / Free Fluid via a T 2 cutoff Prediction of permeability Trend analysis and response typing to identify major bed/unit boundaries and flow units Identification of clays and asphaltines … and potentially wettability What information can NMR achieve?
  • 3.
    NMR Interpretation Data(T2 Distribution) 0.1 1.0 10.0 100.0 1000.0 10000.0 Rock Bulk Volume Rock Matrix Clay Clay bound water Total Porosity Effective Porosity Capillary bound water Free water Hydrocarbons Minerals T2 cutoff NMR is unique it measures total porosity and can be partitioned into pore-size and fluid component
  • 4.
    Fluid and T2response 100 % Water saturated pores: Surface limited relaxation Pore-size information Oil in water wet pores: Oil does not see pore wall Bulk relaxation Water sees pore wall Surface limited relaxation Relaxation is a function of film thickness h h
  • 5.
    Hydrocarbon effect onT2 distribution 100% Brine Saturated Water wet with oil Producible water (free fluid) Bound fluid (irreducible water) Producible hydrocarbon (free fluid) Bound fluid (irreducible water) T2 increases since hydrocarbon Is not limited by pore-size T2 is limited by pore size in 100% Sw rocks
  • 6.
    CPMG pulse sequencef s s s s s s f f f f f 90  180  180  180  echo echo 90  180  180  180  180  180  180 
  • 7.
    The echo-train ofa complex system, e.g. fluid in pore system, comprises many exponential decays. Time Domain T 2 Domain INVERSION Magnetization amplitude T 2 amplitude Time (ms)
  • 8.
    The NMR CarbonateRock Catalogue: What is the purpose of the catalogue? The catalogue is designed to aid understanding of NMR response in carbonate rocks. The primary use is to guide acquisition, processing and interpretation of NMR logs in carbonate hydrocarbon reservoirs. What does it contain? The catalogue contains laboratory data from core plugs and whole cores in brine-saturated and de-saturated state. The samples were selected to capture variation in pore geometry. The samples include: · Chalk (including diagenetic chalk) · Microcrystalline dolomite · Oolitic limestone · Sucrosic dolomite · Vuggy dolomite A Library of NMR Response Characteristics in Carbonate Rocks.
  • 9.
    The NMR CarbonateRock Catalogue: Experiments conducted include: 2MHz NMR experiments (T1 and T2 data) 10MHz MRI experiments Routine core analysis data (including air/brine centrifuge) X-Ray CT Core photographs Back-scattered Electron Image (BSEI) analysis (digitised SEM images) Mercury Injection Capillary Pressure (MICP) experiments Traditional thin-section petrography Magnetic susceptibility data
  • 10.
    Chalk NMR andMercury Injection Open Forams Matched Peaks
  • 11.
    Diagenetic Chalk NMRand Mercury Injection Large Pores Matched Peaks
  • 12.
    Microcrystalline Dolomite NMRand Mercury Injection Surface irregularities possibly associated with fractures Matched Peaks
  • 13.
    Oolites NMR andMercury Injection Large pores are genuine rock features, seen in BESI. Intergranular pores associated with ooids Matched Peaks
  • 14.
    Vuggy Dolomite NMRand Mercury Injection Large pores are genuine rock features, seen in BESI. Intergranular pores assoc. with ooids Diffusion Diffusive pore coupling
  • 15.
    Analogue Data (CarbonateRock Catalogue) chalk Diagenetic chalk Microcryst Dolomite Oolite Sucrosic dolomite Vuggy Dolomite
  • 16.
    Philosophy Log NMRdata can only be calibrated if the core data is reconfigured to simulate the logging response. Core data is used to forward model log response with appropriate acquisition parameters.
  • 17.
    Methods Analogue coredata (or calibration core) Modelling of raw logging data from analogue T2 data Match log acquisition parameters Fluid substitution Fluid property prediction Testing of processing & Interpretation parameters
  • 18.
  • 19.
    Analogue Data (CarbonateRock Catalogue) chalk Diagenetic chalk Microcryst Dolomite Oolite Sucrosic dolomite Vuggy Dolomite
  • 20.
    Methods: Modellingof raw logging data Objectives Using T2 data, mimic NMR log acquisition: CPMG data Signal to Noise Echo spacing Wait time (polarization)
  • 21.
    Inversion T 2x T 2 y T 2 z
  • 22.
    Inversion T 2x T 2 y T 2 z T 2 x T 2 y T 2 z T2x, y and z are T2 bins, or if scaled to pore size, pore size bins. Height of column is pore volume
  • 23.
    Modelling T 2x T 2 y T 2 z T 2 x T 2 y T 2 z T2x, y and z are T2 bins, or if scaled to pore size, pore size bins. Height of column is pore volume
  • 24.
    Modelling Example CMRdata Echo spacing 200 u/sec Noise = 0.05 v/v (Gaussian Distribution) Wait time = 10 secs
  • 25.
    Fluid modelling: Fluidand T2 bulk relaxation Oil viscosity and T2 (150 degF) Density of gas (150 degF)
  • 26.
    Density and diffusioncoefficient of gas 150 deg F
  • 27.
    Fluid Substitution Predictfluid properties of hydrocarbon Calculate bound fluid T2 cutoff Spectral Bound Fluid Use core calibration (i.e. porous plate de-saturation) Remove free fluid from T2 distribution Substitute in ‘hydrocarbon’ with bulk properties Model raw data
  • 28.
    Spectral Bound FluidModel Bound fluid = Capillary bound + Surface film b W = f(T2) Carbonate Model: m = 0.0113; b = 1.
  • 29.
    Fluid Substitution MethodSpectral bound fluid = Swirr 2. Remove free-fuid (water) 3. Add in free fluid water so that T2LM of free fluid = T2 predicted for hydrocarbon 1.
  • 30.
    Modelling Example 1:Optimising Inversion of Log Data Inversion: SVD T1 min = 0.3 T2 max = 3000 No Bins = 30 T2 maximum is not long enough to capture Long T2 associated with carbonate Analogue Model Inversion
  • 31.
    Modelling Example 1:Optimising Inversion of Log Data Inversion: SVD T1 min = 5 T2 max = 5000 No Bins = 30 Analogue Model Inversion New bin range better captures the full T2 spectrum
  • 32.
    Modelling example 2:Fluid Substitution 3 CP Oil T2 = 1130 msec (150 deg F) Analogue Model Inversion Fluid Sub
  • 33.
    Modelling Example 3: Decreased Wait Time (1 sec) Analogue Model Inversion Fluid Sub Tw = 1 sec Lost porosity With Tw = 1 sec
  • 34.
    Conclusions NMR T2distributions capture the whole pore size distribution, independently of pore arrangement. Diffusion pore coupling may occur in samples with micro and macro pores. Paramagnetic minerals can influence T2 distributions.
  • 35.
    Conclusions Forward modellingfrom analogue or core calibration data Synthetic log data (Modelling) Fluid substitution Inversion Evaluate NMR log response and Interpretation Effect of acquisition parameters on T2 interpretation Evaluate effect of hydrocarbons Optimise inversion Parameters Investigate TW effects Make Better use of calibration core NMR data