Download to read offline
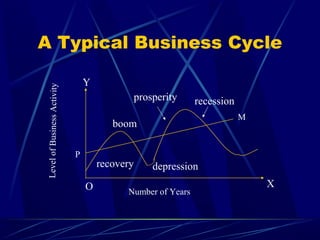

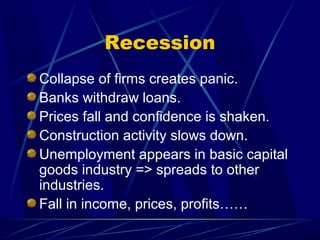


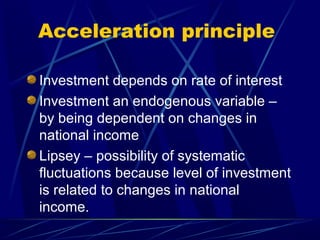
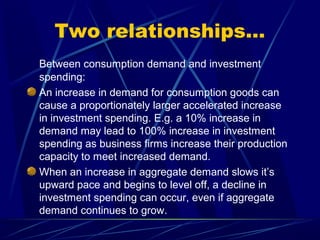
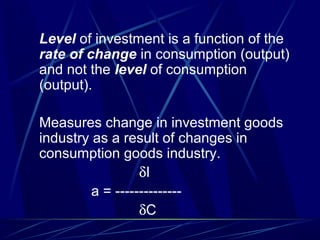
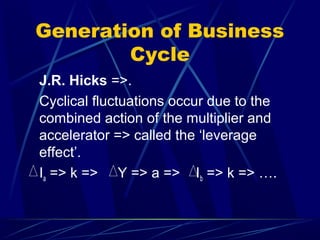
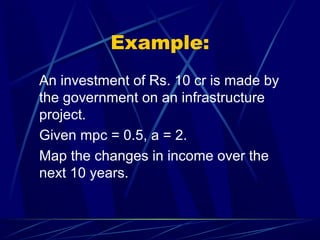
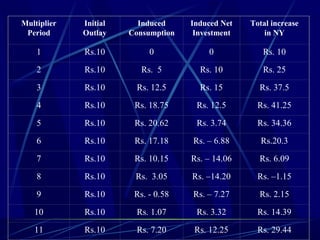
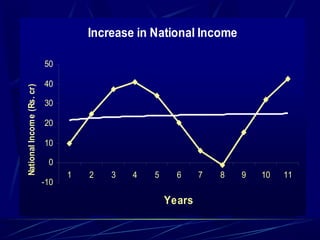

This document discusses business cycles and theories of business cycles. It defines business cycles as alternating periods of economic prosperity and depression, characterized by fluctuations in production, prices, employment, and other economic indicators. Several theories of business cycles are presented, including monetary, psychological, overproduction, underconsumption, innovation, and accelerator theories. The multiplier-accelerator model is described as a way fluctuations can be generated through the interaction of investment, consumption, and aggregate demand. Methods to control business cycles discussed include monetary policy, fiscal policy, and automatic stabilizers.


