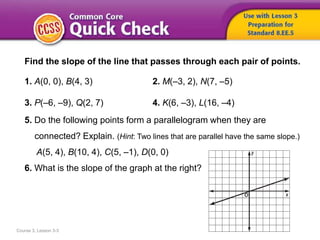
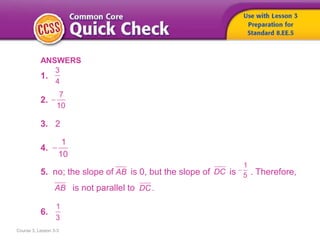
Course 3, Lesson 3-3
Find the slope of the line that passes through each pair of points.
1. A(0, 0), B(4, 3) 2. M(–3, 2), N(7, –5)
3. P(–6, –9), Q(2, 7) 4. K(6, –3), L(16, –4)
5. Do the following points form a parallelogram when they are
connected? Explain. (Hint: Two lines that are parallel have the same slope.)
A(5, 4), B(10, 4), C(5, –1), D(0, 0)
6. What is the slope of the graph at the right?
Course 3, Lesson 3-3
ANSWERS
1.
2.
3. 2
4.
5. no; the slope of is 0, but the slope of is . Therefore,
is not parallel to .
6.
3
4
7
10

1
10

AB DC
1
5

AB DC
1
3
WHY are graphs helpful?
Expressions and Equations
Course 3, Lesson 3-3
• 8.EE.5
Graph proportional relationships, interpreting the unit rate as the slope
of the graph. Compare two different proportional relationships
represented in different ways.
• 8.EE.6
Use similar triangles to explain why the slope m is the same between
any two distinct points on a non-vertical line in the coordinate plane;
derive the equation y = mx for a line through the origin and the
equation y = mx + b for a line intercepting the vertical axis at b.
Course 3, Lesson 3-3 Common Core State Standards © Copyright 2010. National Governors Association Center for Best Practices and Council of
Chief State School Officers. All rights reserved.
Expressions and Equations
• 8.F.2
Compare properties of two functions each represented in a different
way (algebraically, graphically, numerically in tables, or by verbal
descriptions).
• 8.F.4
Construct a function to model a linear relationship between two
quantities. Determine the rate of change and initial value of the
function from a description of a relationship or from two (x, y) values,
including reading these from a table or from a graph. Interpret the rate
of change and initial value of a linear function in terms of the situation it
models, and in terms of its graph or a table of values.
Course 3, Lesson 3-3 Common Core State Standards © Copyright 2010. National Governors Association Center for Best Practices and Council of
Chief State School Officers. All rights reserved.
Expressions and Equations
Mathematical Practices
1 Make sense of problems and persevere in solving them.
3 Construct viable arguments and critique the reasoning of others.
4 Model with mathematics.
Course 3, Lesson 3-3 Common Core State Standards © Copyright 2010. National Governors Association Center for Best Practices and Council of
Chief State School Officers. All rights reserved.
Expressions and Equations
To
• write and solve direct variation
equations,
• compare direct variations by using
equations or graphs
Course 3, Lesson 3-3
Expressions and Equations
• direct variation
• constant of variation
• constant of proportionality
Course 3, Lesson 3-3
Expressions and Equations
Course 3, Lesson 3-3
Expressions and Equations
Words A linear relationship is a direct
variation when the ratio of y to x is
a constant, m. We say y varies
directly with x.
Symbols m = or y = mx, where m is the
constant of variation and m 0
Example y = 3x
y
x

1
Need Another Example?
2
3
Step-by-Step Example
1. The amount of money Robin earns while
babysitting varies directly with the time as
shown in the graph. Determine the amount
that Robin earns per hour.
To determine the amount Robin
earns per hour, or the unit rate,
find the constant of variation.
Use the points (2, 15), (3, 22.5), and (4, 30).
So, Robin earned $7.50 for each hour she babysits.
Answer
Need Another Example?
The amount of money Serena
earns at her job is shown on the
graph. Determine the amount
Serena earns per hour.
$10 per hour
1
Need Another Example?
2
3
Step-by-Step Example
2. A cyclist can ride 3 miles in 0.25 hour. Assume that the distance
biked in miles y varies directly with time in hours x. This situation
can be represented by y = 12x. Graph the equation. How far can
the cyclist ride per hour?
Make a table of values. Then graph the equation y = 12x.
In a direct variation equation, m represents the slope. So,
the slope of the line is .
The unit rate is the slope of the line. So, the cyclist can ride
12 miles per hour.
Answer
Need Another Example?
Some types of bamboo can grow 7 inches in 3.5 hours.
Assume that the height y varies directly with the time x. This
situation can be represented by the equation y = 2x. Graph
the equation. How fast can the bamboo grow per hour?
2 inches per hour
Course 3, Lesson 3-3
Expressions and Equations
You can use tables, graphs, words, or equations to represent and compare
proportional relationships.
Words y varies directly with x
Equation
1
5
y x
Table Graph
1
Need Another Example?
2
3
Step-by-Step Example
3. The distance y in miles covered
by a rabbit in x hours can be
represented by the equation
y = 35x. The distance covered
by a grizzly bear is shown on
the graph. Which animal is
faster? Explain.
The slope or unit rate is 35 mph.
Since 35 > 30, the rabbit is the faster animal.
Rabbit y = 35x
Grizzly Bear Find the slope of the graph.
1
30
Answer
Need Another Example?
Mike spent the amounts shown in the table on
tokens at Playtime Games.
Tokens at Game Time are $0.25 per token. Which
arcade has the best price for tokens? Explain.
Playtime Games; Sample answer: The unit for
Playtime Games is $0.20 per token and the unit
rate for Game Time is $0.25 per token.
1
Need Another Example?
2
3
4
5
6
Step-by-Step Example
4. A 3-year-old dog is often considered to be 21 in human years.
Assume that the equivalent age in human years y varies directly
with its age as a dog x. Write and solve a direct variation equation
to find the human-year age of a dog that is 6 years old.
So, when a dog is 6 years old, the
equivalent age in human years is 42.
Graph the equation y = 7x.
Let x represent the dog’s actual age and let y represent the human-equivalent age.
You want to know the human-year age or y-value when the dog is 6 years old.
y = mx Direct variation
21 = m(3) y = 21, x = 3
7 = m Simplify.
y = 7x Replace m with 7
y = 7x Write the equation.
y = 7 • 6 x = 6
y = 42 Simplify.
The y-value when x = 6 is 42.
Check
Answer
Need Another Example?
At a certain store, four cans of soup cost $5. Assume the
total cost is directly proportional to the number of cans
purchased. Write and solve a direct variation equation to
find how much it would cost to buy 10 cans of soup.
y = 1.25x; $12.50
How did what you learned
today help you answer the
WHY are graphs helpful?
Course 3, Lesson 3-3
Expressions and Equations
How did what you learned
today help you answer the
WHY are graphs helpful?
Course 3, Lesson 3-3
Expressions and Equations
Sample answers:
• You can use graphs to compare different direct
variation relationships.
• You can find the unit rate in a relationship by looking at
a graph of the relationship.
Explain what a constant
of variation is in a
direct variation.
Ratios and Proportional RelationshipsExpressions and Equations
Course 3, Lesson 3-3

(8) Lesson 3.3

  • 1.
    Course 3, Lesson3-3 Find the slope of the line that passes through each pair of points. 1. A(0, 0), B(4, 3) 2. M(–3, 2), N(7, –5) 3. P(–6, –9), Q(2, 7) 4. K(6, –3), L(16, –4) 5. Do the following points form a parallelogram when they are connected? Explain. (Hint: Two lines that are parallel have the same slope.) A(5, 4), B(10, 4), C(5, –1), D(0, 0) 6. What is the slope of the graph at the right?
  • 2.
    Course 3, Lesson3-3 ANSWERS 1. 2. 3. 2 4. 5. no; the slope of is 0, but the slope of is . Therefore, is not parallel to . 6. 3 4 7 10  1 10  AB DC 1 5  AB DC 1 3
  • 3.
    WHY are graphshelpful? Expressions and Equations Course 3, Lesson 3-3
  • 4.
    • 8.EE.5 Graph proportionalrelationships, interpreting the unit rate as the slope of the graph. Compare two different proportional relationships represented in different ways. • 8.EE.6 Use similar triangles to explain why the slope m is the same between any two distinct points on a non-vertical line in the coordinate plane; derive the equation y = mx for a line through the origin and the equation y = mx + b for a line intercepting the vertical axis at b. Course 3, Lesson 3-3 Common Core State Standards © Copyright 2010. National Governors Association Center for Best Practices and Council of Chief State School Officers. All rights reserved. Expressions and Equations
  • 5.
    • 8.F.2 Compare propertiesof two functions each represented in a different way (algebraically, graphically, numerically in tables, or by verbal descriptions). • 8.F.4 Construct a function to model a linear relationship between two quantities. Determine the rate of change and initial value of the function from a description of a relationship or from two (x, y) values, including reading these from a table or from a graph. Interpret the rate of change and initial value of a linear function in terms of the situation it models, and in terms of its graph or a table of values. Course 3, Lesson 3-3 Common Core State Standards © Copyright 2010. National Governors Association Center for Best Practices and Council of Chief State School Officers. All rights reserved. Expressions and Equations
  • 6.
    Mathematical Practices 1 Makesense of problems and persevere in solving them. 3 Construct viable arguments and critique the reasoning of others. 4 Model with mathematics. Course 3, Lesson 3-3 Common Core State Standards © Copyright 2010. National Governors Association Center for Best Practices and Council of Chief State School Officers. All rights reserved. Expressions and Equations
  • 7.
    To • write andsolve direct variation equations, • compare direct variations by using equations or graphs Course 3, Lesson 3-3 Expressions and Equations
  • 8.
    • direct variation •constant of variation • constant of proportionality Course 3, Lesson 3-3 Expressions and Equations
  • 9.
    Course 3, Lesson3-3 Expressions and Equations Words A linear relationship is a direct variation when the ratio of y to x is a constant, m. We say y varies directly with x. Symbols m = or y = mx, where m is the constant of variation and m 0 Example y = 3x y x 
  • 10.
    1 Need Another Example? 2 3 Step-by-StepExample 1. The amount of money Robin earns while babysitting varies directly with the time as shown in the graph. Determine the amount that Robin earns per hour. To determine the amount Robin earns per hour, or the unit rate, find the constant of variation. Use the points (2, 15), (3, 22.5), and (4, 30). So, Robin earned $7.50 for each hour she babysits.
  • 11.
    Answer Need Another Example? Theamount of money Serena earns at her job is shown on the graph. Determine the amount Serena earns per hour. $10 per hour
  • 12.
    1 Need Another Example? 2 3 Step-by-StepExample 2. A cyclist can ride 3 miles in 0.25 hour. Assume that the distance biked in miles y varies directly with time in hours x. This situation can be represented by y = 12x. Graph the equation. How far can the cyclist ride per hour? Make a table of values. Then graph the equation y = 12x. In a direct variation equation, m represents the slope. So, the slope of the line is . The unit rate is the slope of the line. So, the cyclist can ride 12 miles per hour.
  • 13.
    Answer Need Another Example? Sometypes of bamboo can grow 7 inches in 3.5 hours. Assume that the height y varies directly with the time x. This situation can be represented by the equation y = 2x. Graph the equation. How fast can the bamboo grow per hour? 2 inches per hour
  • 14.
    Course 3, Lesson3-3 Expressions and Equations You can use tables, graphs, words, or equations to represent and compare proportional relationships. Words y varies directly with x Equation 1 5 y x Table Graph
  • 15.
    1 Need Another Example? 2 3 Step-by-StepExample 3. The distance y in miles covered by a rabbit in x hours can be represented by the equation y = 35x. The distance covered by a grizzly bear is shown on the graph. Which animal is faster? Explain. The slope or unit rate is 35 mph. Since 35 > 30, the rabbit is the faster animal. Rabbit y = 35x Grizzly Bear Find the slope of the graph. 1 30
  • 16.
    Answer Need Another Example? Mikespent the amounts shown in the table on tokens at Playtime Games. Tokens at Game Time are $0.25 per token. Which arcade has the best price for tokens? Explain. Playtime Games; Sample answer: The unit for Playtime Games is $0.20 per token and the unit rate for Game Time is $0.25 per token.
  • 17.
    1 Need Another Example? 2 3 4 5 6 Step-by-StepExample 4. A 3-year-old dog is often considered to be 21 in human years. Assume that the equivalent age in human years y varies directly with its age as a dog x. Write and solve a direct variation equation to find the human-year age of a dog that is 6 years old. So, when a dog is 6 years old, the equivalent age in human years is 42. Graph the equation y = 7x. Let x represent the dog’s actual age and let y represent the human-equivalent age. You want to know the human-year age or y-value when the dog is 6 years old. y = mx Direct variation 21 = m(3) y = 21, x = 3 7 = m Simplify. y = 7x Replace m with 7 y = 7x Write the equation. y = 7 • 6 x = 6 y = 42 Simplify. The y-value when x = 6 is 42. Check
  • 18.
    Answer Need Another Example? Ata certain store, four cans of soup cost $5. Assume the total cost is directly proportional to the number of cans purchased. Write and solve a direct variation equation to find how much it would cost to buy 10 cans of soup. y = 1.25x; $12.50
  • 19.
    How did whatyou learned today help you answer the WHY are graphs helpful? Course 3, Lesson 3-3 Expressions and Equations
  • 20.
    How did whatyou learned today help you answer the WHY are graphs helpful? Course 3, Lesson 3-3 Expressions and Equations Sample answers: • You can use graphs to compare different direct variation relationships. • You can find the unit rate in a relationship by looking at a graph of the relationship.
  • 21.
    Explain what aconstant of variation is in a direct variation. Ratios and Proportional RelationshipsExpressions and Equations Course 3, Lesson 3-3