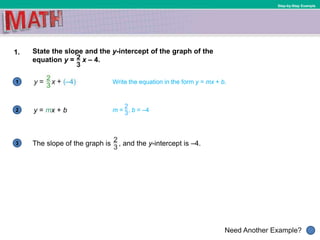
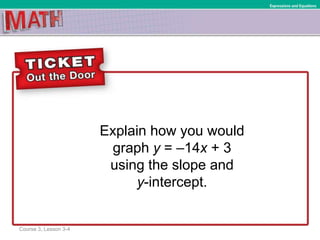
Course 3, Lesson 3-4
For Exercises 1–2, refer to the graph.
1. The amount of money Aisha earns
varies directly with the number of hours
she works at the bookstore. What is the
ratio of money earned to hours worked?
2. Continuing at the rate shown, how much
will Aisha have earned after working 21
hours?
3. Determine whether the linear function given in the table is a direct
variation. If so, state the constant of variation.
Course 3, Lesson 3-4
ANSWERS
1. $8.00 per hour
2. $168
3. yes, 0.8
WHY are graphs helpful?
Expressions and Equations
Course 3, Lesson 3-4
• 8.EE.6
Use similar triangles to explain why the slope m is the same between
any two distinct points on a non-vertical line in the coordinate plane;
derive the equation y = mx for a line through the origin and the
equation y = mx + b for a line intercepting the vertical axis at b.
• 8.F.3
Interpret the equation y = mx + b as defining a linear function, whose
graph is a straight line.
Course 3, Lesson 3-4 Common Core State Standards © Copyright 2010. National Governors Association Center for Best Practices and Council of
Chief State School Officers. All rights reserved.
Expressions and Equations
Course 3, Lesson 3-4 Common Core State Standards © Copyright 2010. National Governors Association Center for Best Practices and Council
of Chief State School Officers. All rights reserved.
Expressions and Equations
• 8.F.4
Construct a function to model a linear relationship between two
quantities. Determine the rate of change and initial value of the function
from a description of a relationship or from two (x, y) values, including
reading these from a table or from a graph. Interpret the rate of change
and initial value of a linear function in terms of the situation it models,
and in terms of its graph or a table of values.
Mathematical Practices
1 Make sense of problems and persevere in solving them.
3 Construct viable arguments and critique the reasoning of others.
4 Model with mathematics.
To
• determine the slope and y-intercept
of a graph
• write an equation of a line in slope-
intercept form
Course 3, Lesson 3-4
Expressions and Equations
• y-intercept
• slope-intercept form
Course 3, Lesson 3-4
Expressions and Equations
1
Need Another Example?
2
3
Step-by-Step Example
1. State the slope and the y-intercept of the graph of the
equation y = x – 4.
The slope of the graph is , and the y-intercept is –4.
y = mx + b
Write the equation in the form y = mx + b.
m = , b = –4
Answer
Need Another Example?
State the slope and y-intercept of the graph of
the equation y = x − 5.
Need Another Example?
Step-by-Step Example
2. Write an equation of a line in slope-intercept form
with a slope of –3 and a y-intercept of –4.
1
2
3 y = –3x – 4
y = mx + b Slope-intercept form
Replace m with –3 and b with –4.y = –3x + (–4)
Simplify.
Answer
Need Another Example?
Write an equation of a line in slope-intercept
form with a slope of –3 and a y-intercept –8.
y = –3x – 8
1
Need Another Example?
2
3
4
Step-by-Step Example
3. Write an equation in slope-intercept
form for the graph shown.
y = – x + 4
The y-intercept is 4. From (0, 4), you
move down 1 unit and right 2 units to
another point on the line.
Slope-intercept formy = mx + b
Replace m with – and b with 4
So, the slope is – .
Answer
Need Another Example?
Write an equation in
slope-intercept form
for the graph shown.
y = − x + 1
1
Need Another Example?
2
3
Step-by-Step Example
4. Student Council is selling T-shirts during spirit week. It costs
$20 for the design and $5 to print each shirt. The cost y to
print x shirts is given by y = 5x + 20. Graph y = 5x + 20 using
the slope and y-intercept.
Find the slope and y-intercept.
y = 5x + 20 slope = 5
y-intercept = 20
Write the slope 5 as . Use it to locate a second point on
the line. Go up 5 units and right 1 unit. Then draw a line
through the points.
Graph the y-intercept (0, 20).
Answer
Need Another Example?
Write an equation in slope-intercept
form for the graph shown.
1
Need Another Example?
Step-by-Step Example
5. Student Council is selling T-shirts during spirit week.
It costs $20 for the design and $5 to print each shirt.
The cost y to print x shirts is given by y = 5x + 20.
Interpret the slope and y-intercept.
The slope 5 represents the cost in dollars per T-shirt. The
y-intercept 20 is the one-time charge in dollars for the
design.
Answer
Need Another Example?
A kayak rental pavilion charges $15.00 per hour
and $2.50 for a brief lesson on kayak safety. The
total cost y to rent the kayak for x hours is given
by y = 15x + 2.5. Interpret the slope and y-intercept.
The slope 15 represents the rate of change or
cost per hour. The y-intercept 2.5 is the charge
for instruction.
How did what you learned
today help you answer the
WHY are graphs helpful?
Course 3, Lesson 3-4
Expressions and Equations
How did what you learned
today help you answer the
WHY are graphs helpful?
Course 3, Lesson 3-4
Expressions and Equations
Sample answers:
• If a nonproportional linear relationship is graphed, you
can easily determine the slope and y-intercept.
• When the relationship is graphed, you can interpret the
slope and y-intercept.
Explain how you would
graph y = –14x + 3
using the slope and
y-intercept.
Ratios and Proportional RelationshipsExpressions and Equations
Course 3, Lesson 3-4

(8) Lesson 3.4

  • 1.
    Course 3, Lesson3-4 For Exercises 1–2, refer to the graph. 1. The amount of money Aisha earns varies directly with the number of hours she works at the bookstore. What is the ratio of money earned to hours worked? 2. Continuing at the rate shown, how much will Aisha have earned after working 21 hours? 3. Determine whether the linear function given in the table is a direct variation. If so, state the constant of variation.
  • 2.
    Course 3, Lesson3-4 ANSWERS 1. $8.00 per hour 2. $168 3. yes, 0.8
  • 3.
    WHY are graphshelpful? Expressions and Equations Course 3, Lesson 3-4
  • 4.
    • 8.EE.6 Use similartriangles to explain why the slope m is the same between any two distinct points on a non-vertical line in the coordinate plane; derive the equation y = mx for a line through the origin and the equation y = mx + b for a line intercepting the vertical axis at b. • 8.F.3 Interpret the equation y = mx + b as defining a linear function, whose graph is a straight line. Course 3, Lesson 3-4 Common Core State Standards © Copyright 2010. National Governors Association Center for Best Practices and Council of Chief State School Officers. All rights reserved. Expressions and Equations
  • 5.
    Course 3, Lesson3-4 Common Core State Standards © Copyright 2010. National Governors Association Center for Best Practices and Council of Chief State School Officers. All rights reserved. Expressions and Equations • 8.F.4 Construct a function to model a linear relationship between two quantities. Determine the rate of change and initial value of the function from a description of a relationship or from two (x, y) values, including reading these from a table or from a graph. Interpret the rate of change and initial value of a linear function in terms of the situation it models, and in terms of its graph or a table of values. Mathematical Practices 1 Make sense of problems and persevere in solving them. 3 Construct viable arguments and critique the reasoning of others. 4 Model with mathematics.
  • 6.
    To • determine theslope and y-intercept of a graph • write an equation of a line in slope- intercept form Course 3, Lesson 3-4 Expressions and Equations
  • 7.
    • y-intercept • slope-interceptform Course 3, Lesson 3-4 Expressions and Equations
  • 8.
    1 Need Another Example? 2 3 Step-by-StepExample 1. State the slope and the y-intercept of the graph of the equation y = x – 4. The slope of the graph is , and the y-intercept is –4. y = mx + b Write the equation in the form y = mx + b. m = , b = –4
  • 9.
    Answer Need Another Example? Statethe slope and y-intercept of the graph of the equation y = x − 5.
  • 10.
    Need Another Example? Step-by-StepExample 2. Write an equation of a line in slope-intercept form with a slope of –3 and a y-intercept of –4. 1 2 3 y = –3x – 4 y = mx + b Slope-intercept form Replace m with –3 and b with –4.y = –3x + (–4) Simplify.
  • 11.
    Answer Need Another Example? Writean equation of a line in slope-intercept form with a slope of –3 and a y-intercept –8. y = –3x – 8
  • 12.
    1 Need Another Example? 2 3 4 Step-by-StepExample 3. Write an equation in slope-intercept form for the graph shown. y = – x + 4 The y-intercept is 4. From (0, 4), you move down 1 unit and right 2 units to another point on the line. Slope-intercept formy = mx + b Replace m with – and b with 4 So, the slope is – .
  • 13.
    Answer Need Another Example? Writean equation in slope-intercept form for the graph shown. y = − x + 1
  • 14.
    1 Need Another Example? 2 3 Step-by-StepExample 4. Student Council is selling T-shirts during spirit week. It costs $20 for the design and $5 to print each shirt. The cost y to print x shirts is given by y = 5x + 20. Graph y = 5x + 20 using the slope and y-intercept. Find the slope and y-intercept. y = 5x + 20 slope = 5 y-intercept = 20 Write the slope 5 as . Use it to locate a second point on the line. Go up 5 units and right 1 unit. Then draw a line through the points. Graph the y-intercept (0, 20).
  • 15.
    Answer Need Another Example? Writean equation in slope-intercept form for the graph shown.
  • 16.
    1 Need Another Example? Step-by-StepExample 5. Student Council is selling T-shirts during spirit week. It costs $20 for the design and $5 to print each shirt. The cost y to print x shirts is given by y = 5x + 20. Interpret the slope and y-intercept. The slope 5 represents the cost in dollars per T-shirt. The y-intercept 20 is the one-time charge in dollars for the design.
  • 17.
    Answer Need Another Example? Akayak rental pavilion charges $15.00 per hour and $2.50 for a brief lesson on kayak safety. The total cost y to rent the kayak for x hours is given by y = 15x + 2.5. Interpret the slope and y-intercept. The slope 15 represents the rate of change or cost per hour. The y-intercept 2.5 is the charge for instruction.
  • 18.
    How did whatyou learned today help you answer the WHY are graphs helpful? Course 3, Lesson 3-4 Expressions and Equations
  • 19.
    How did whatyou learned today help you answer the WHY are graphs helpful? Course 3, Lesson 3-4 Expressions and Equations Sample answers: • If a nonproportional linear relationship is graphed, you can easily determine the slope and y-intercept. • When the relationship is graphed, you can interpret the slope and y-intercept.
  • 20.
    Explain how youwould graph y = –14x + 3 using the slope and y-intercept. Ratios and Proportional RelationshipsExpressions and Equations Course 3, Lesson 3-4