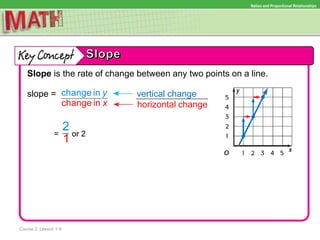
This document provides instruction on identifying proportional relationships and calculating slope. It includes examples of finding the constant rate of change from tables and graphs, as well as calculating slope from points on a line. The document emphasizes that slope represents the rate of change between any two points and can be used to show proportional relationships between quantities in real-world scenarios.