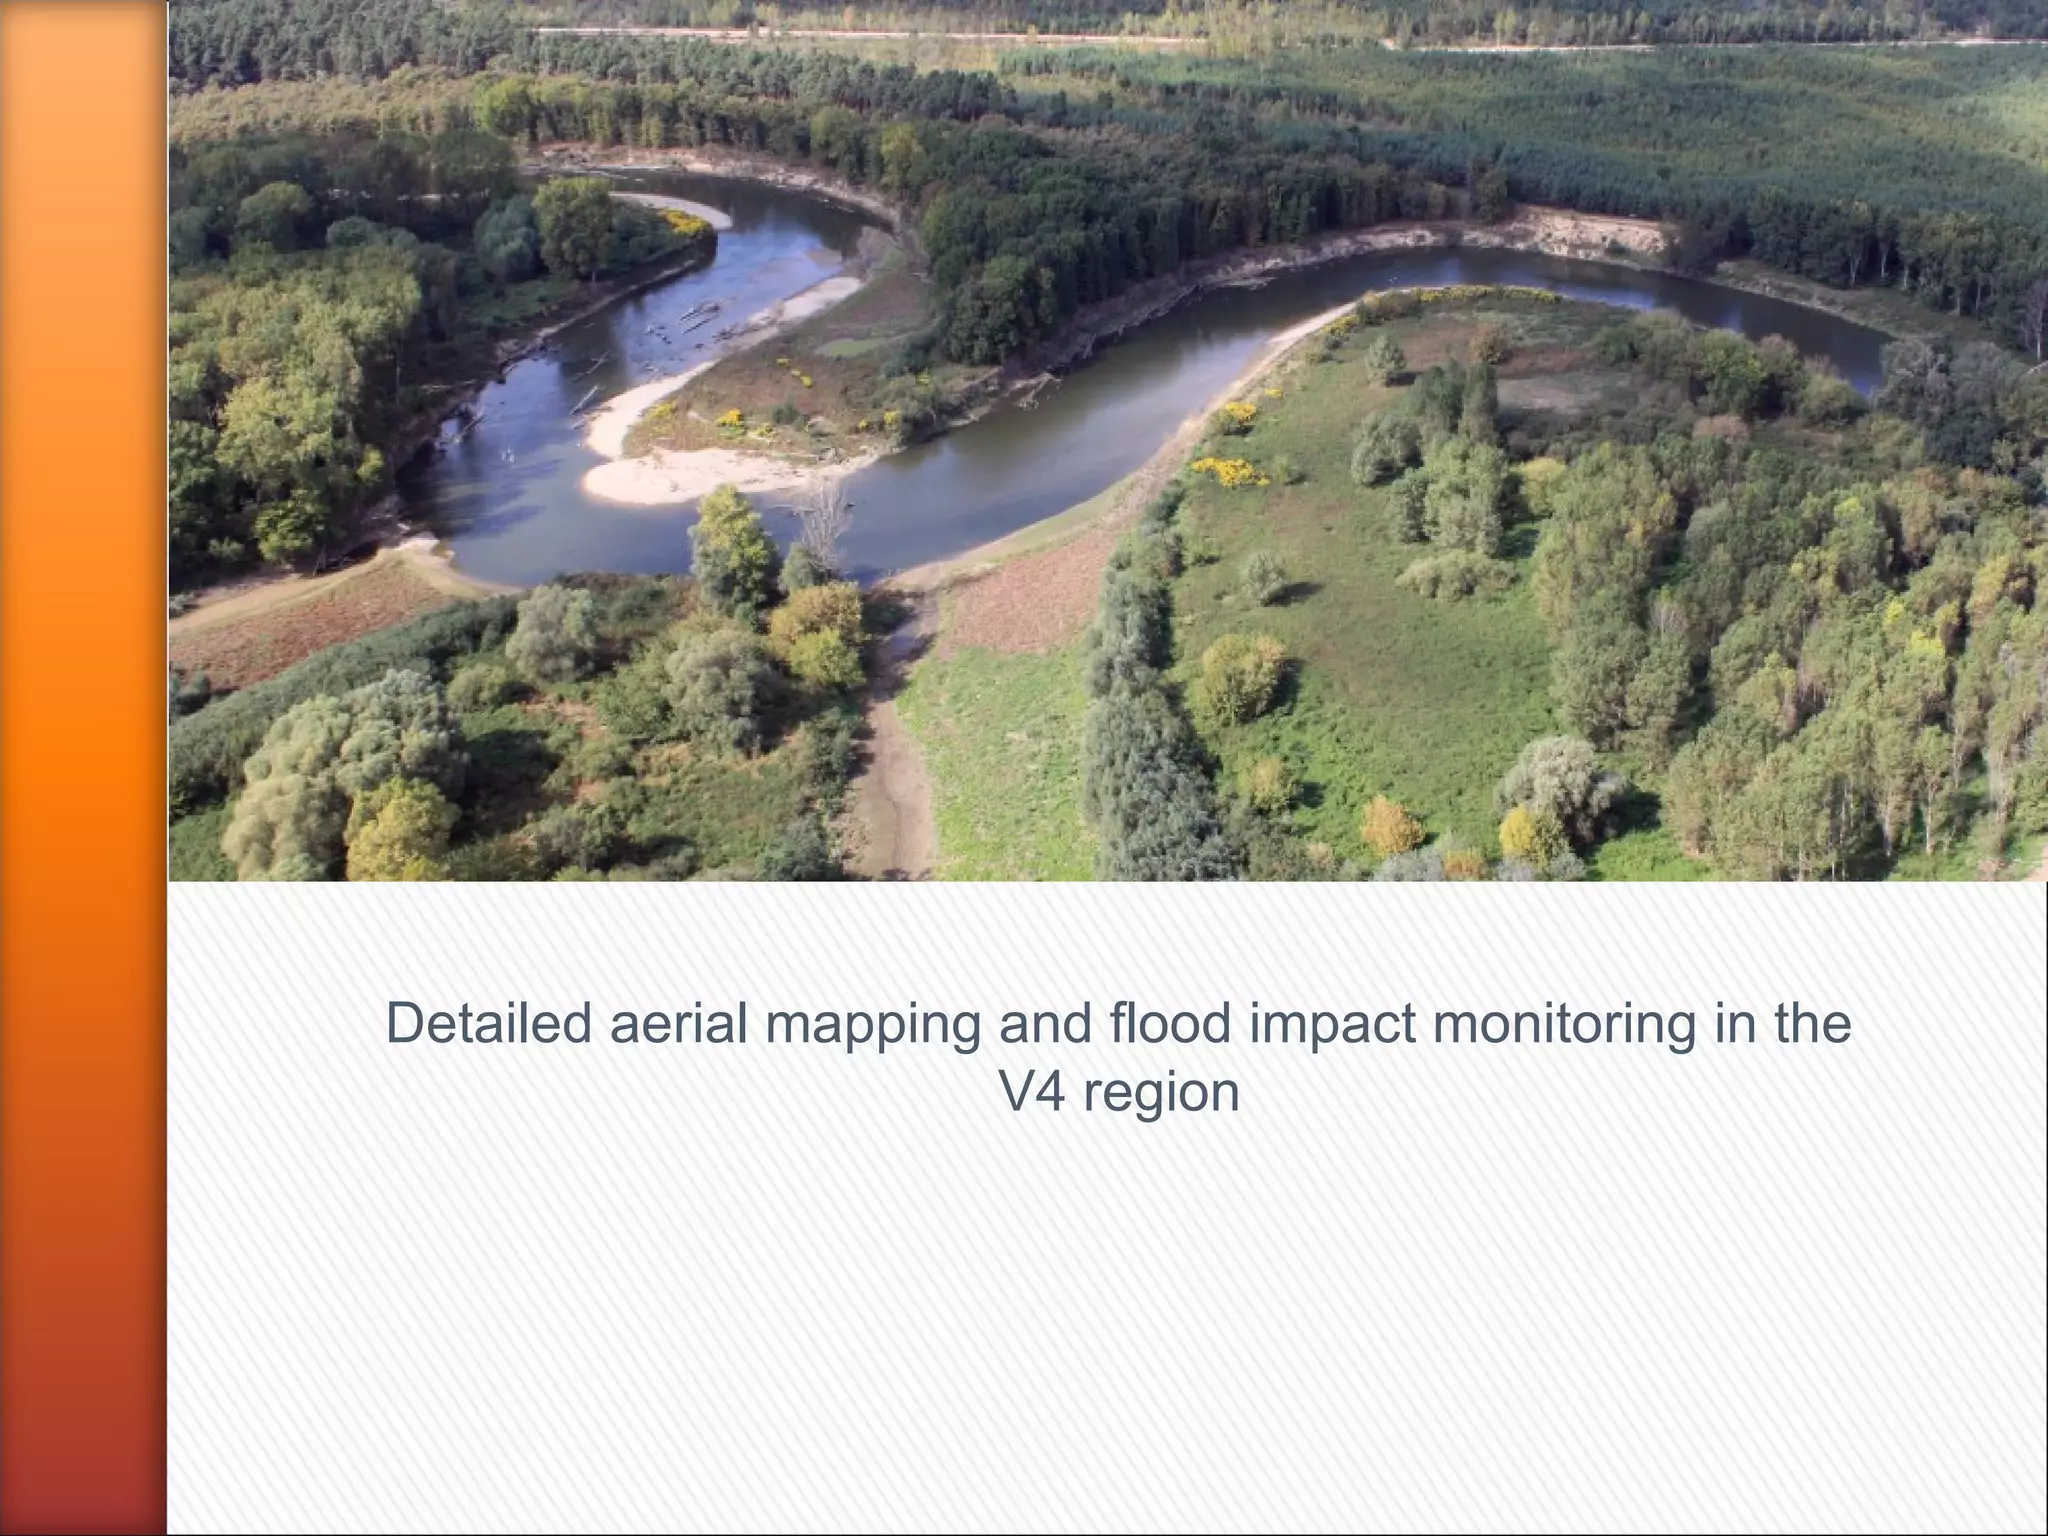
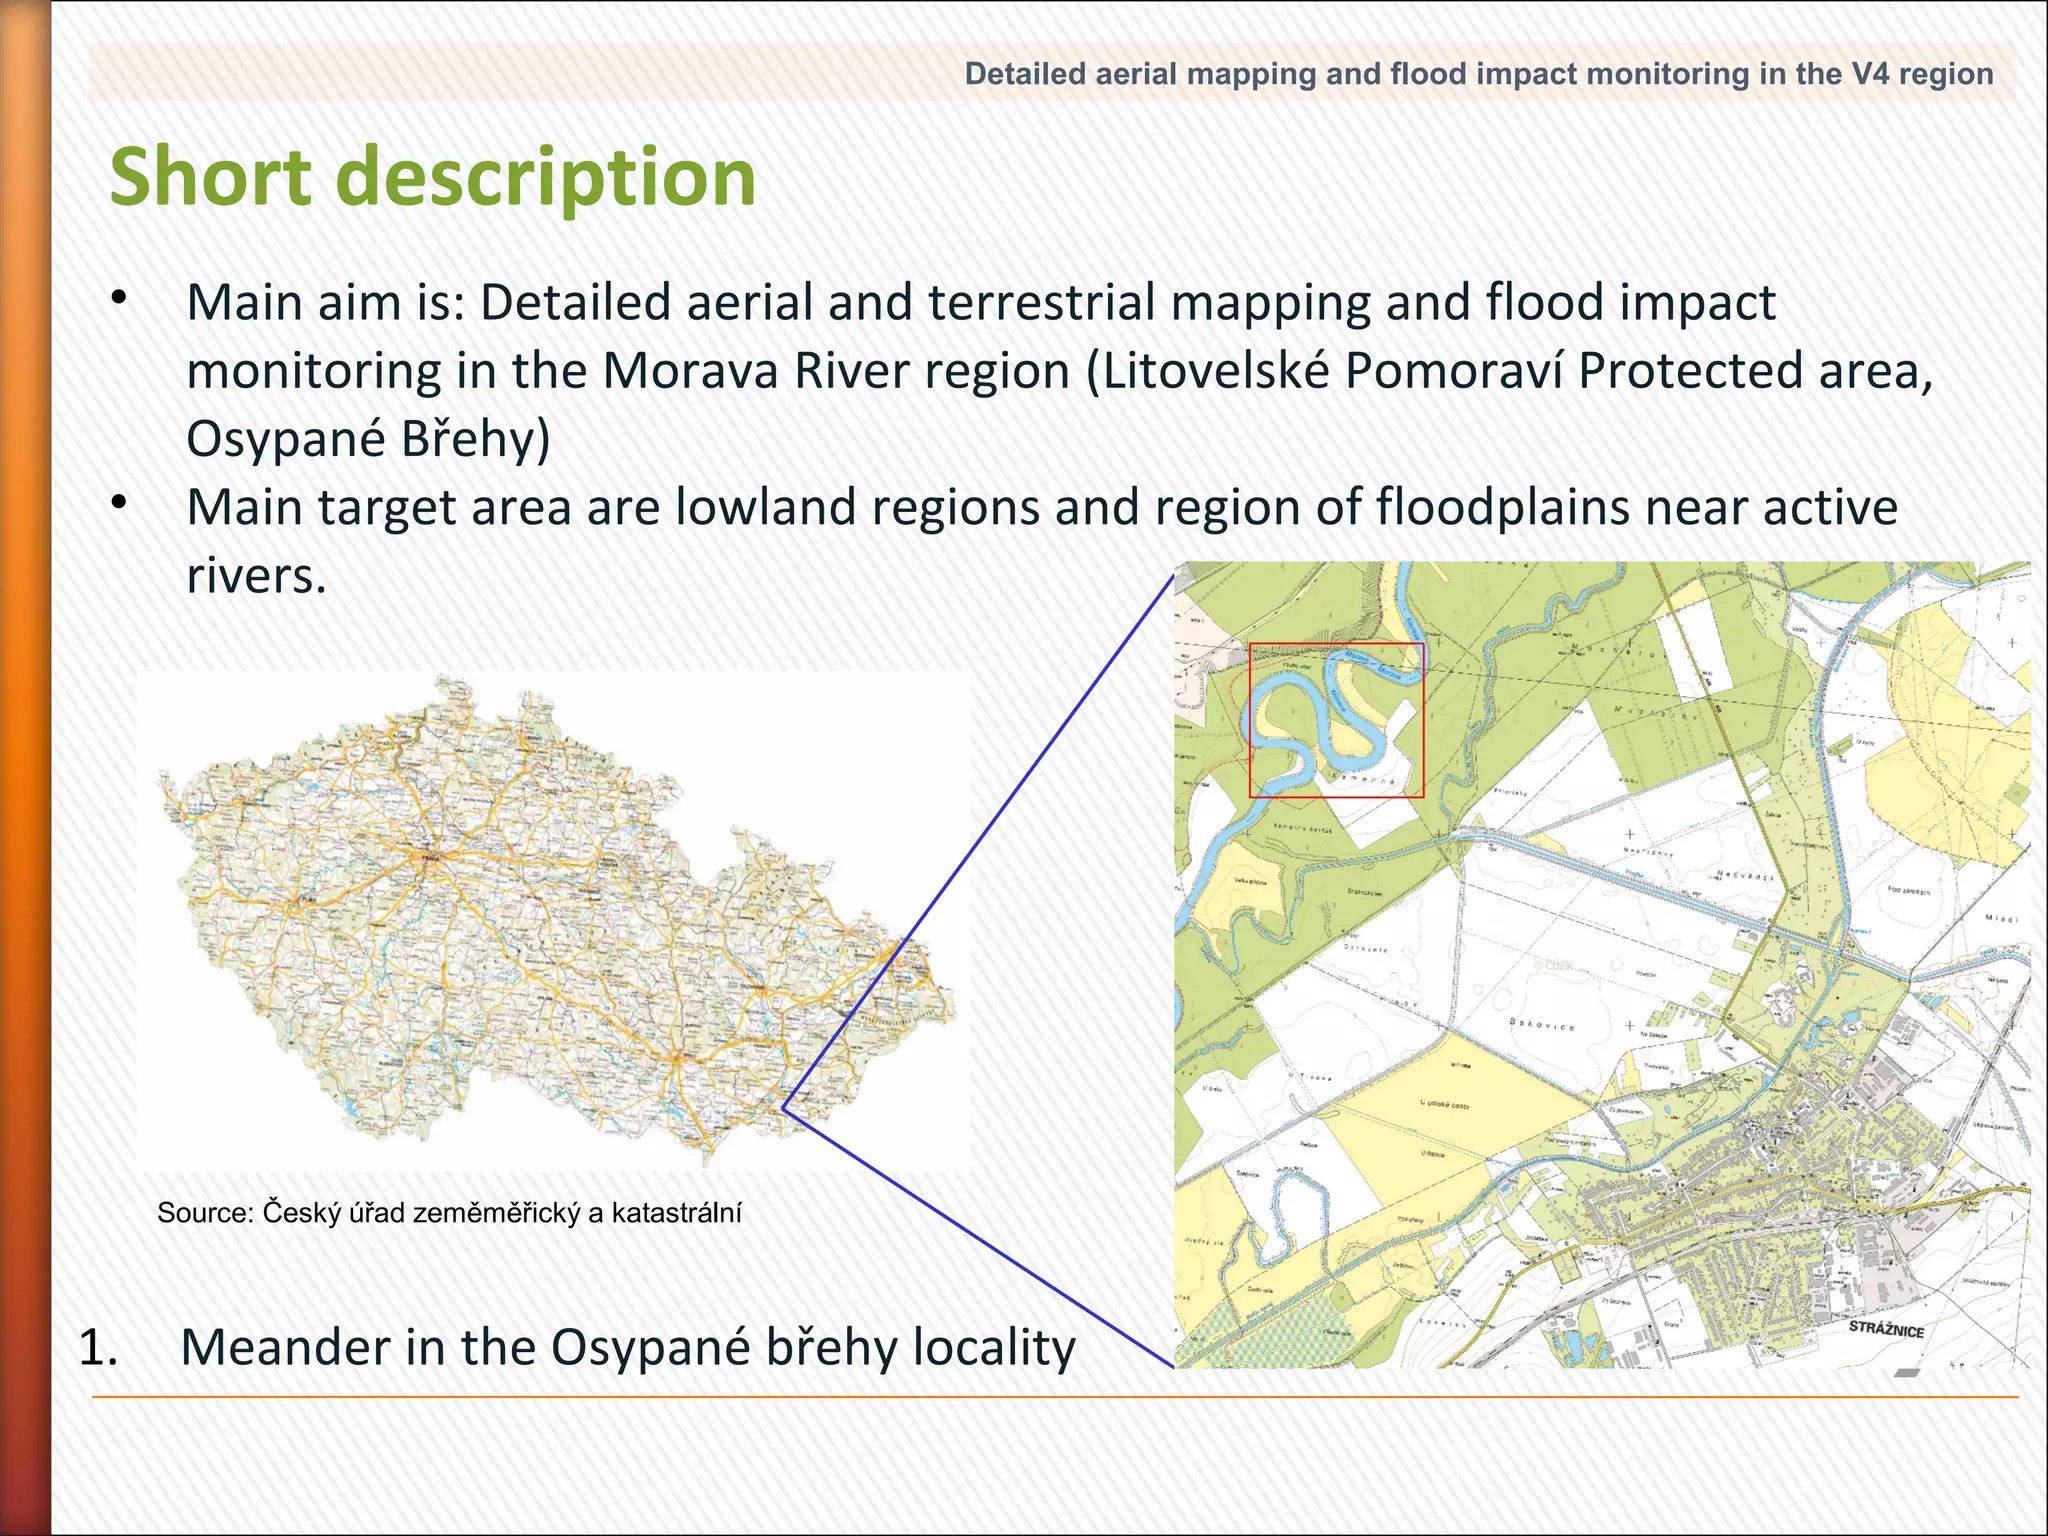
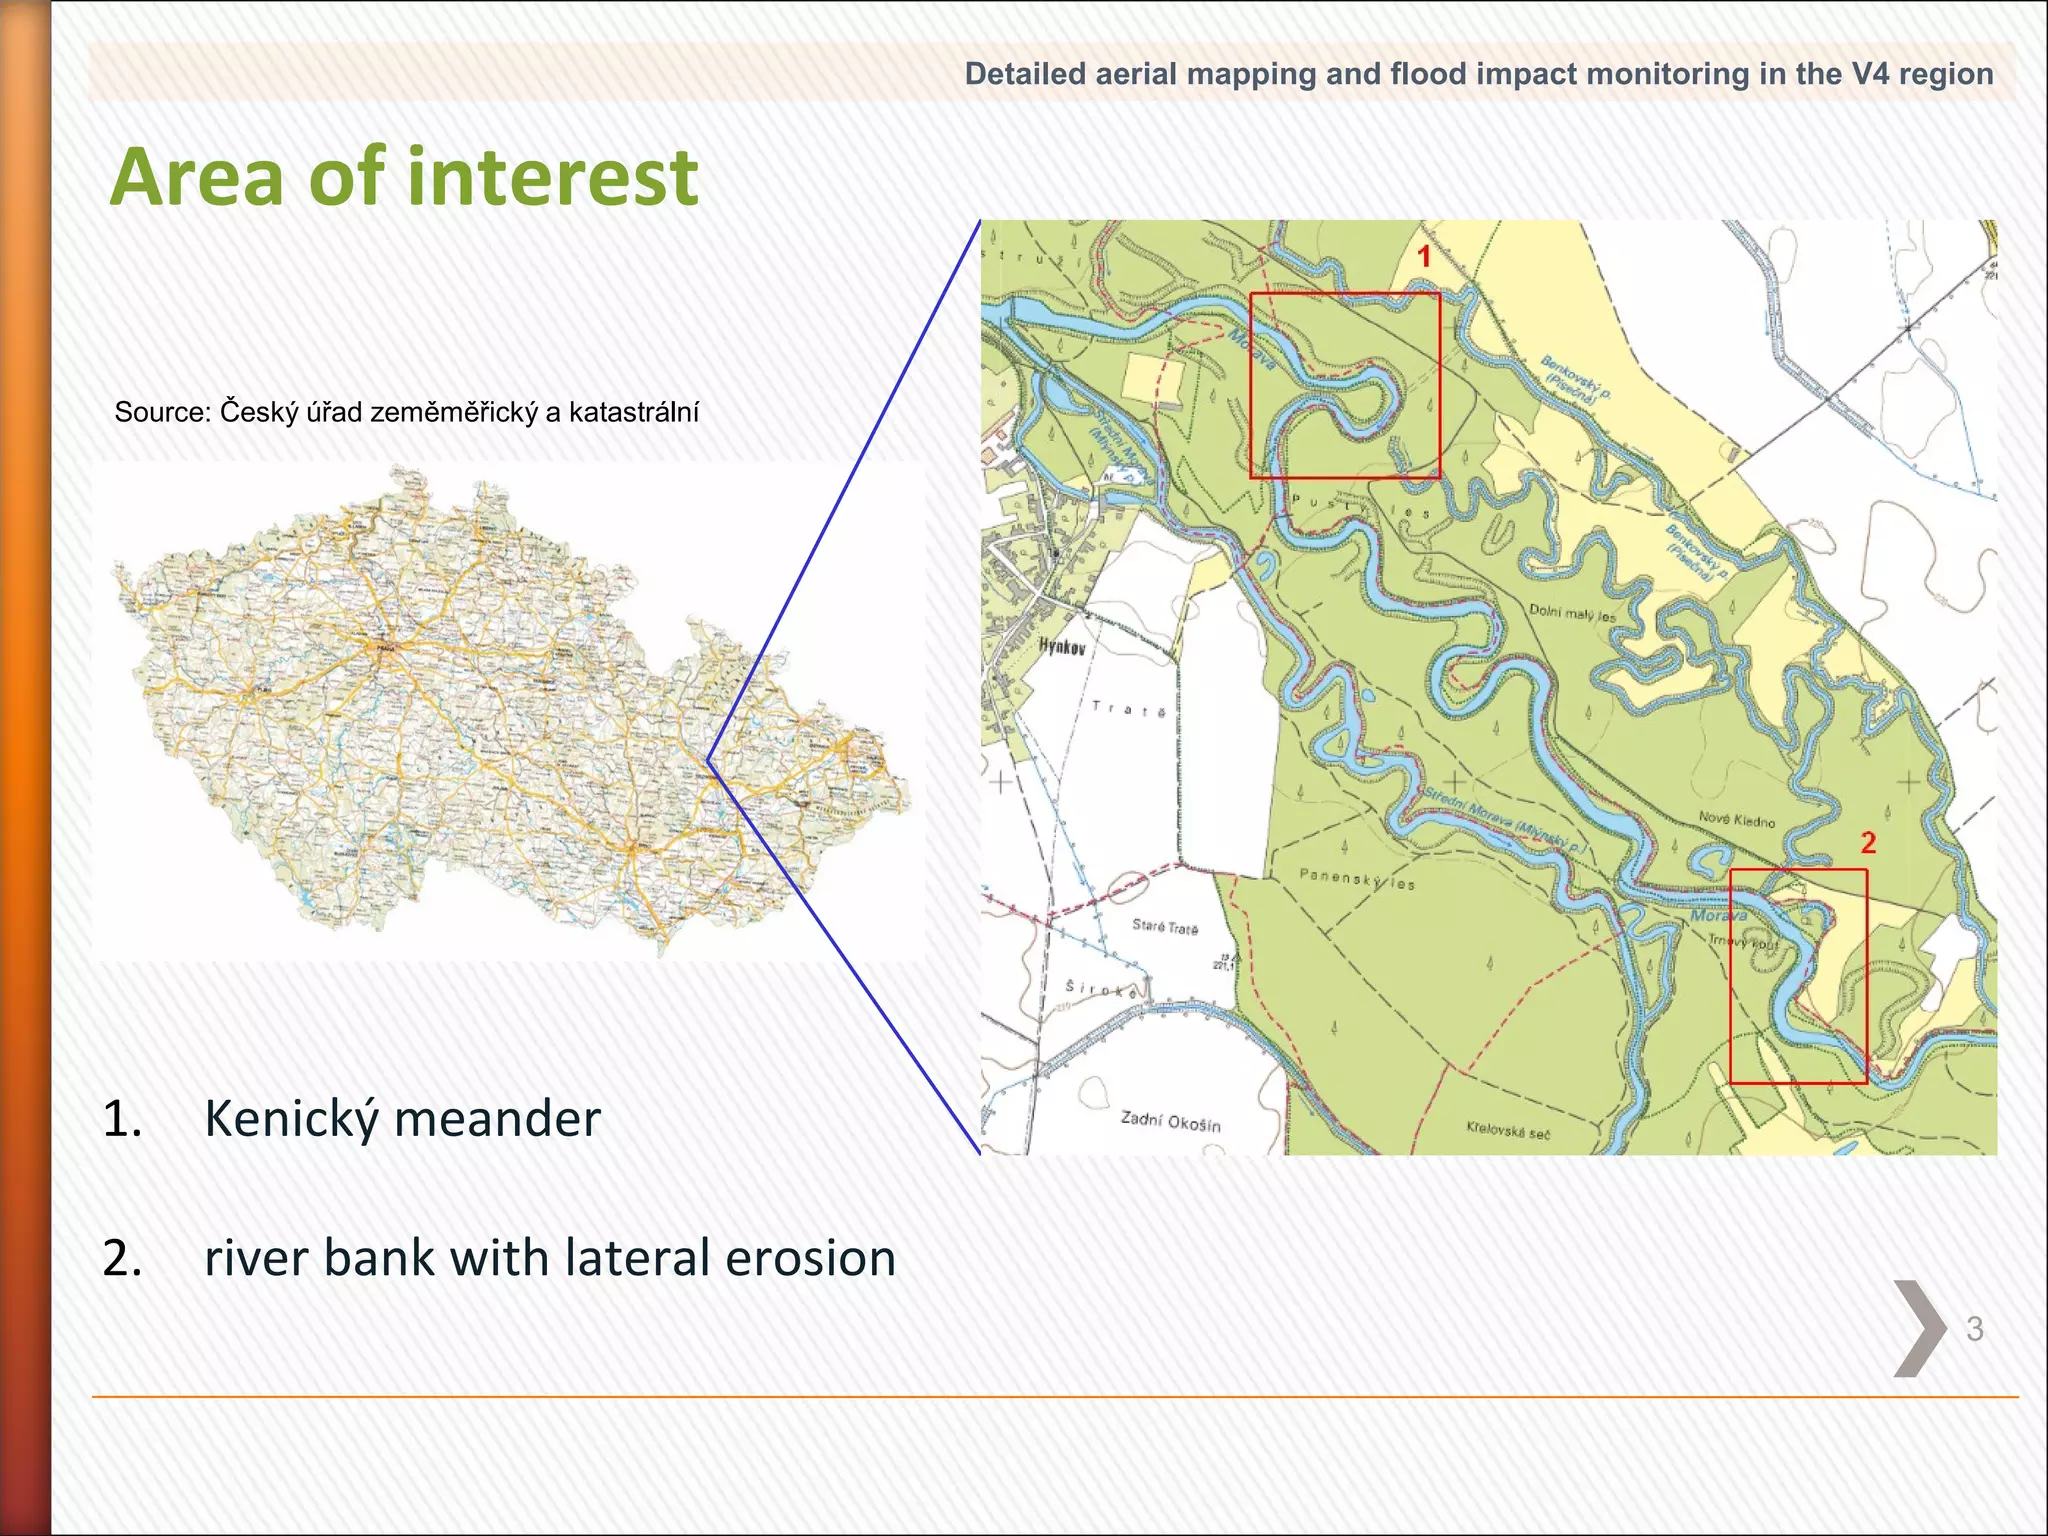
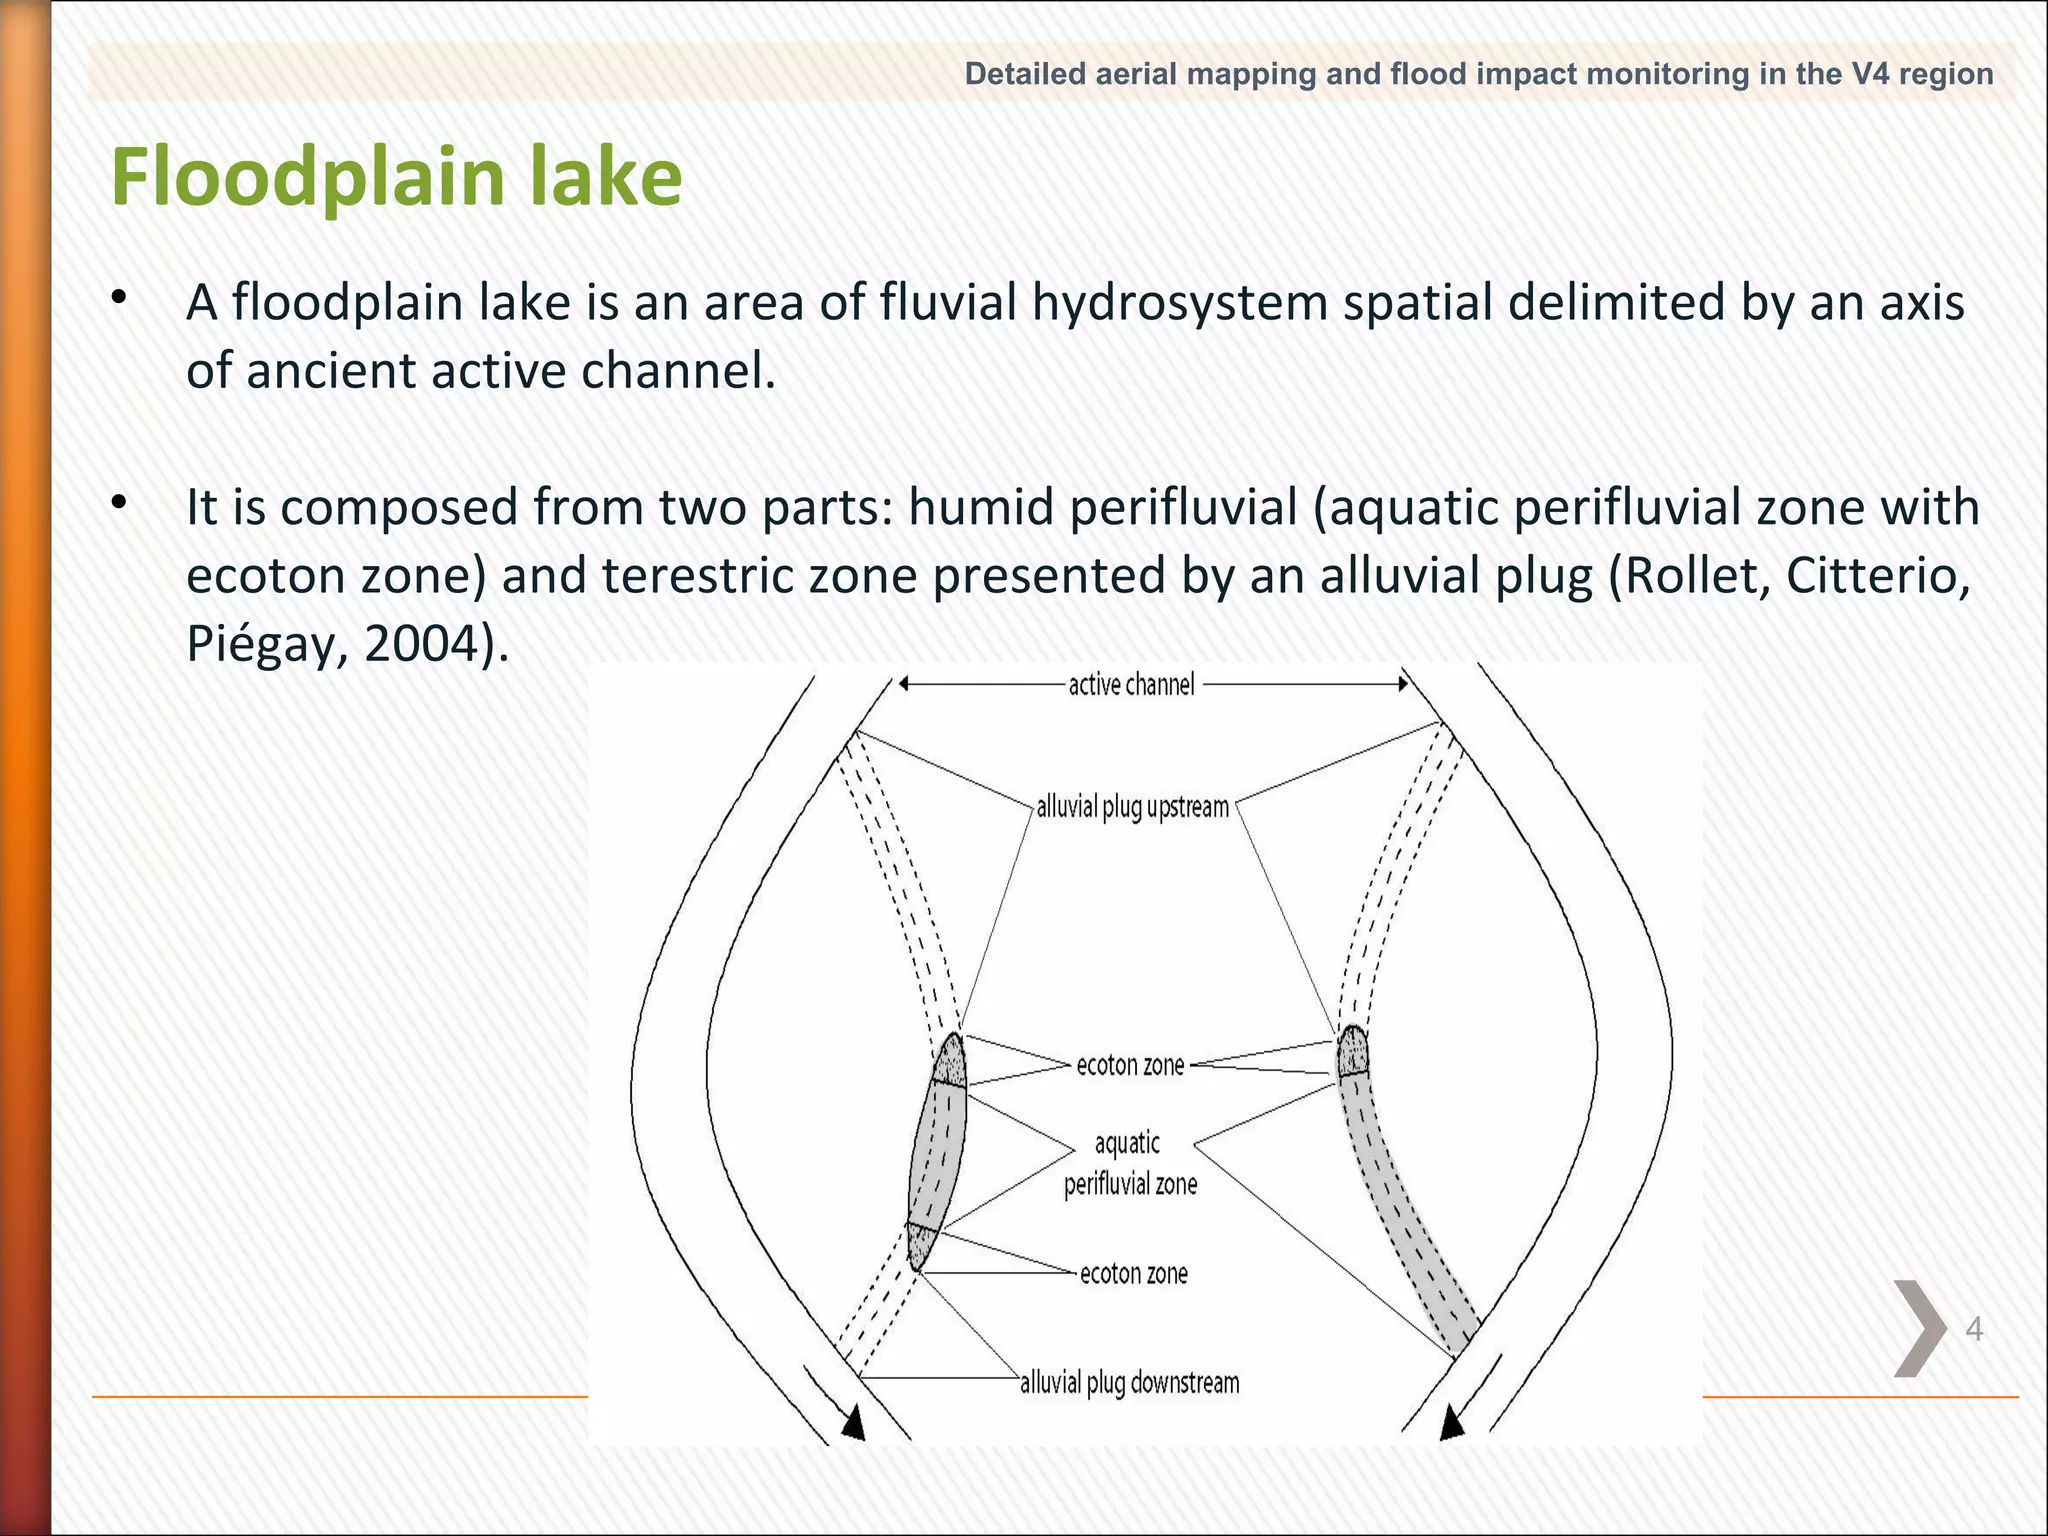
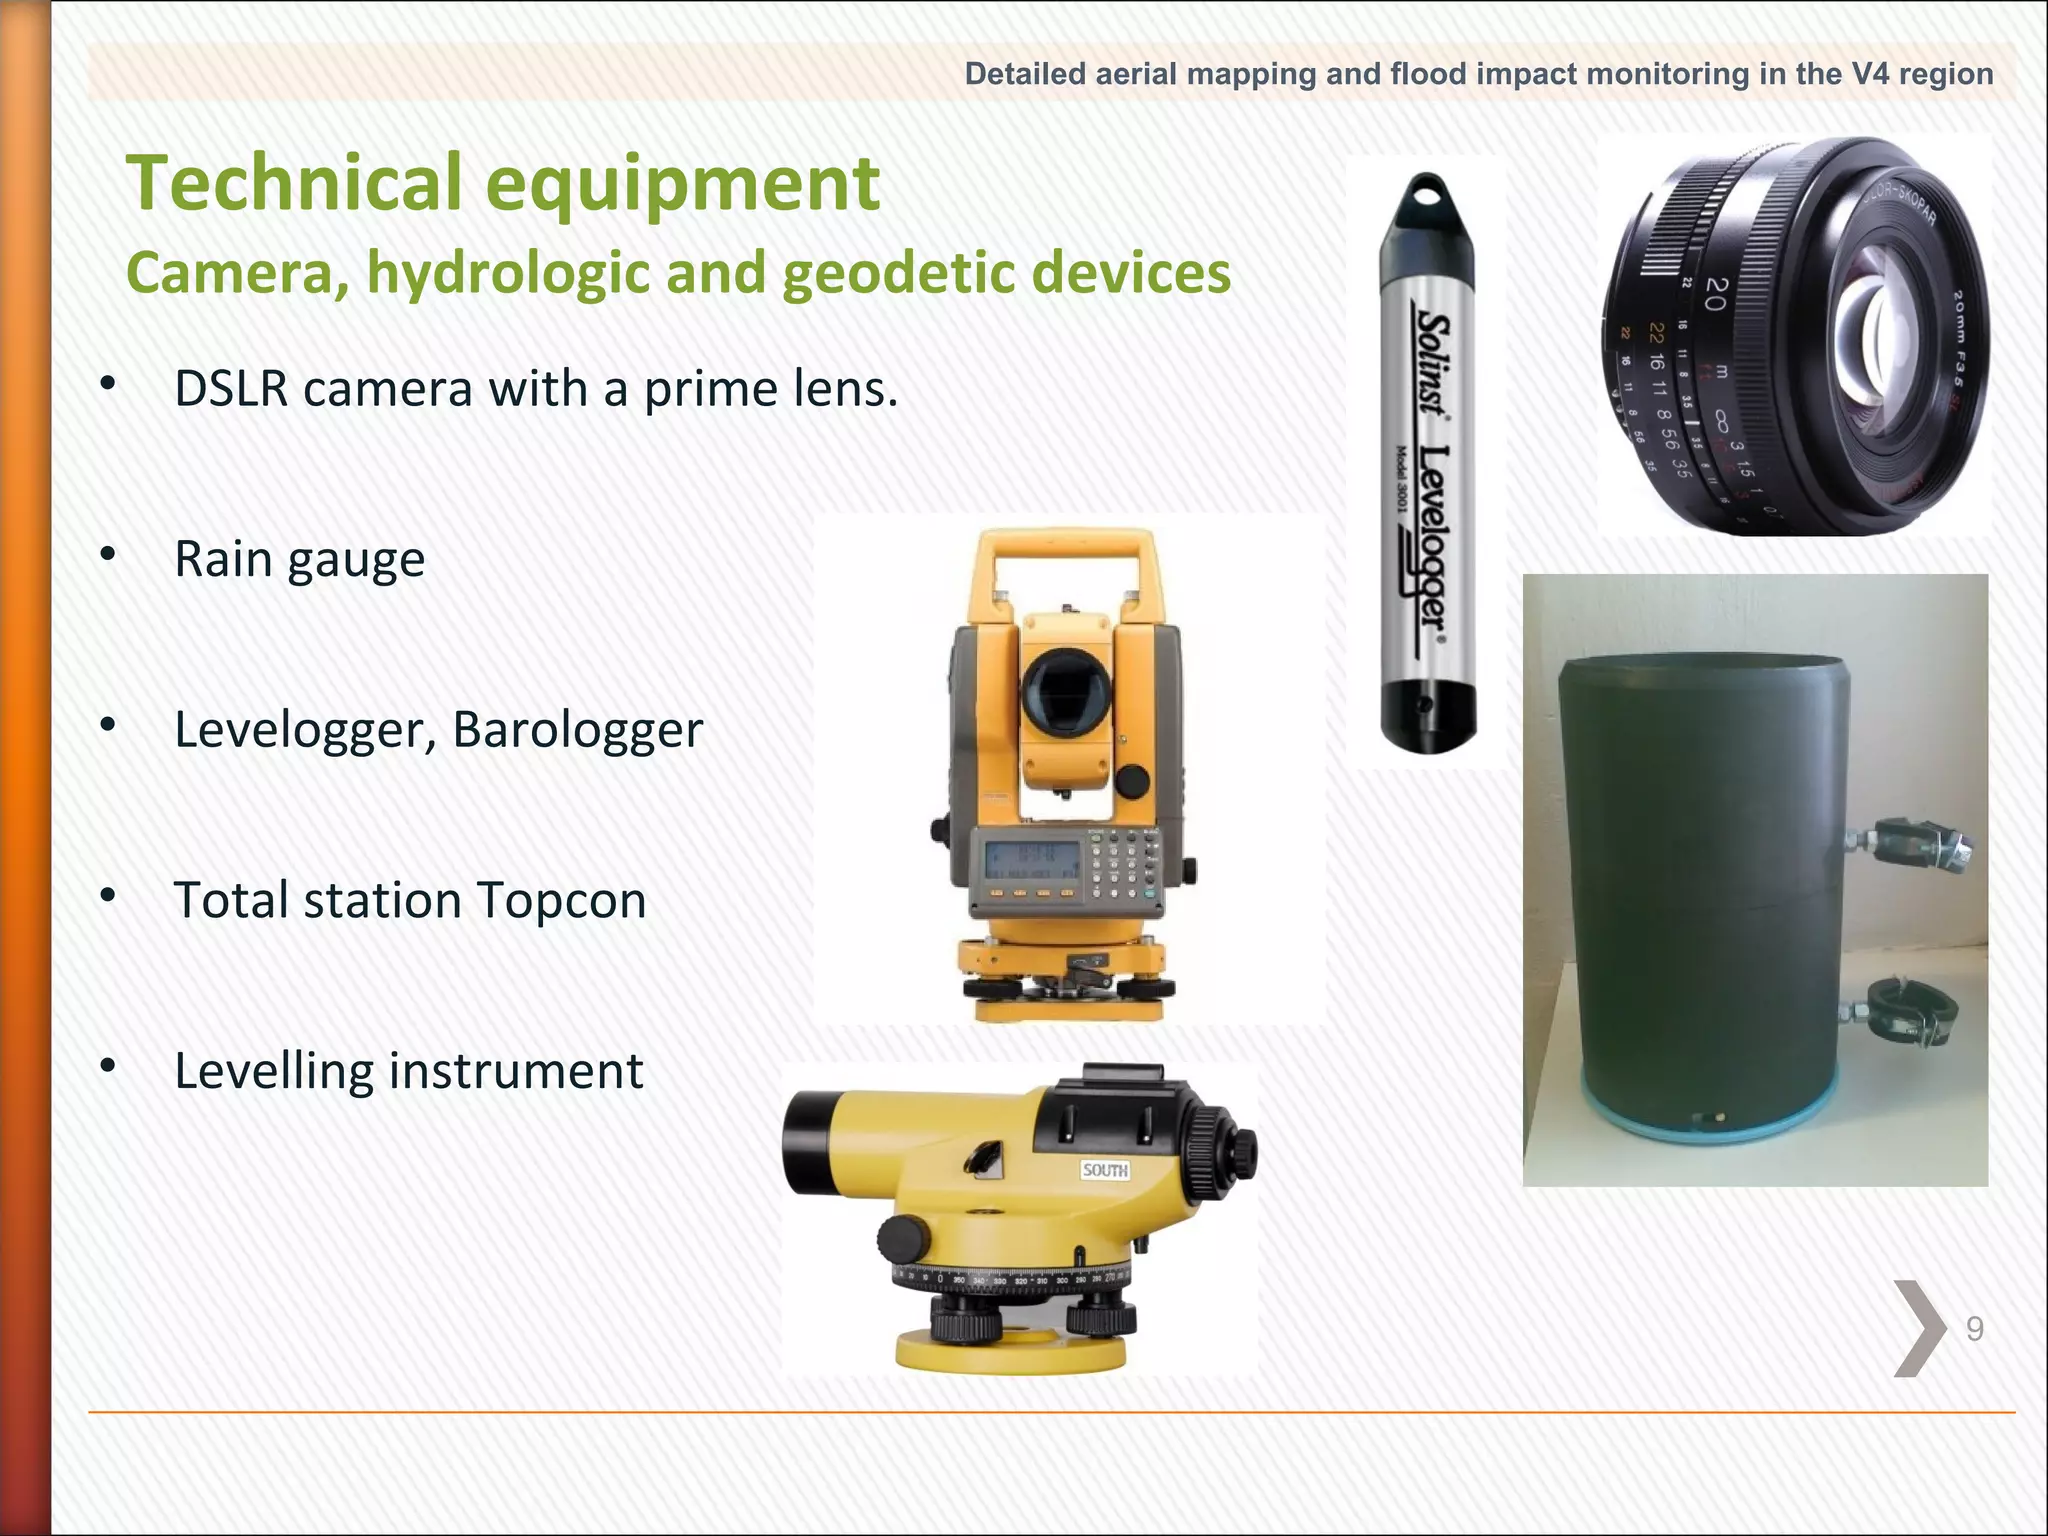
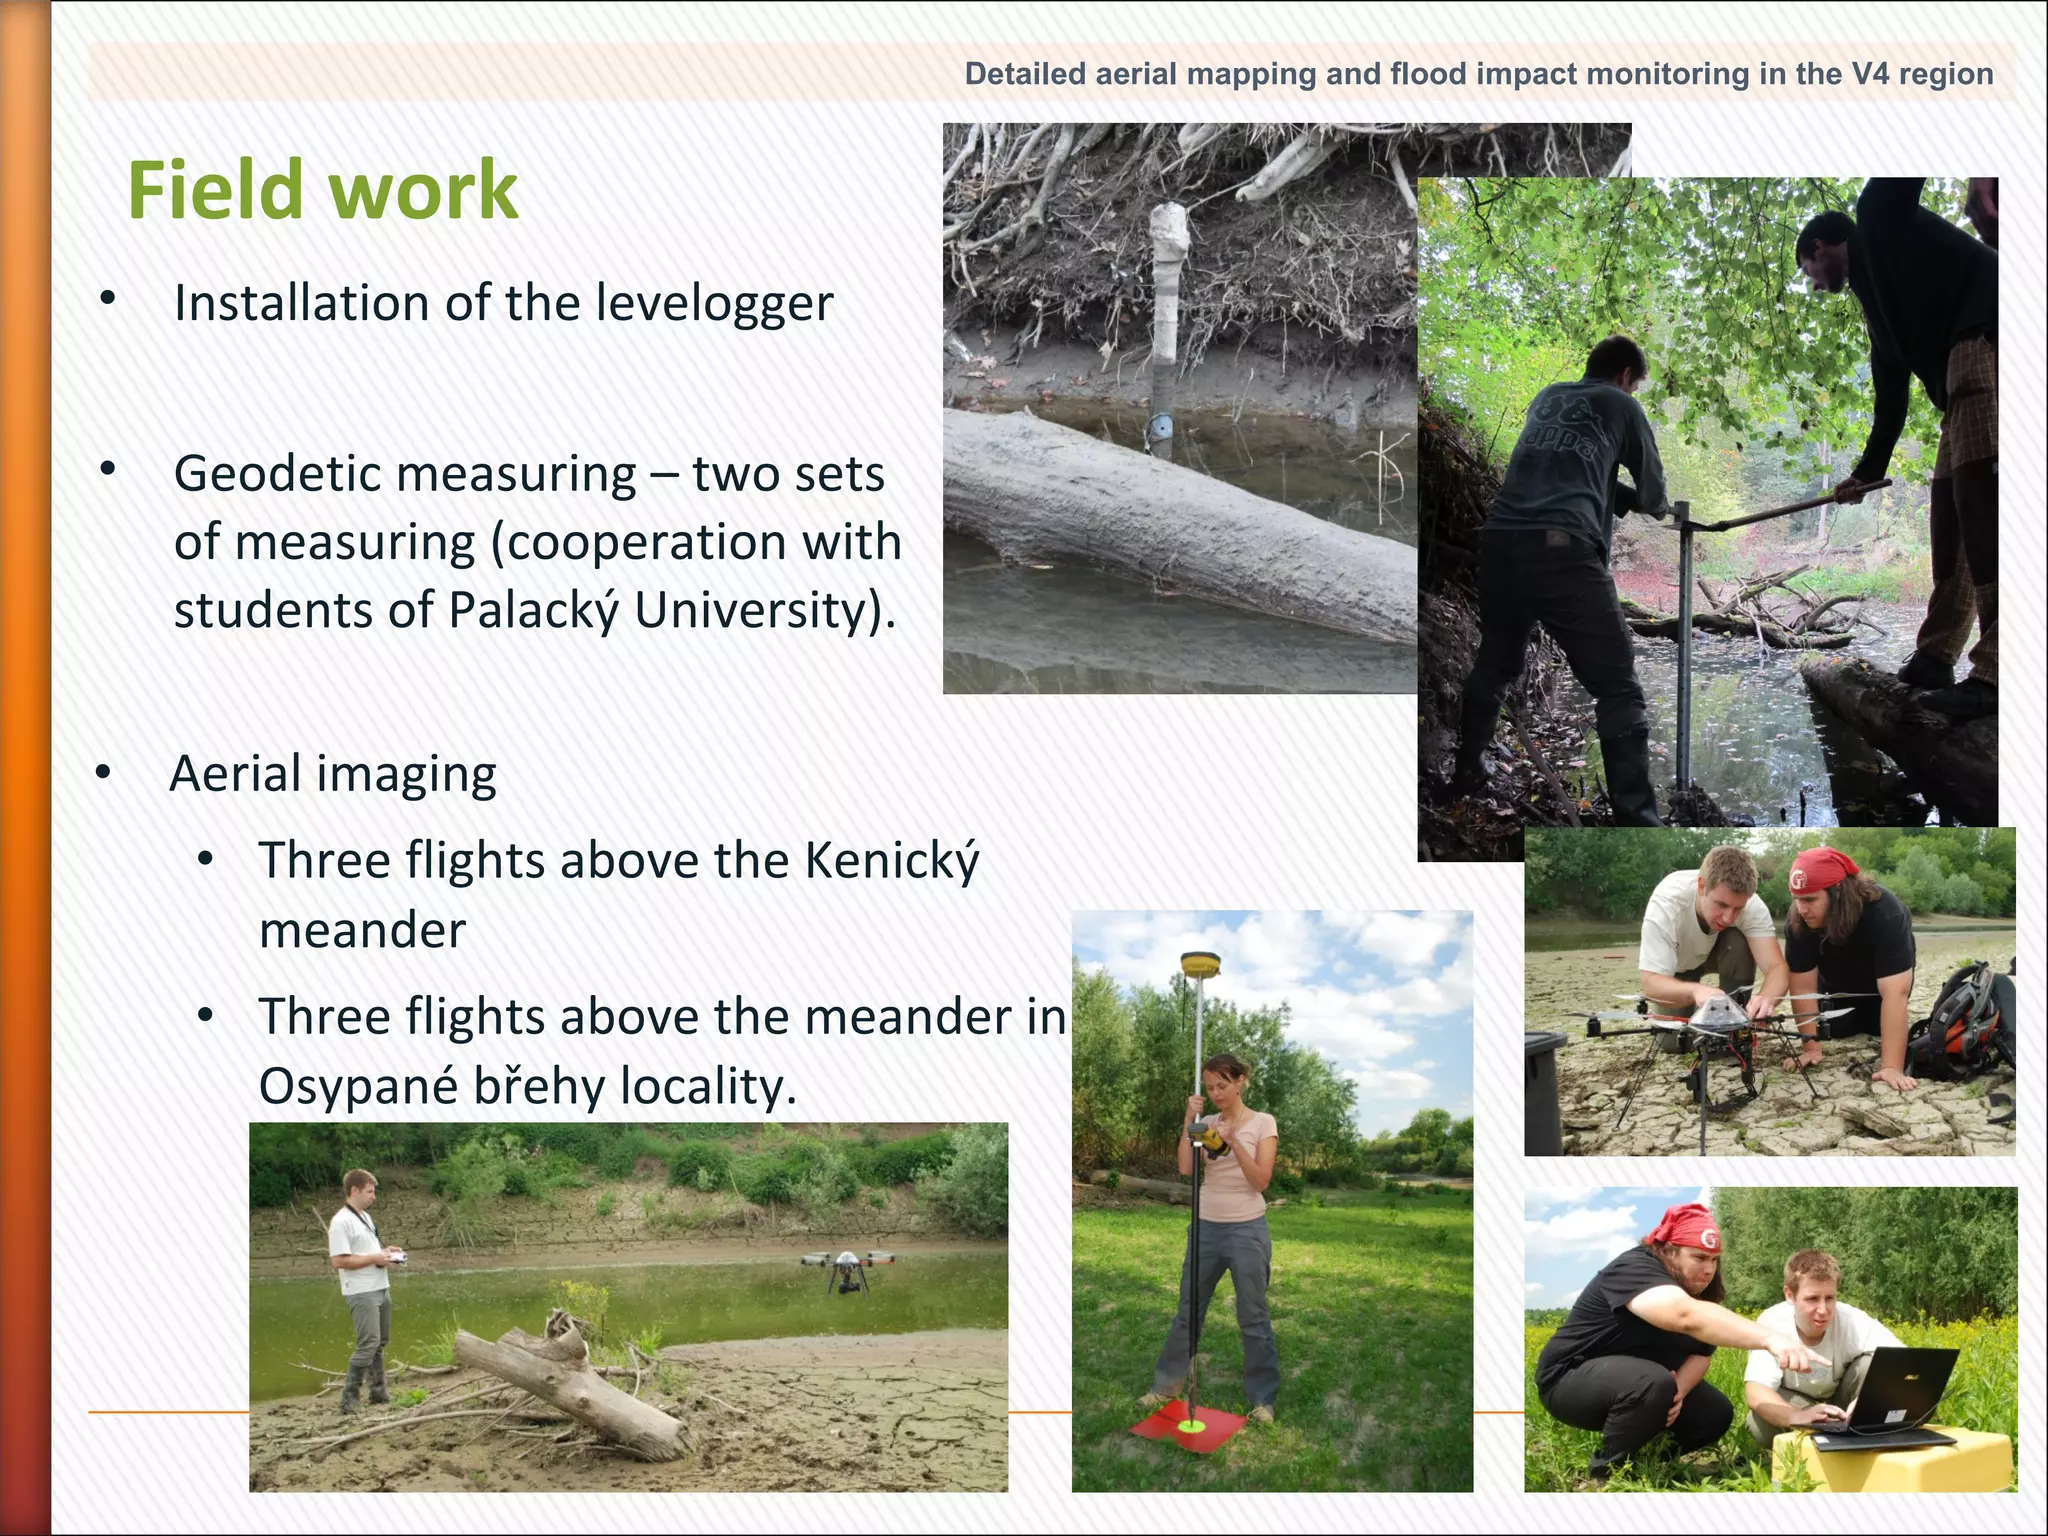
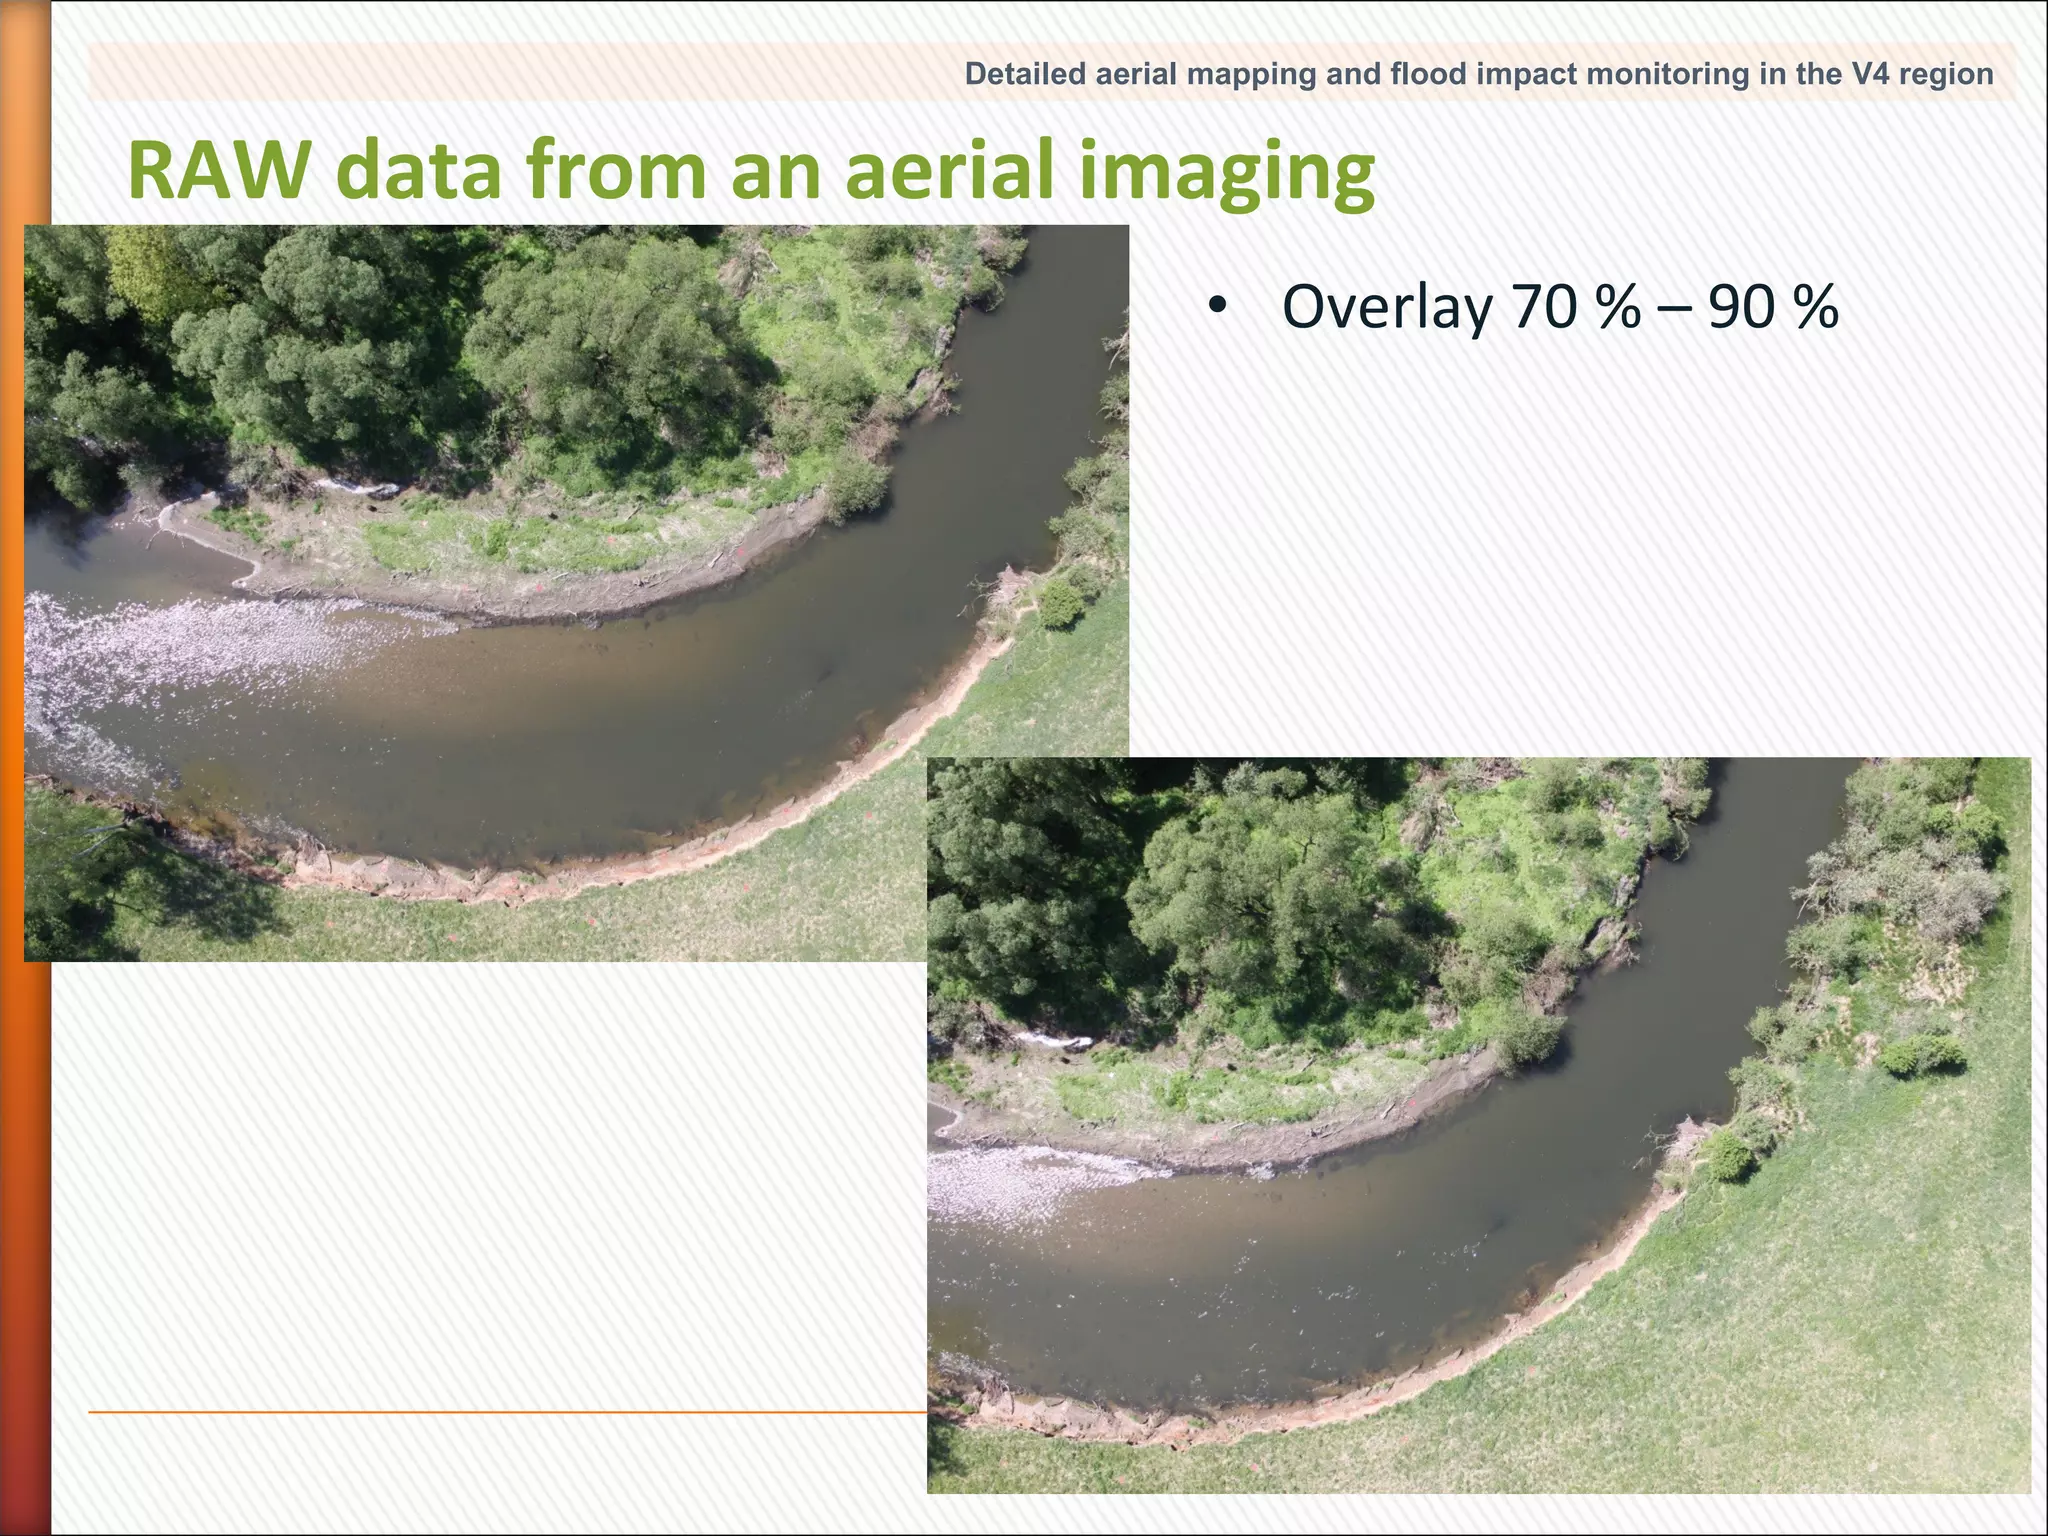
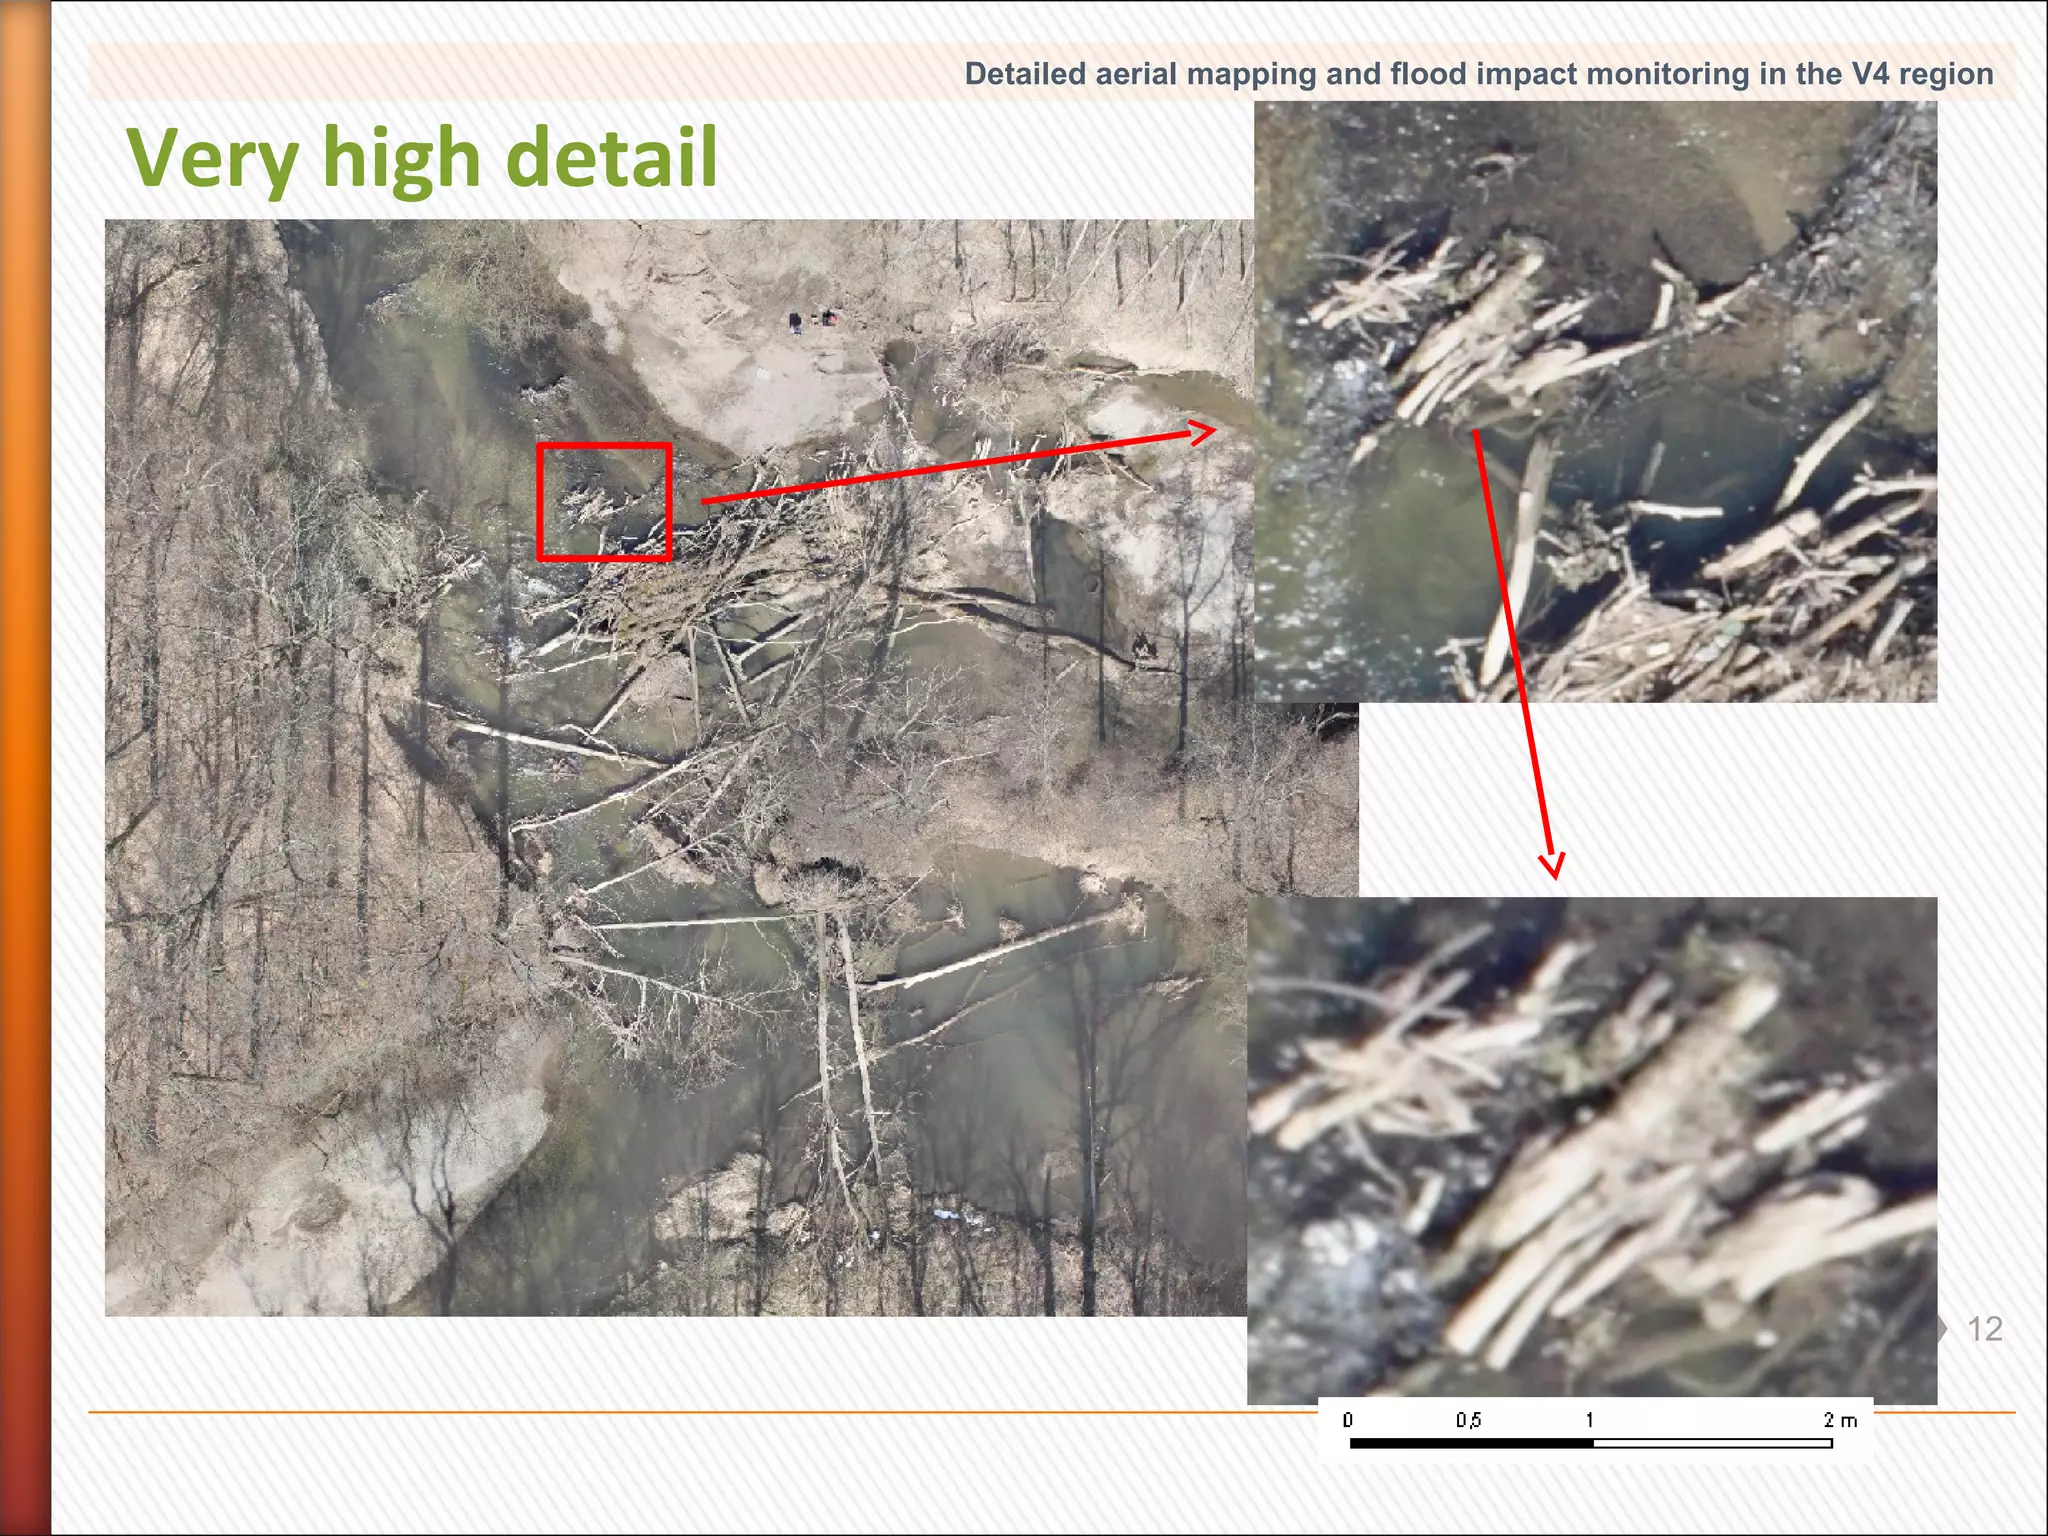
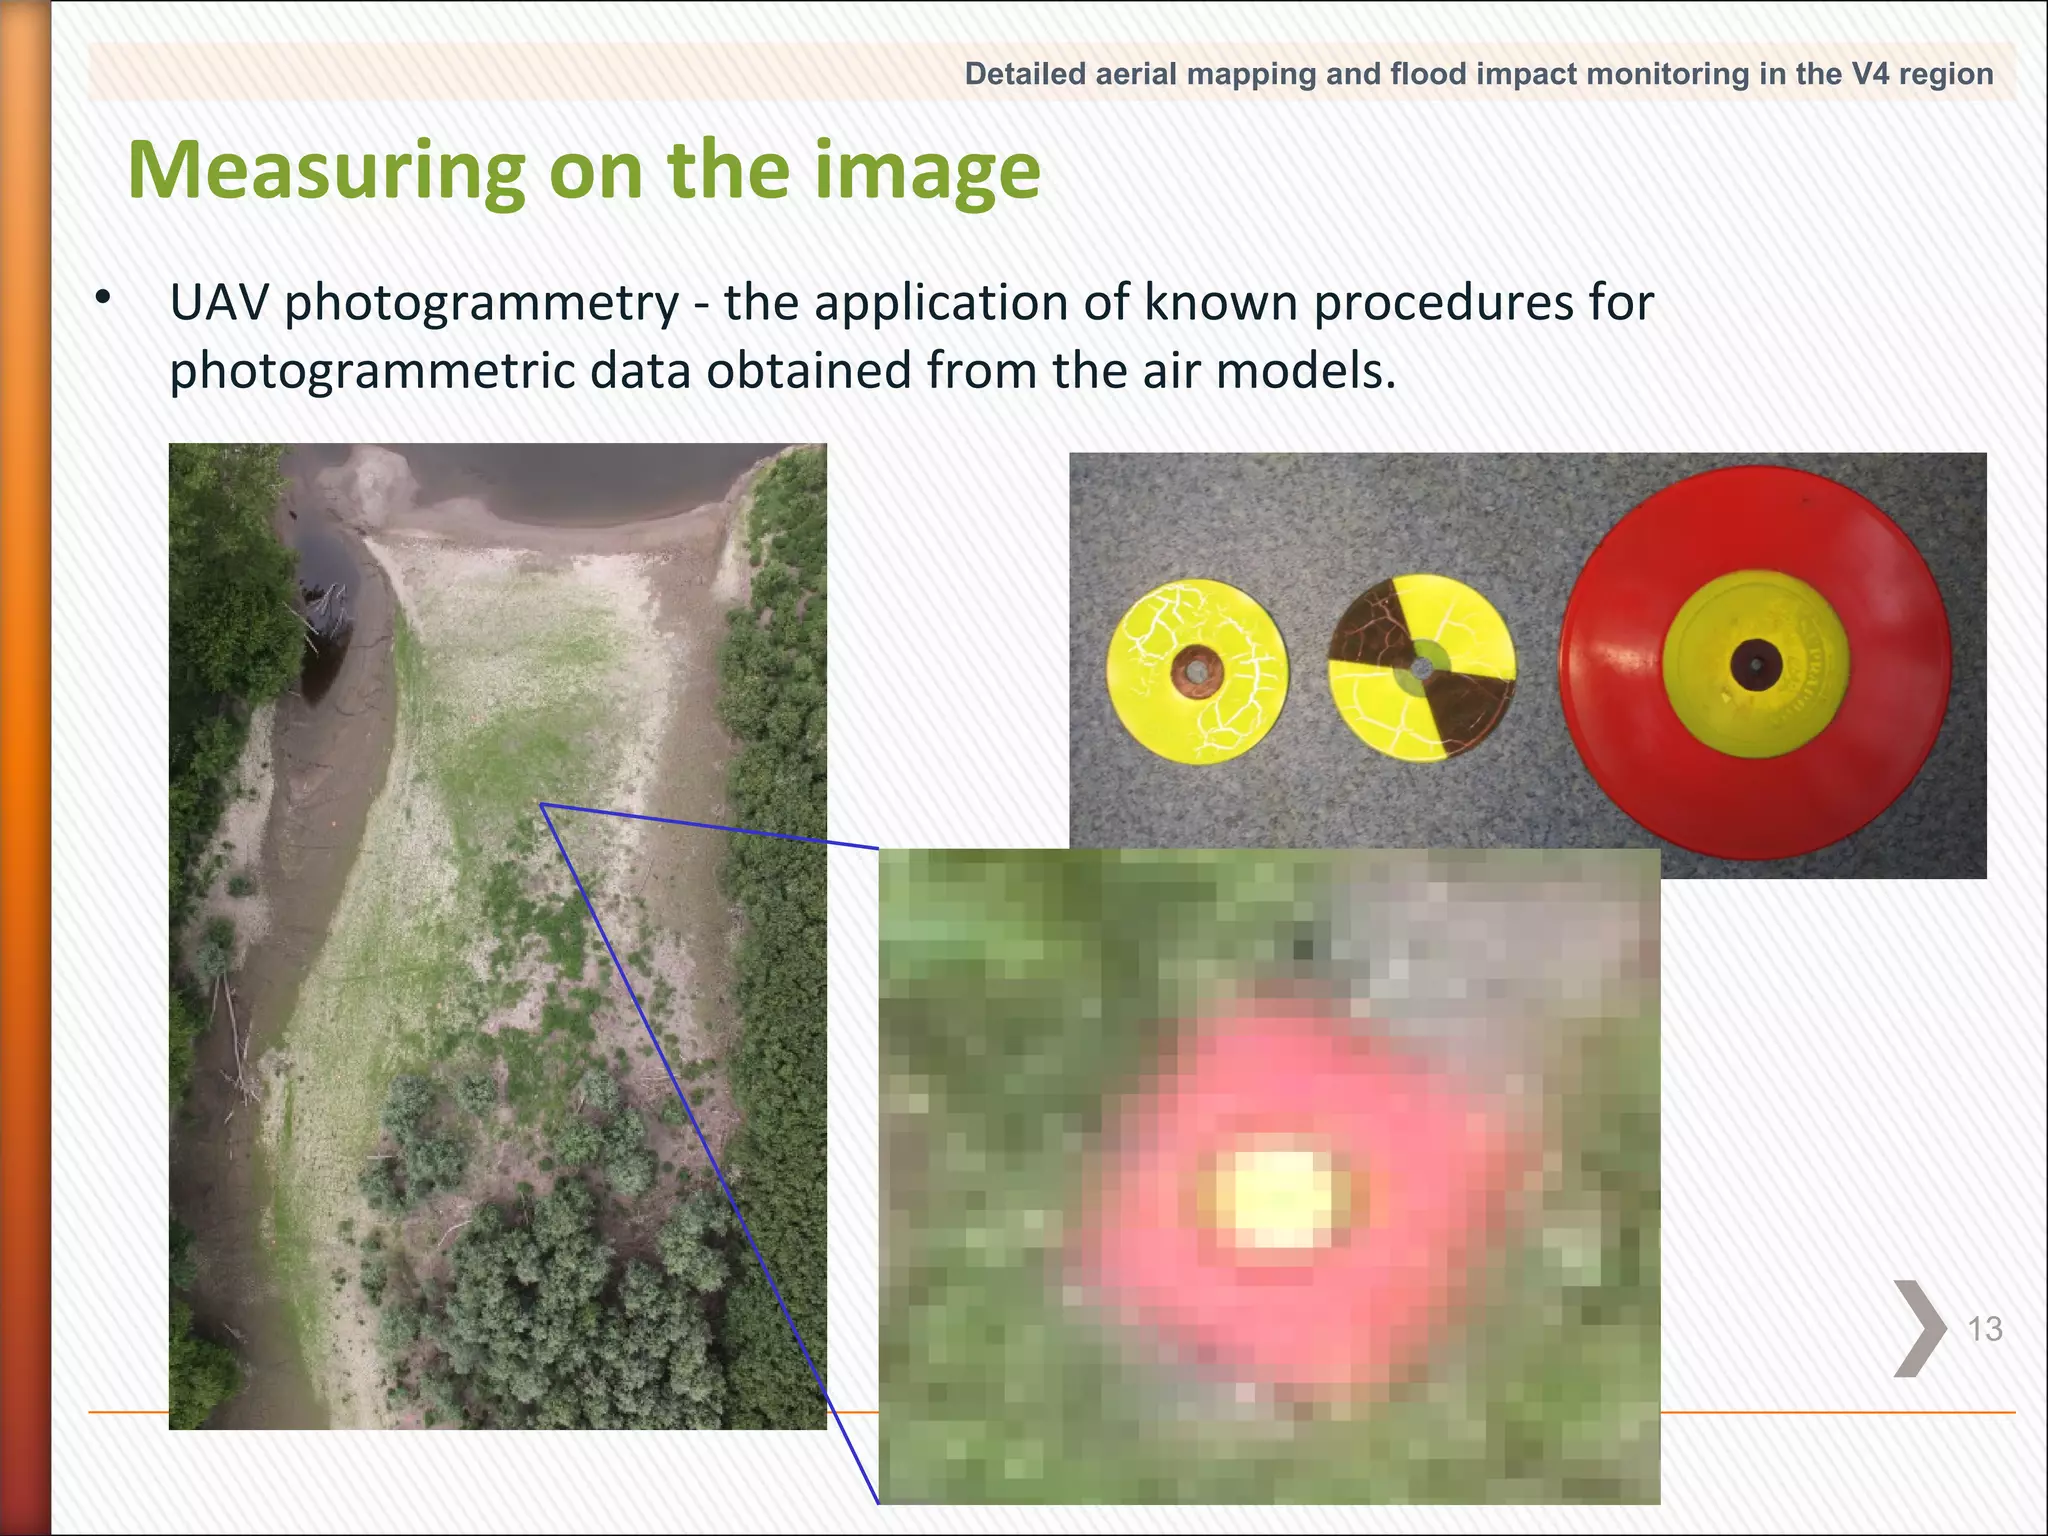
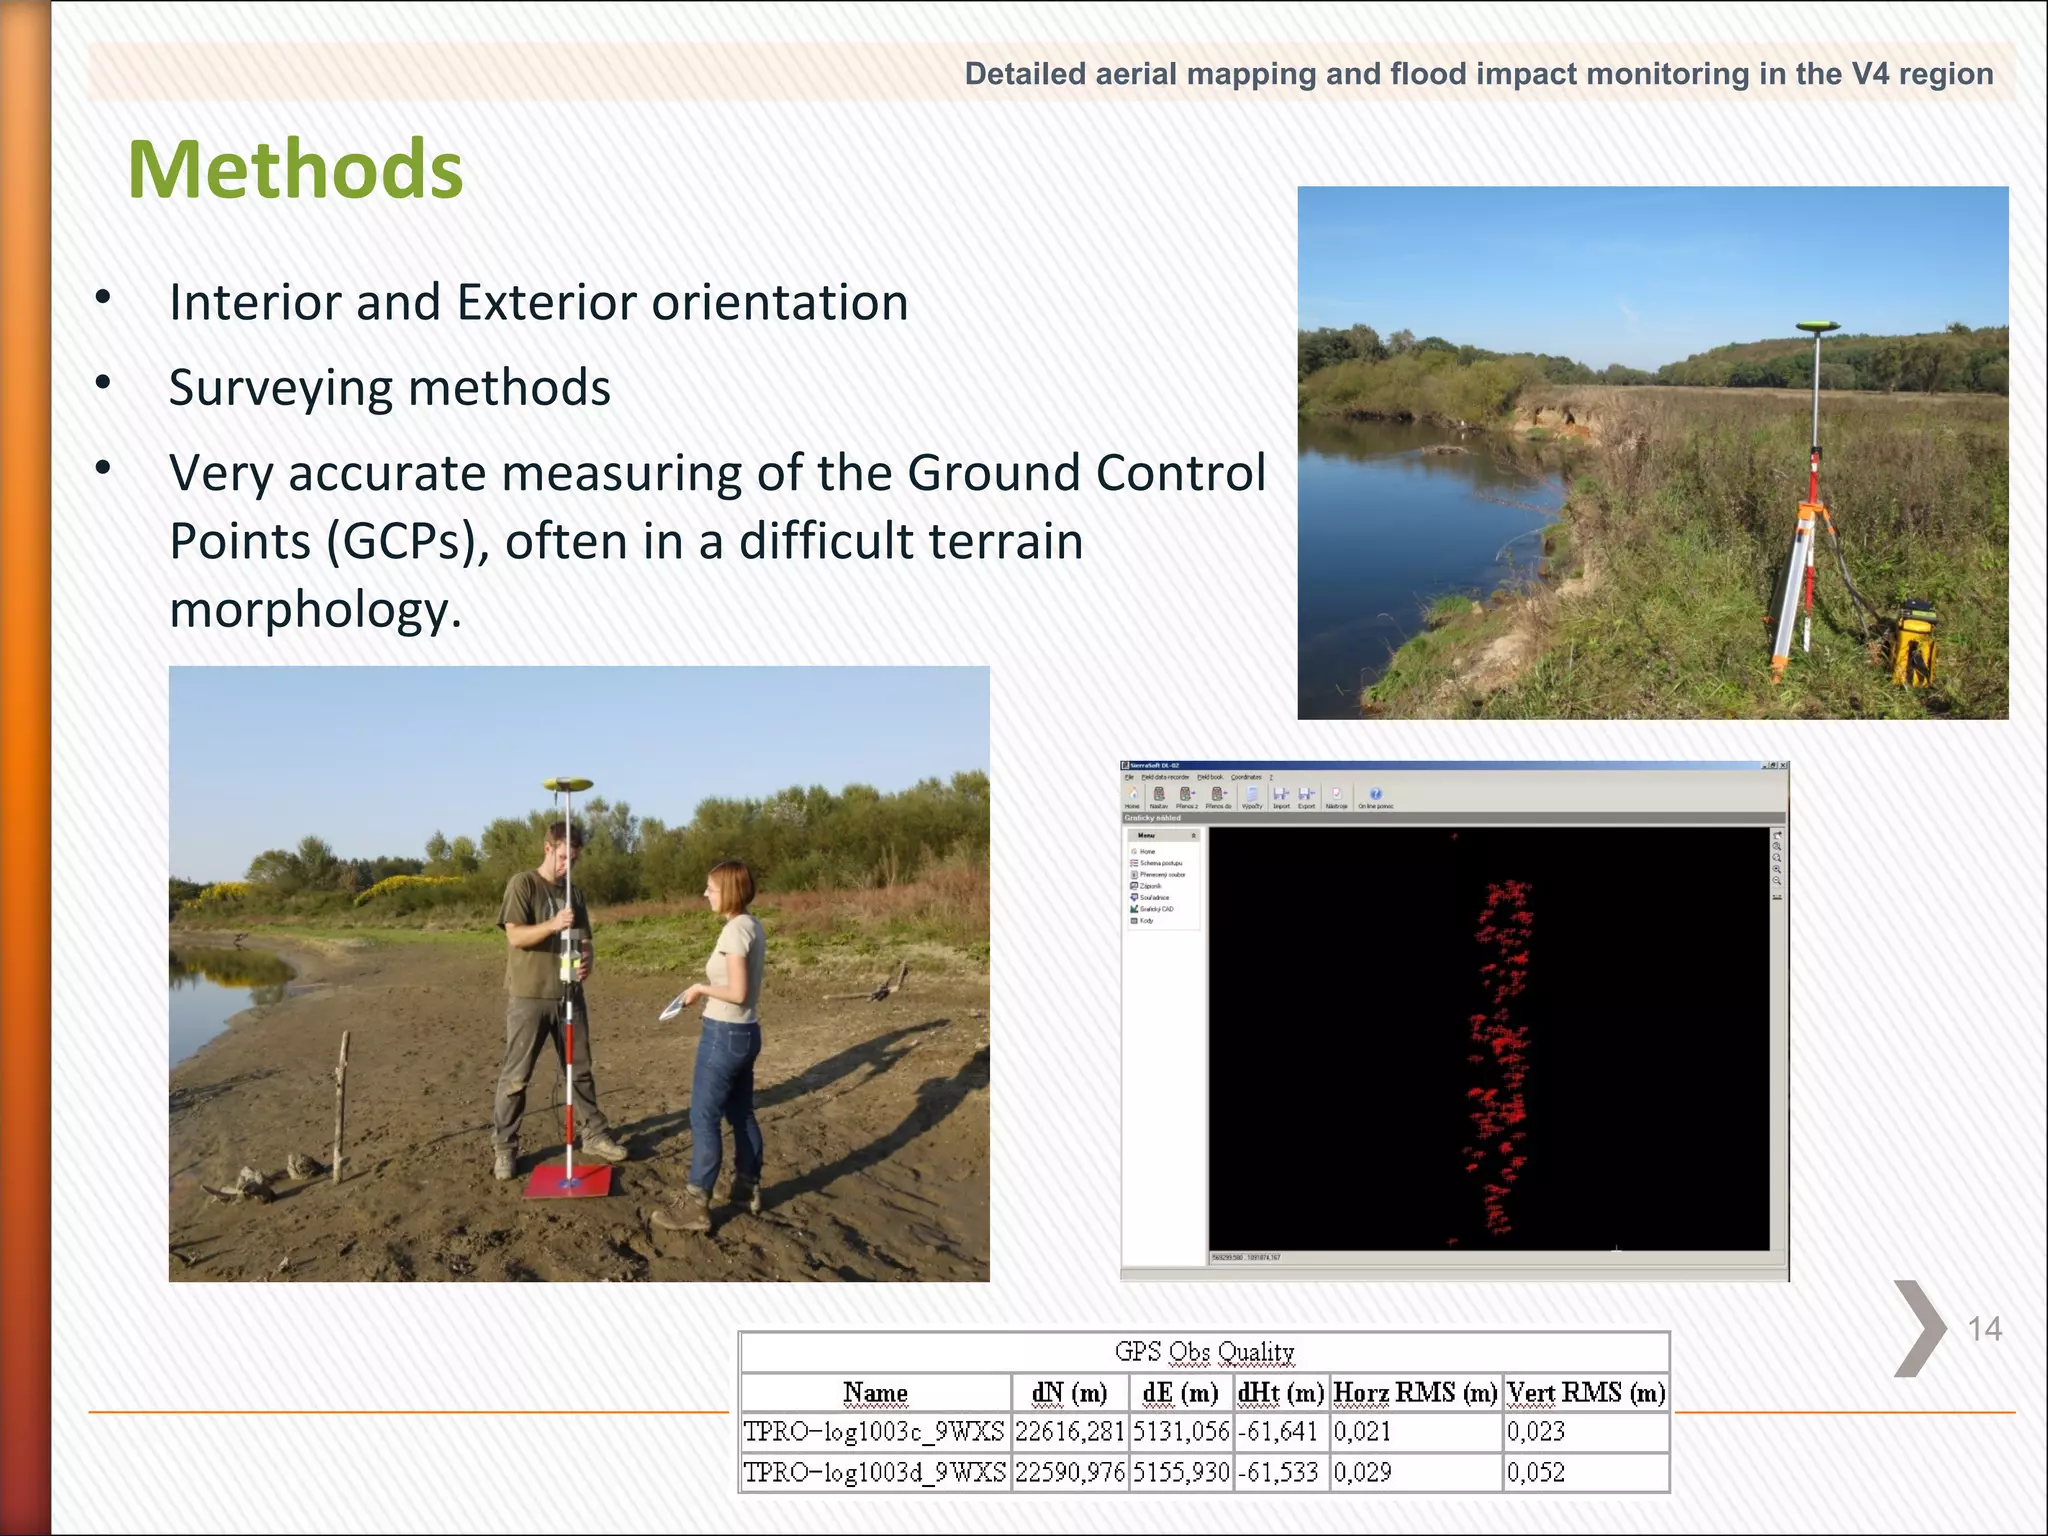
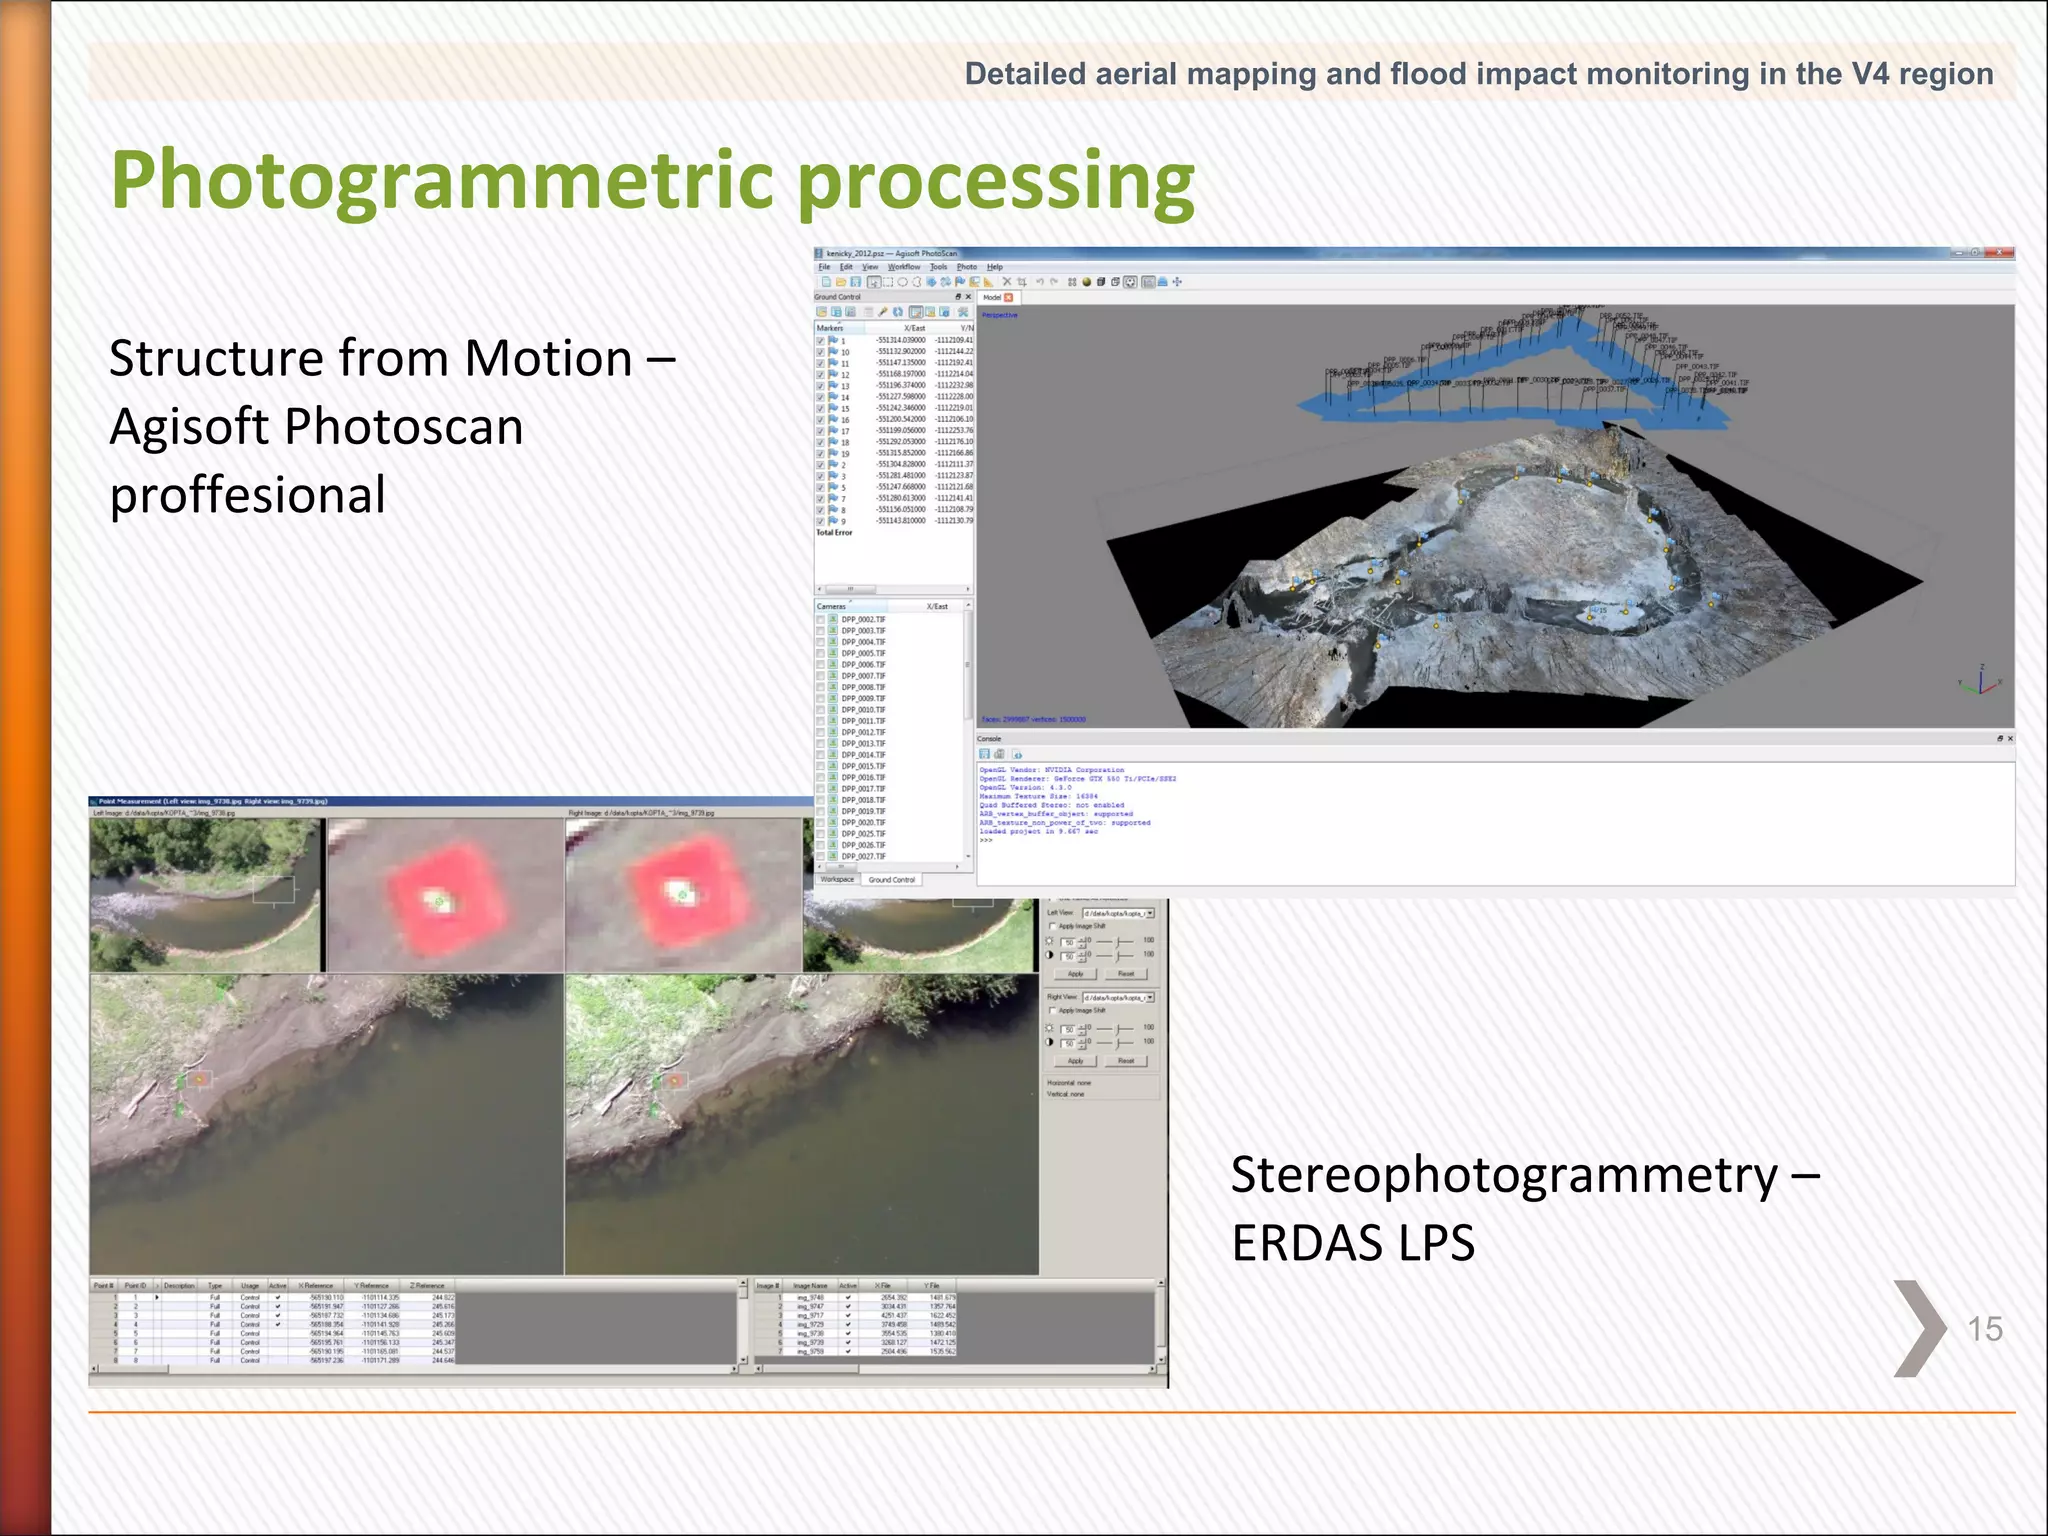
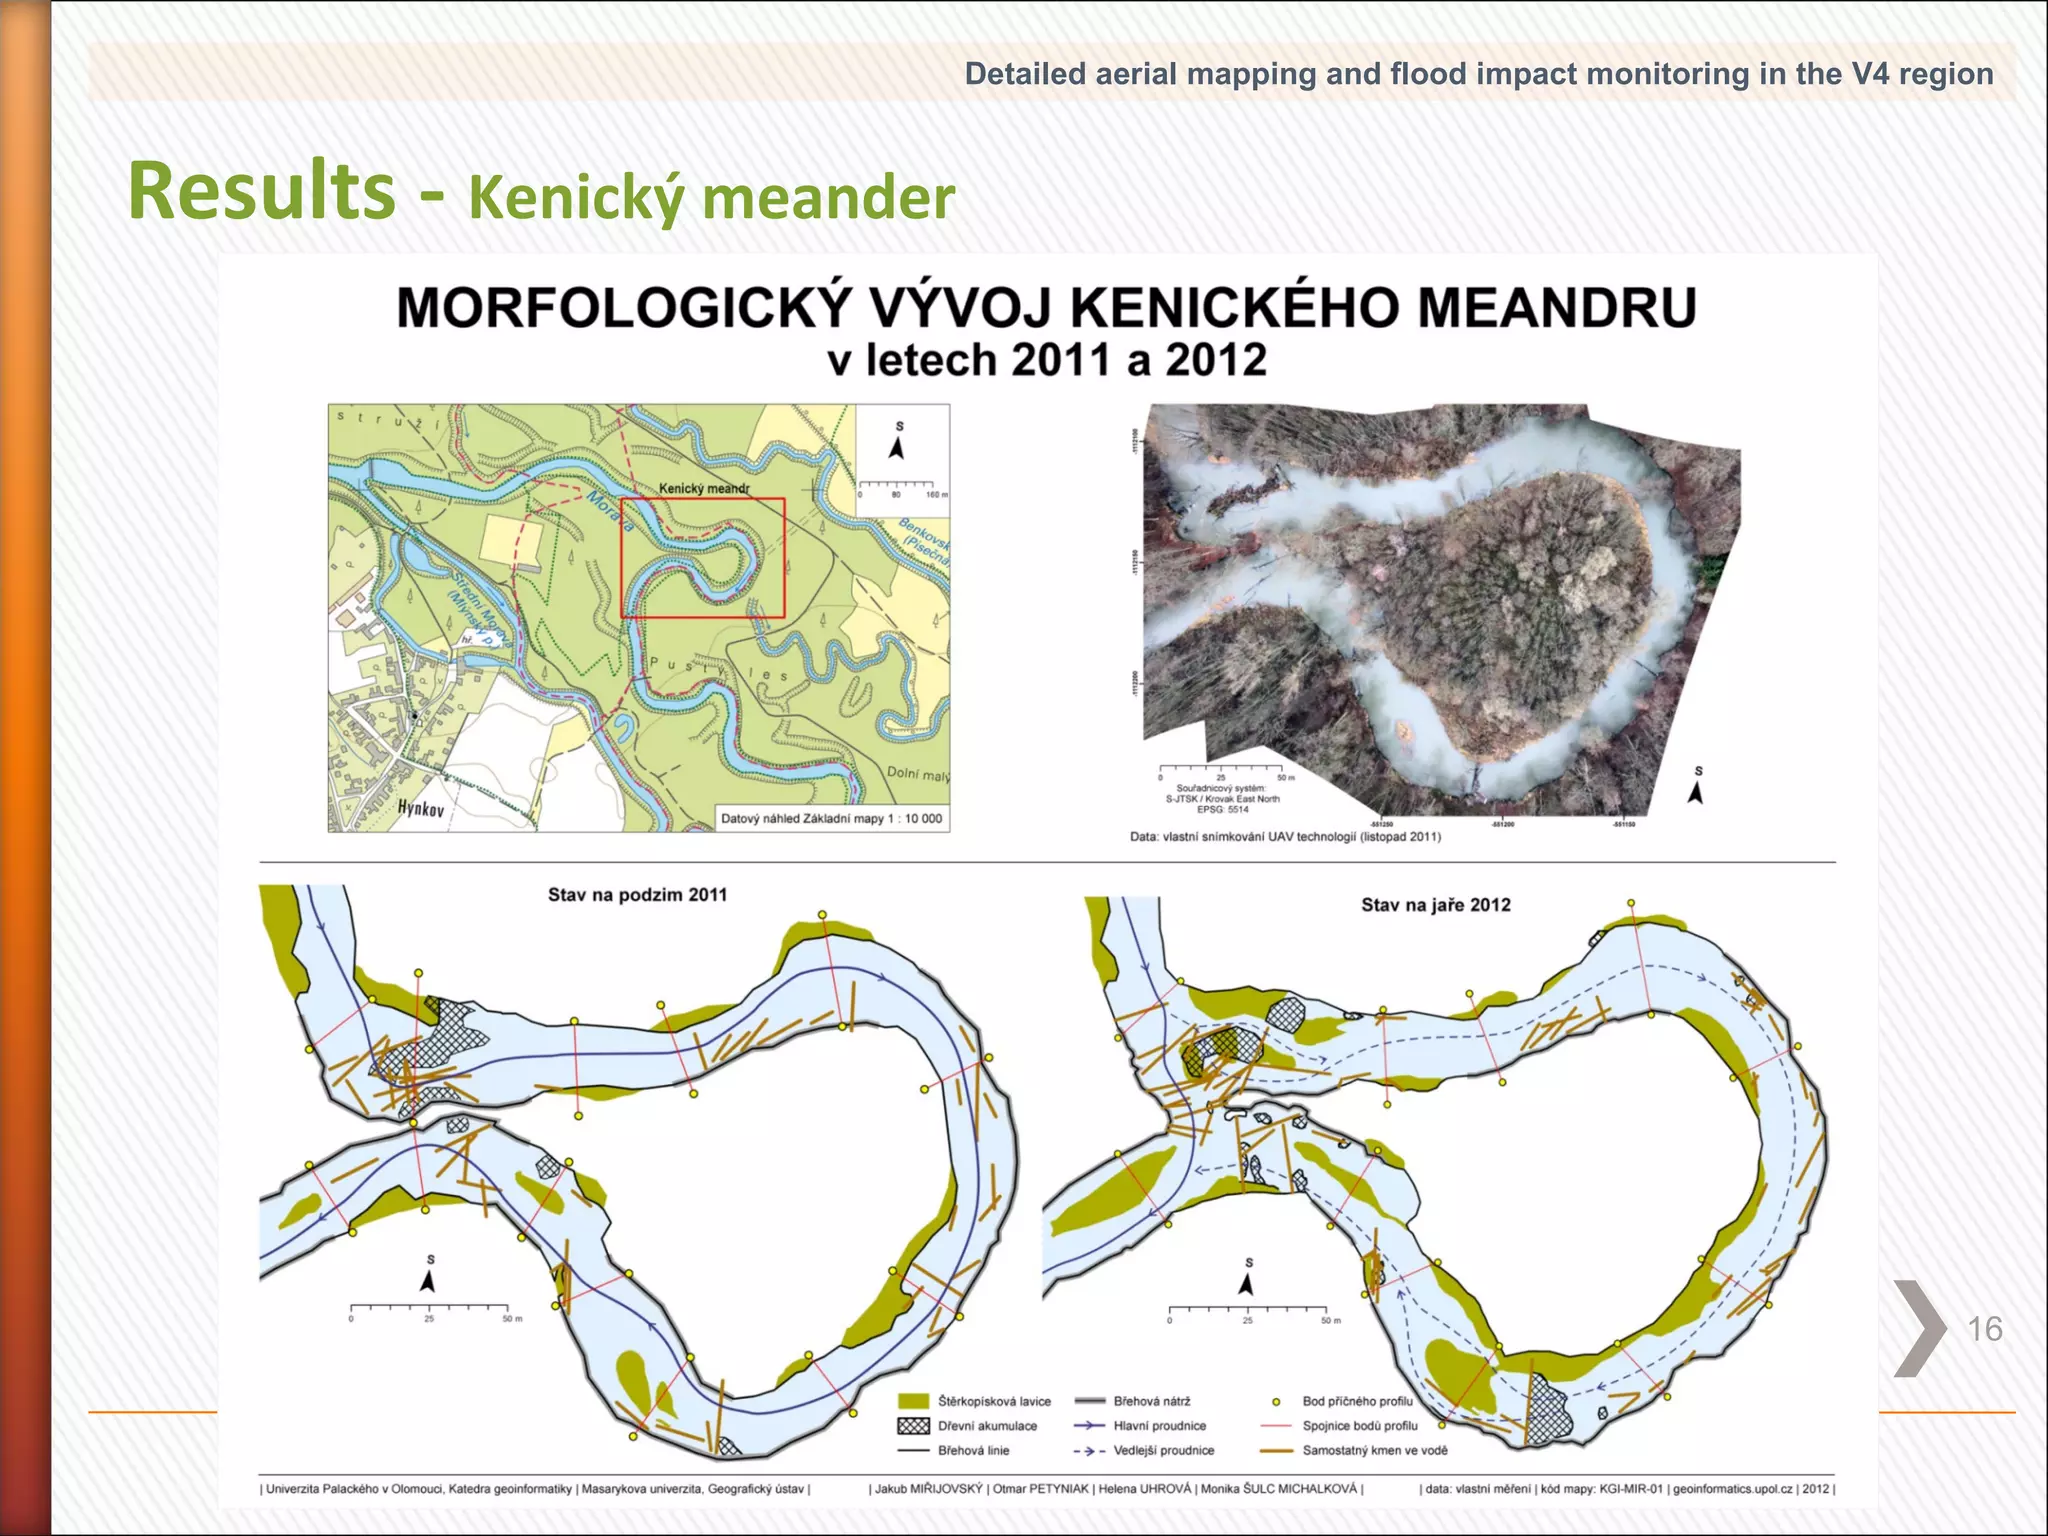
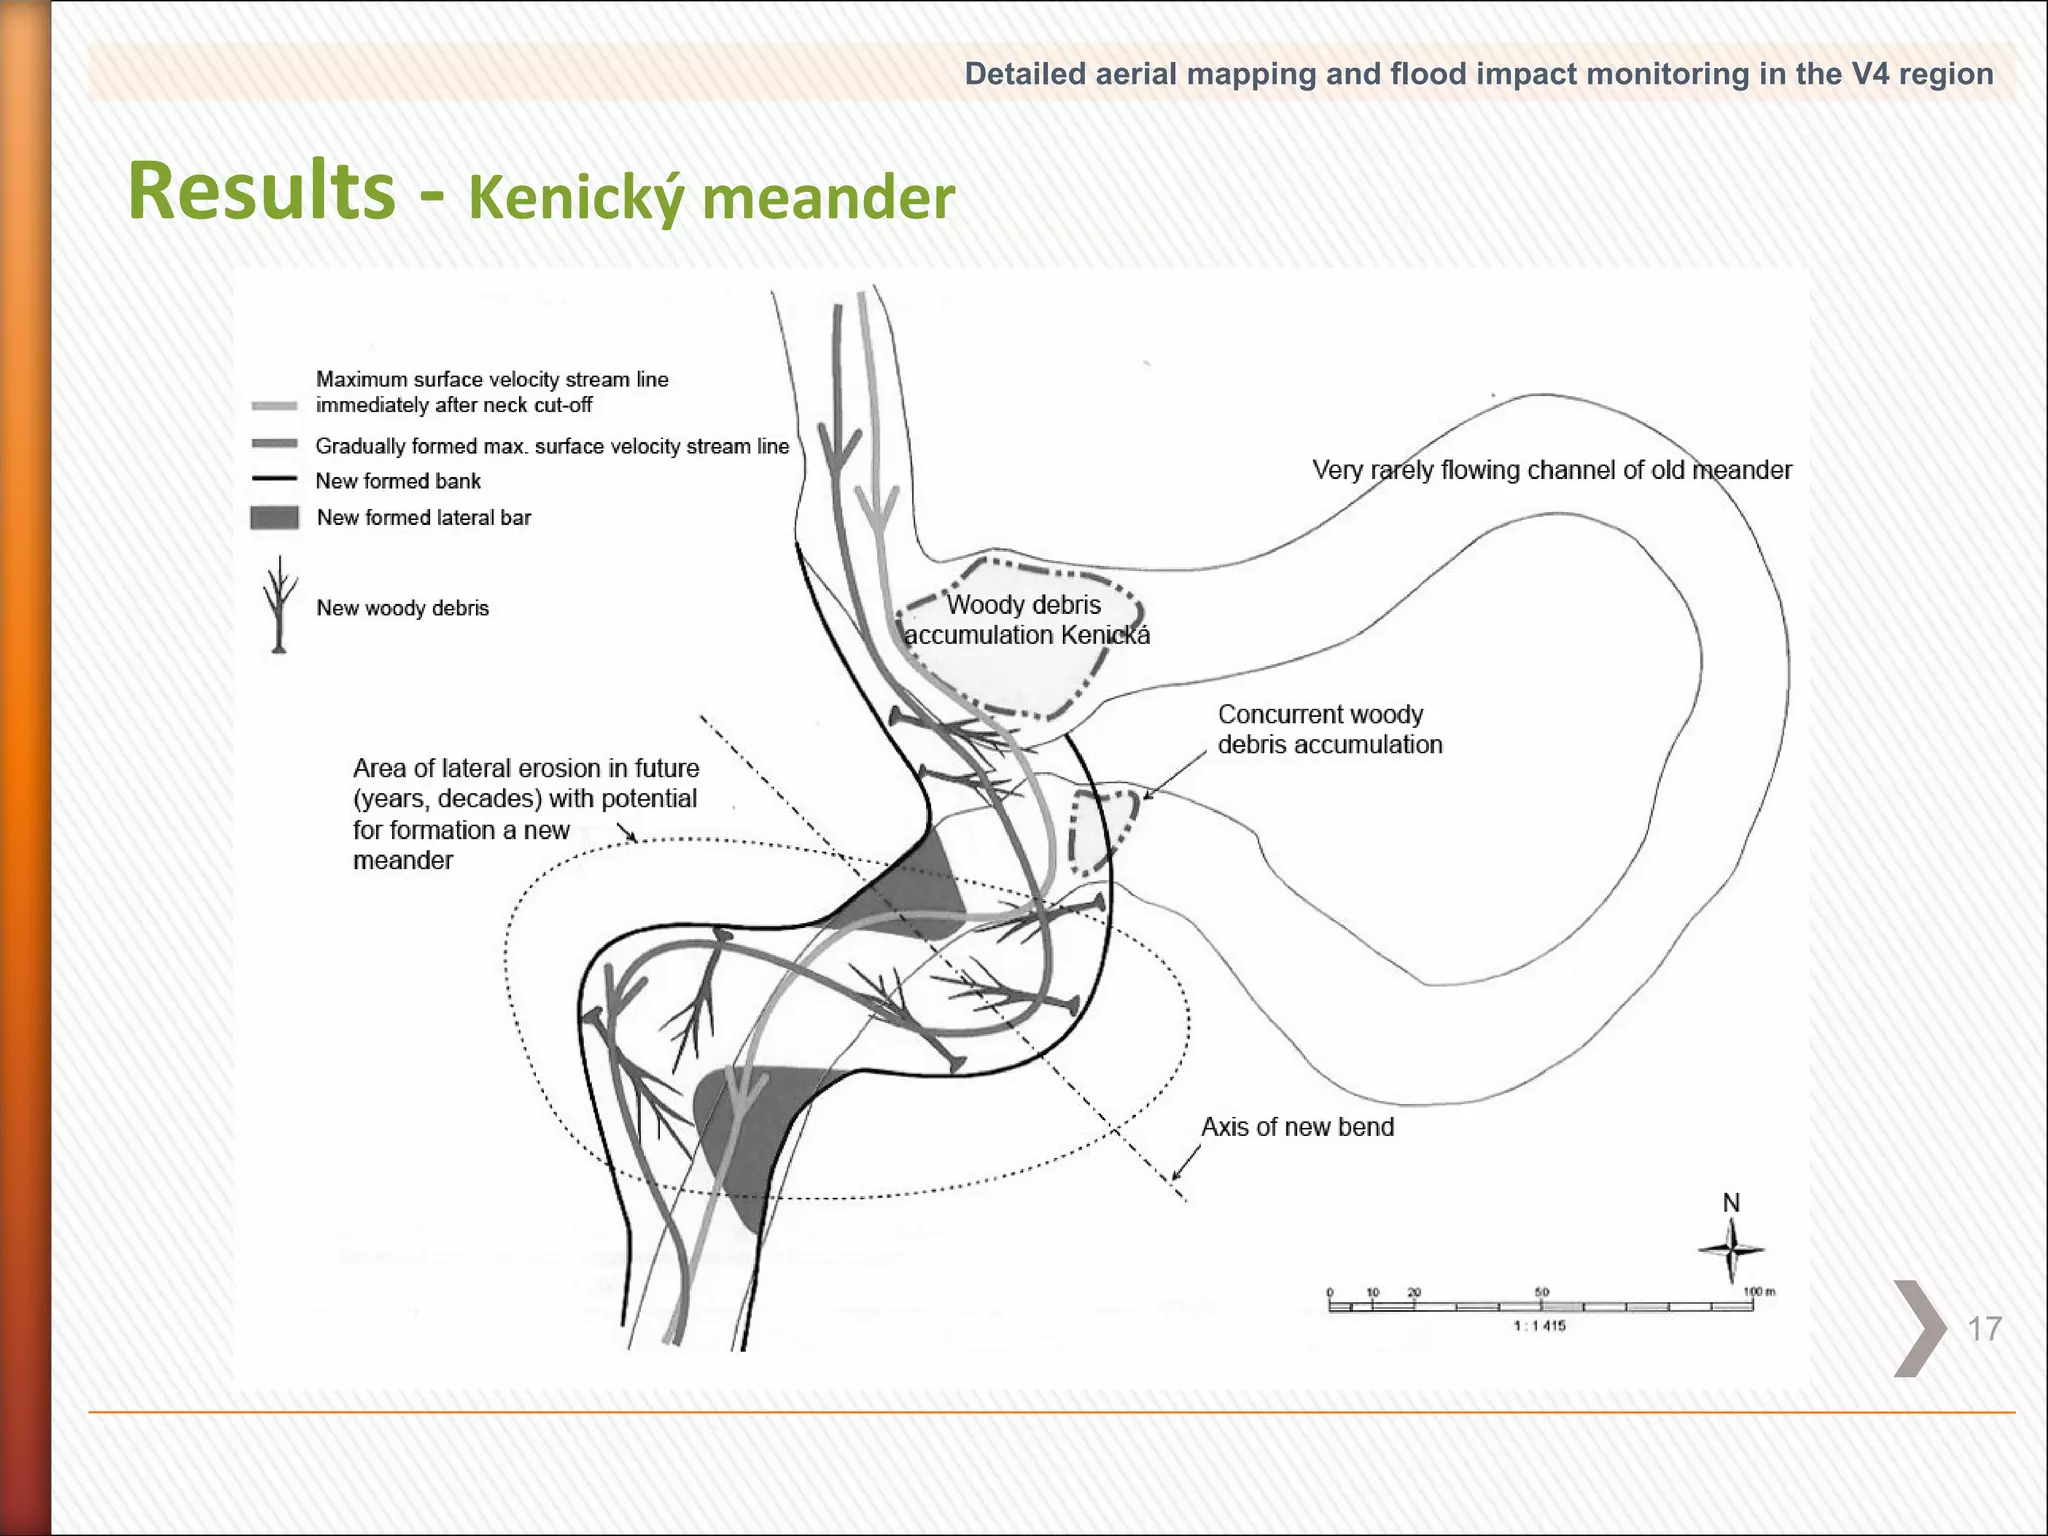
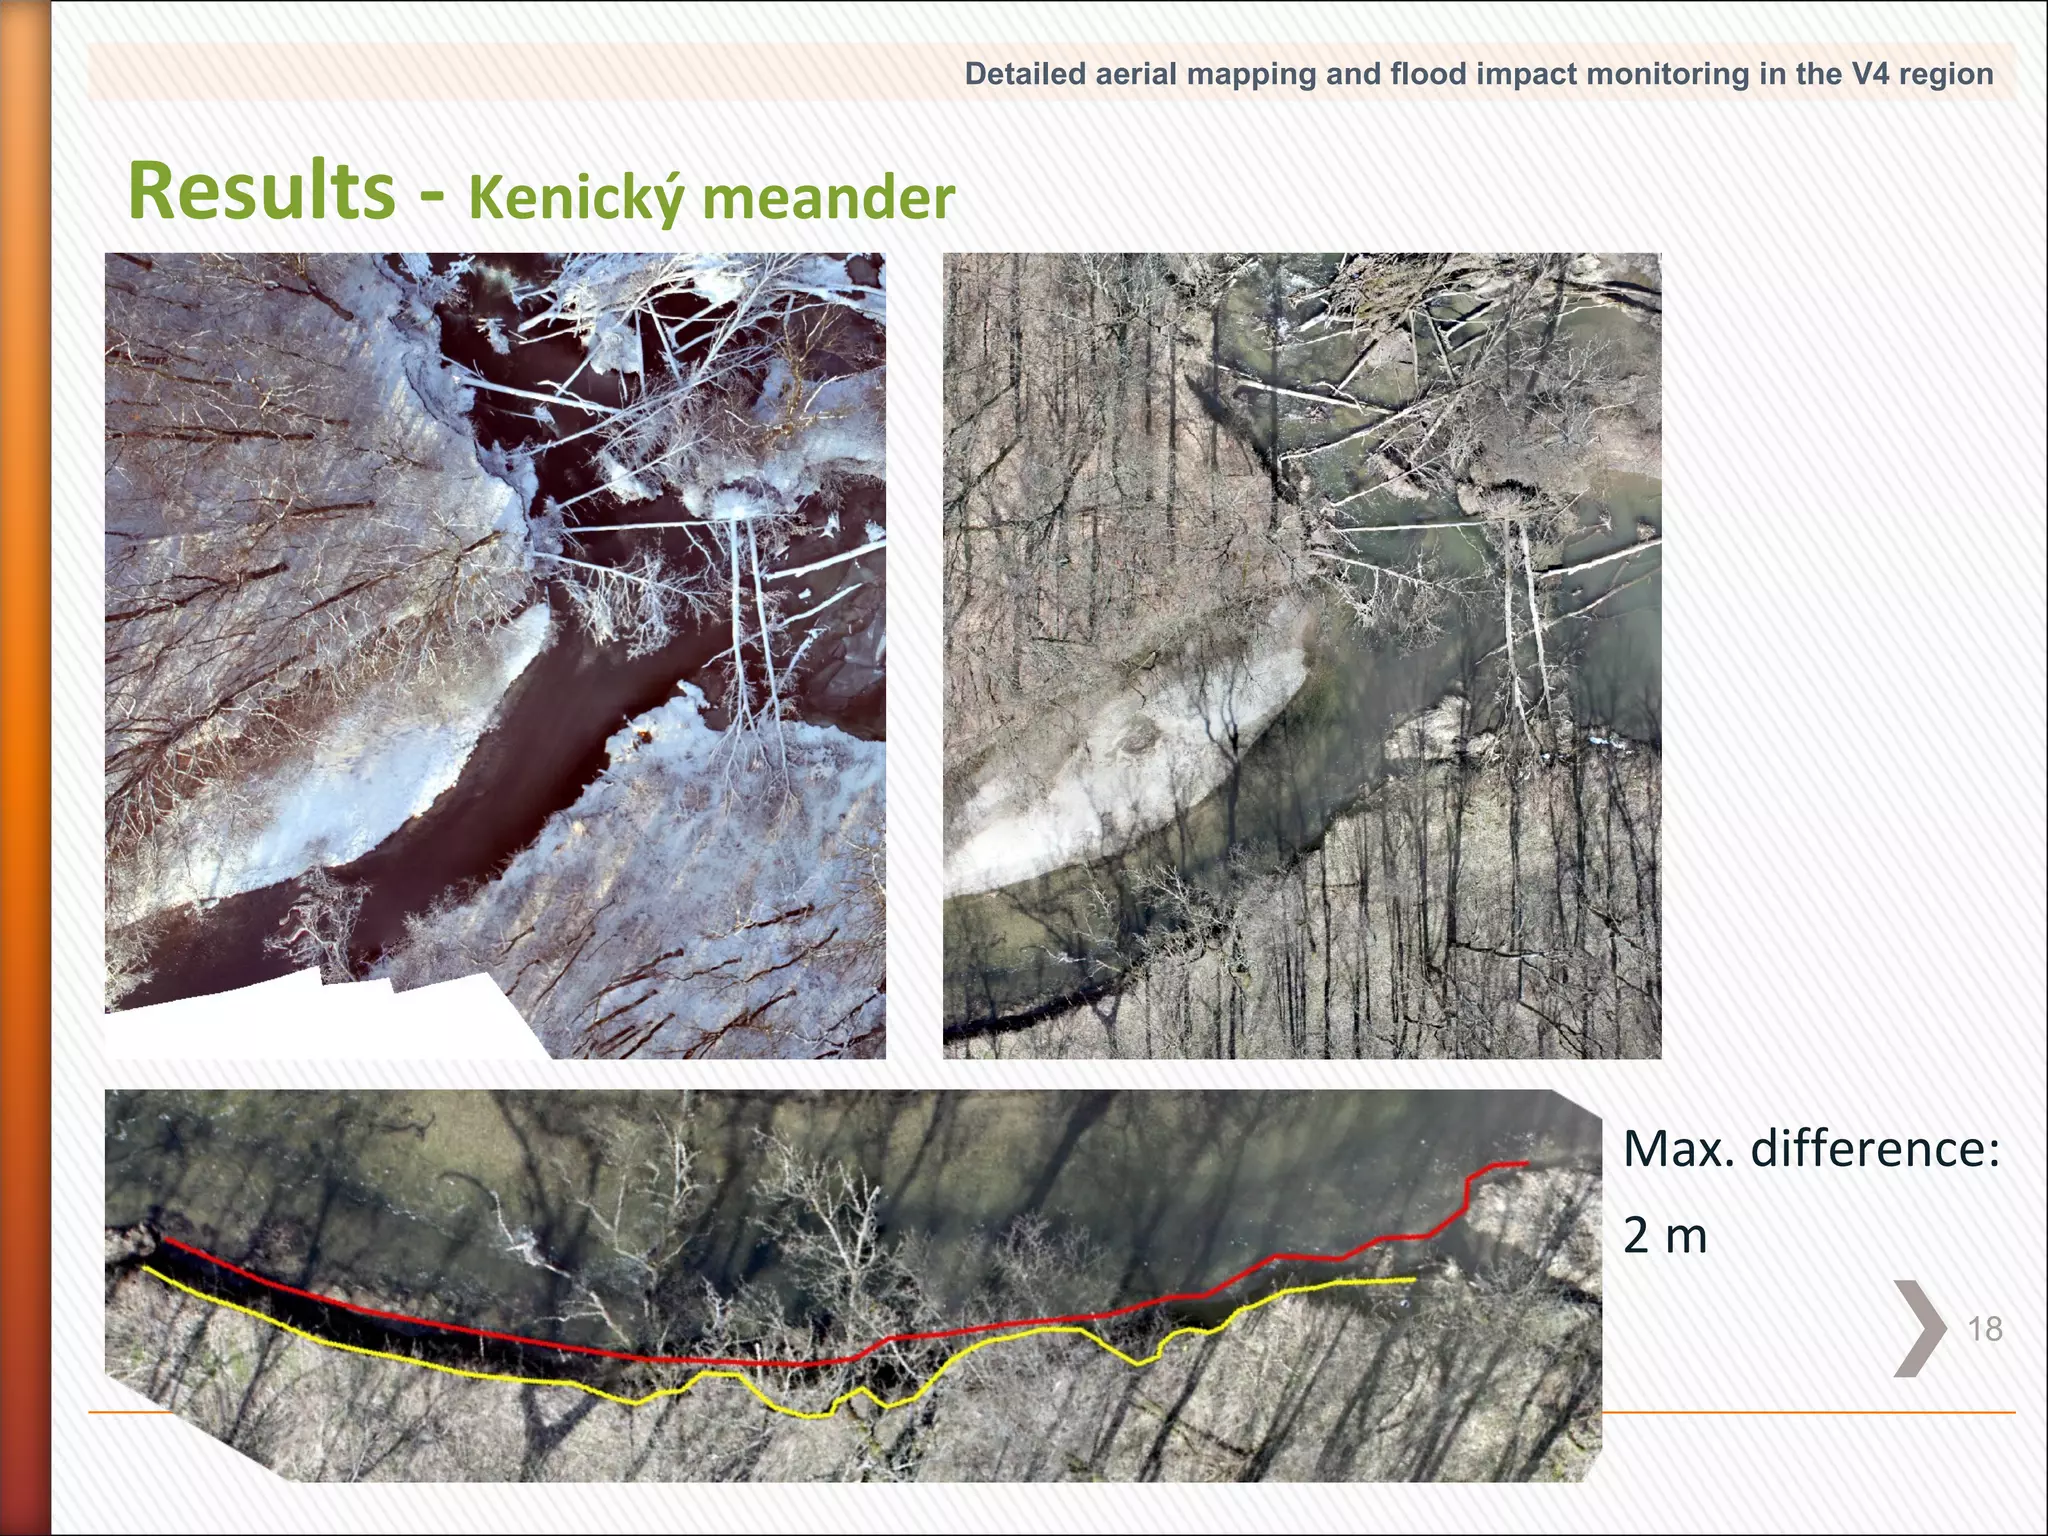
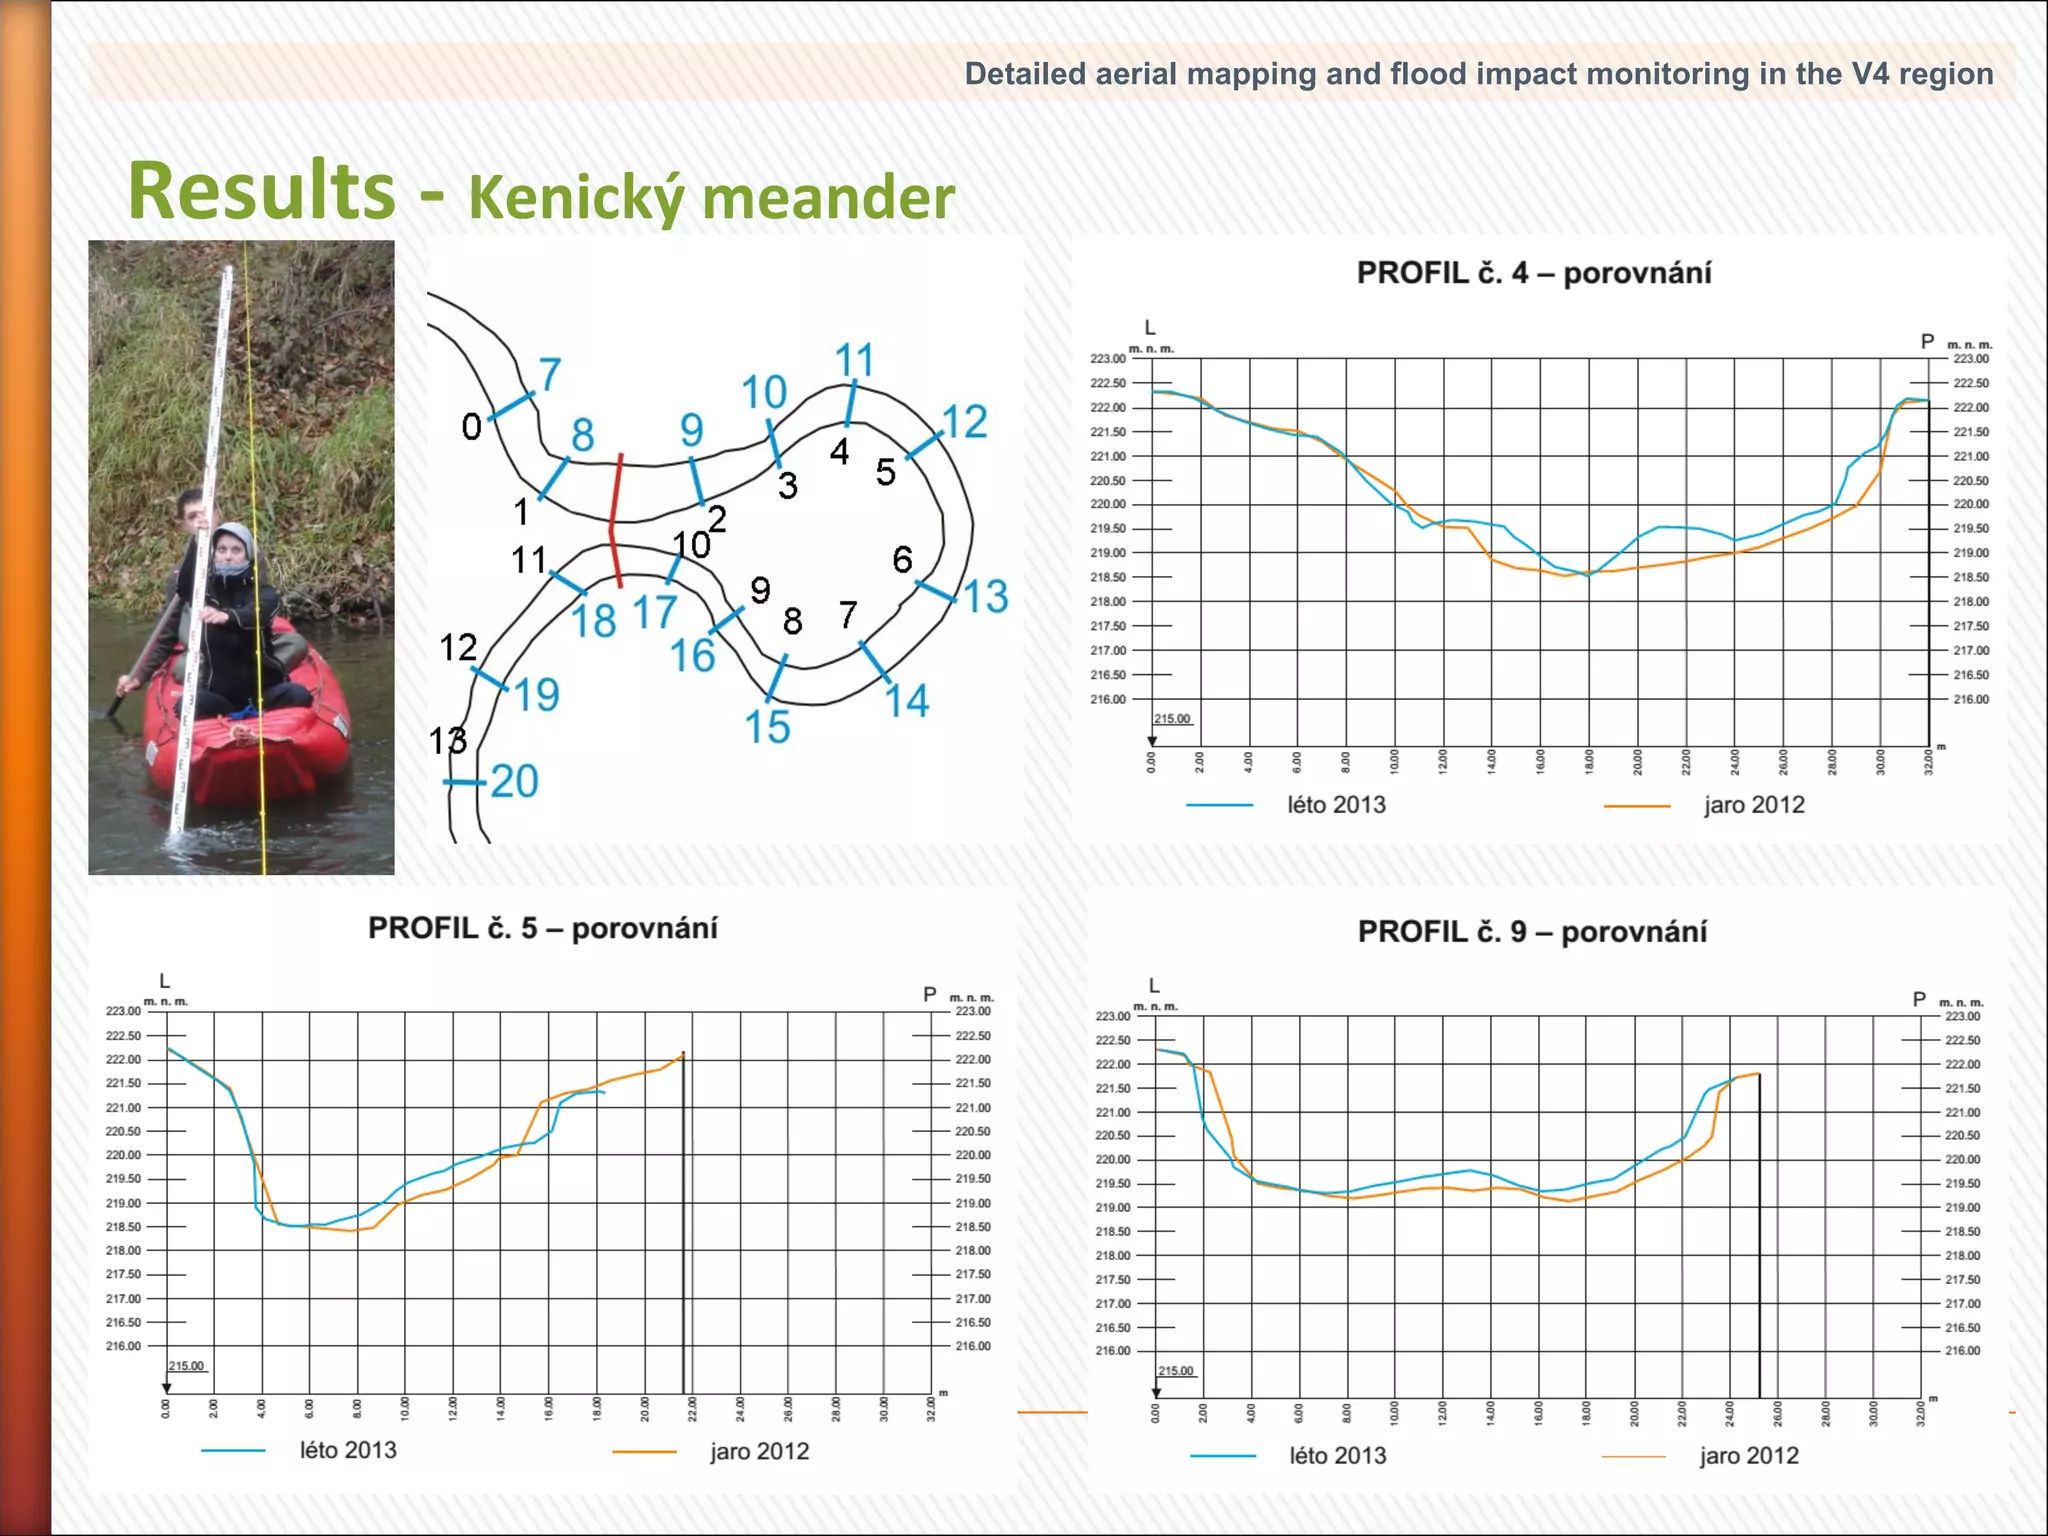
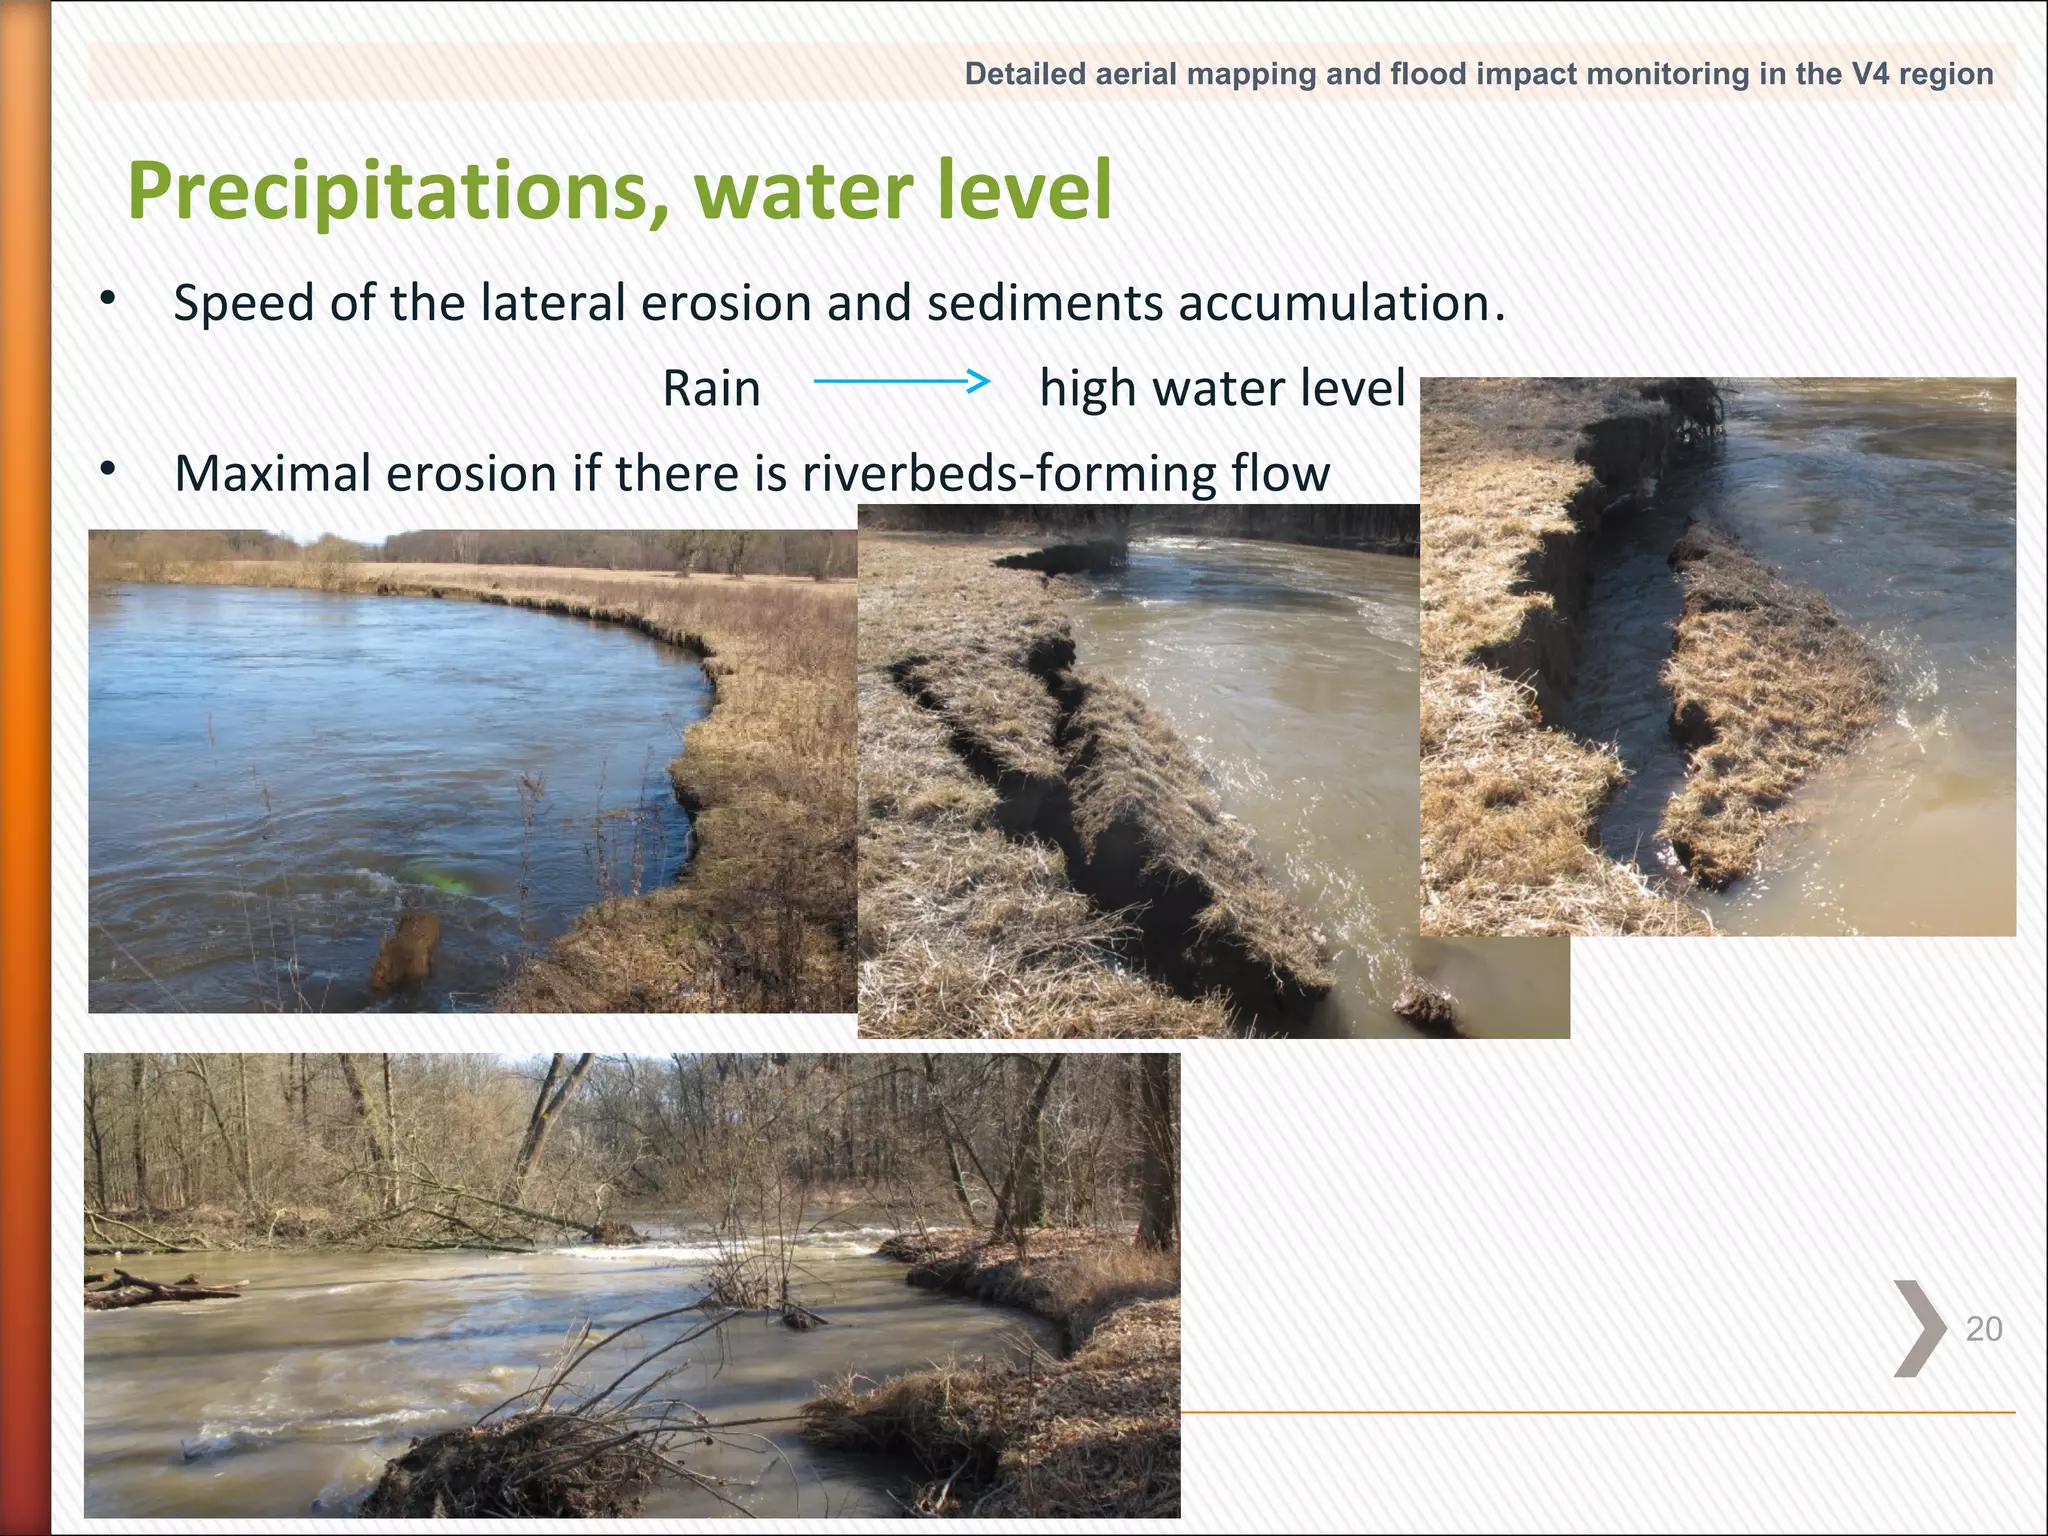
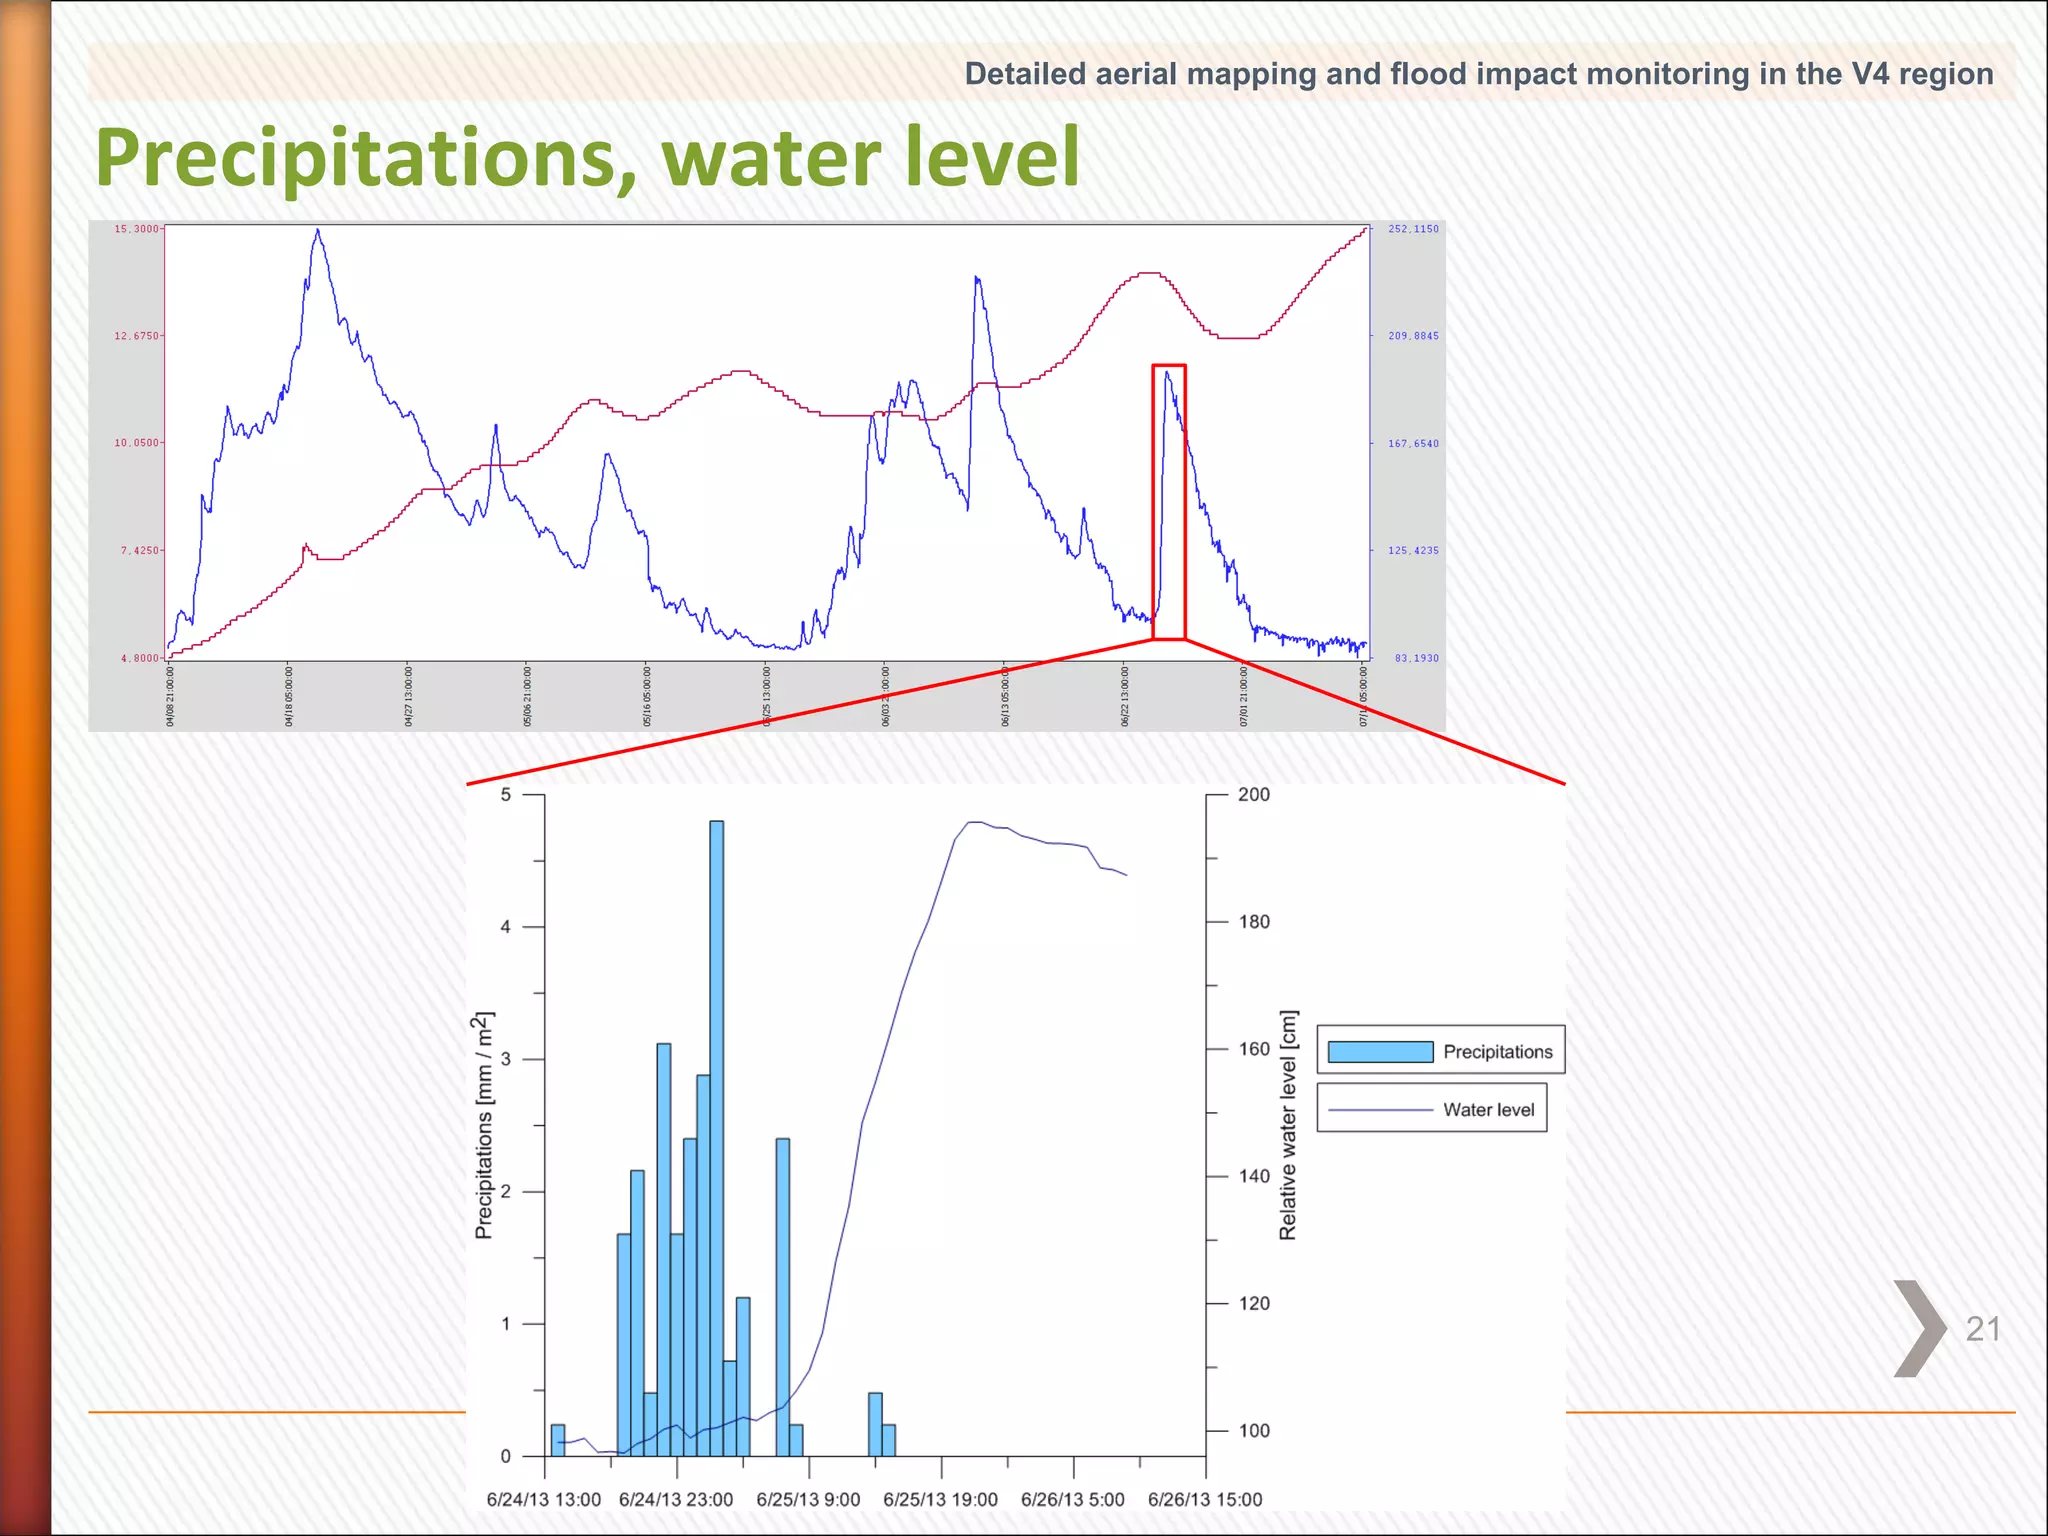
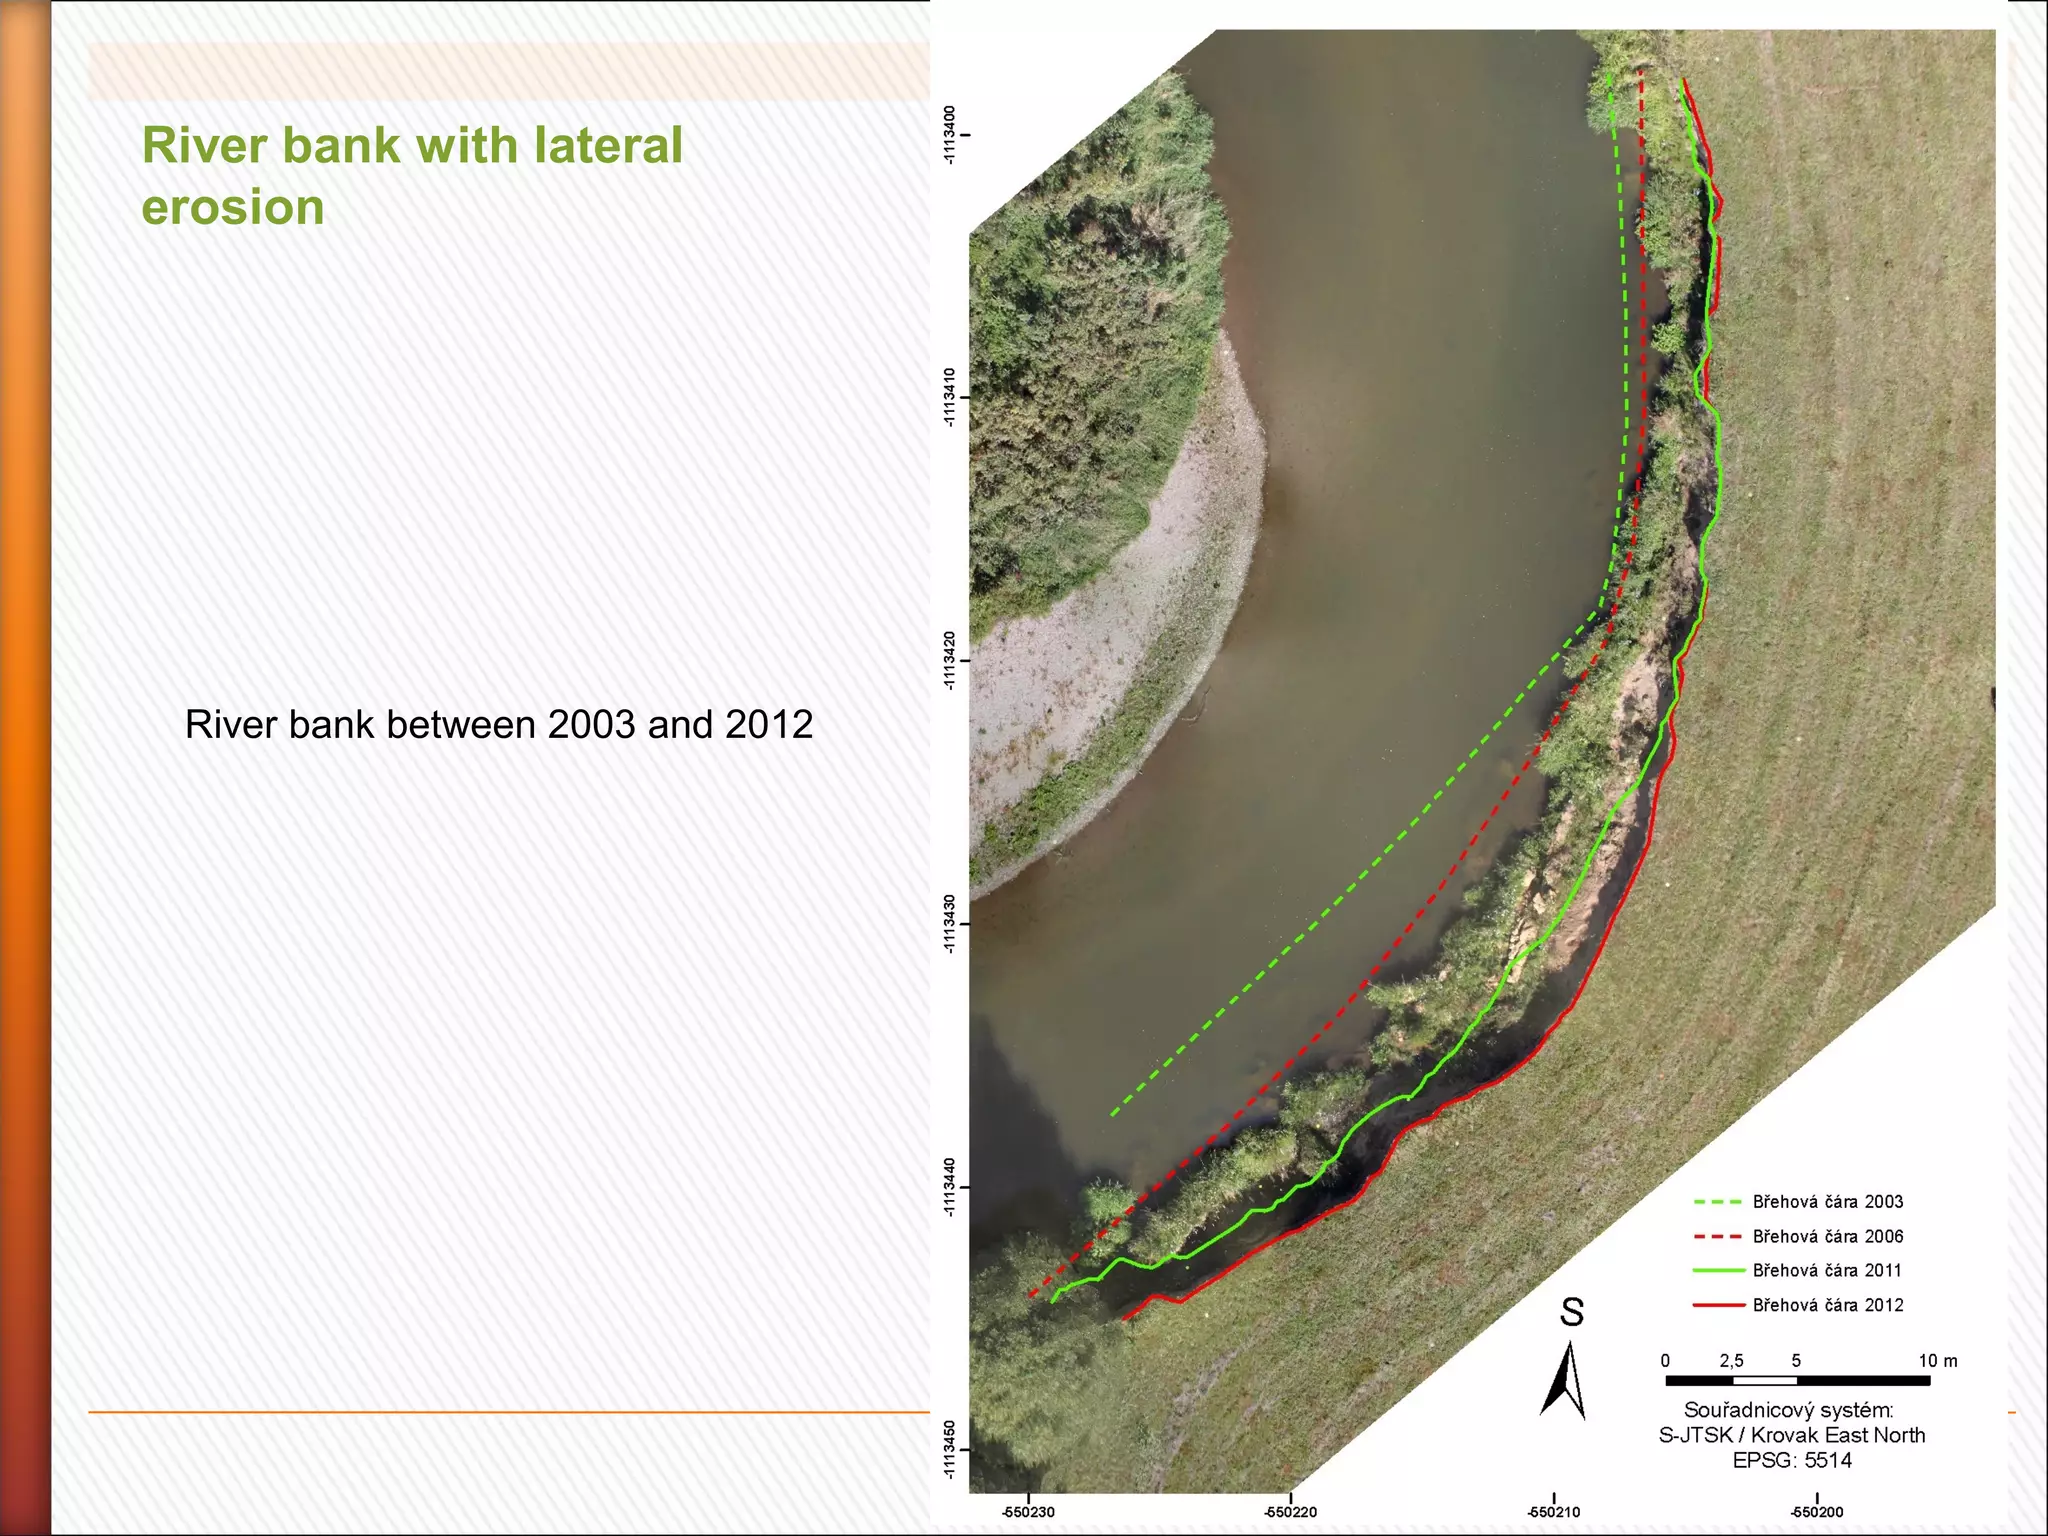
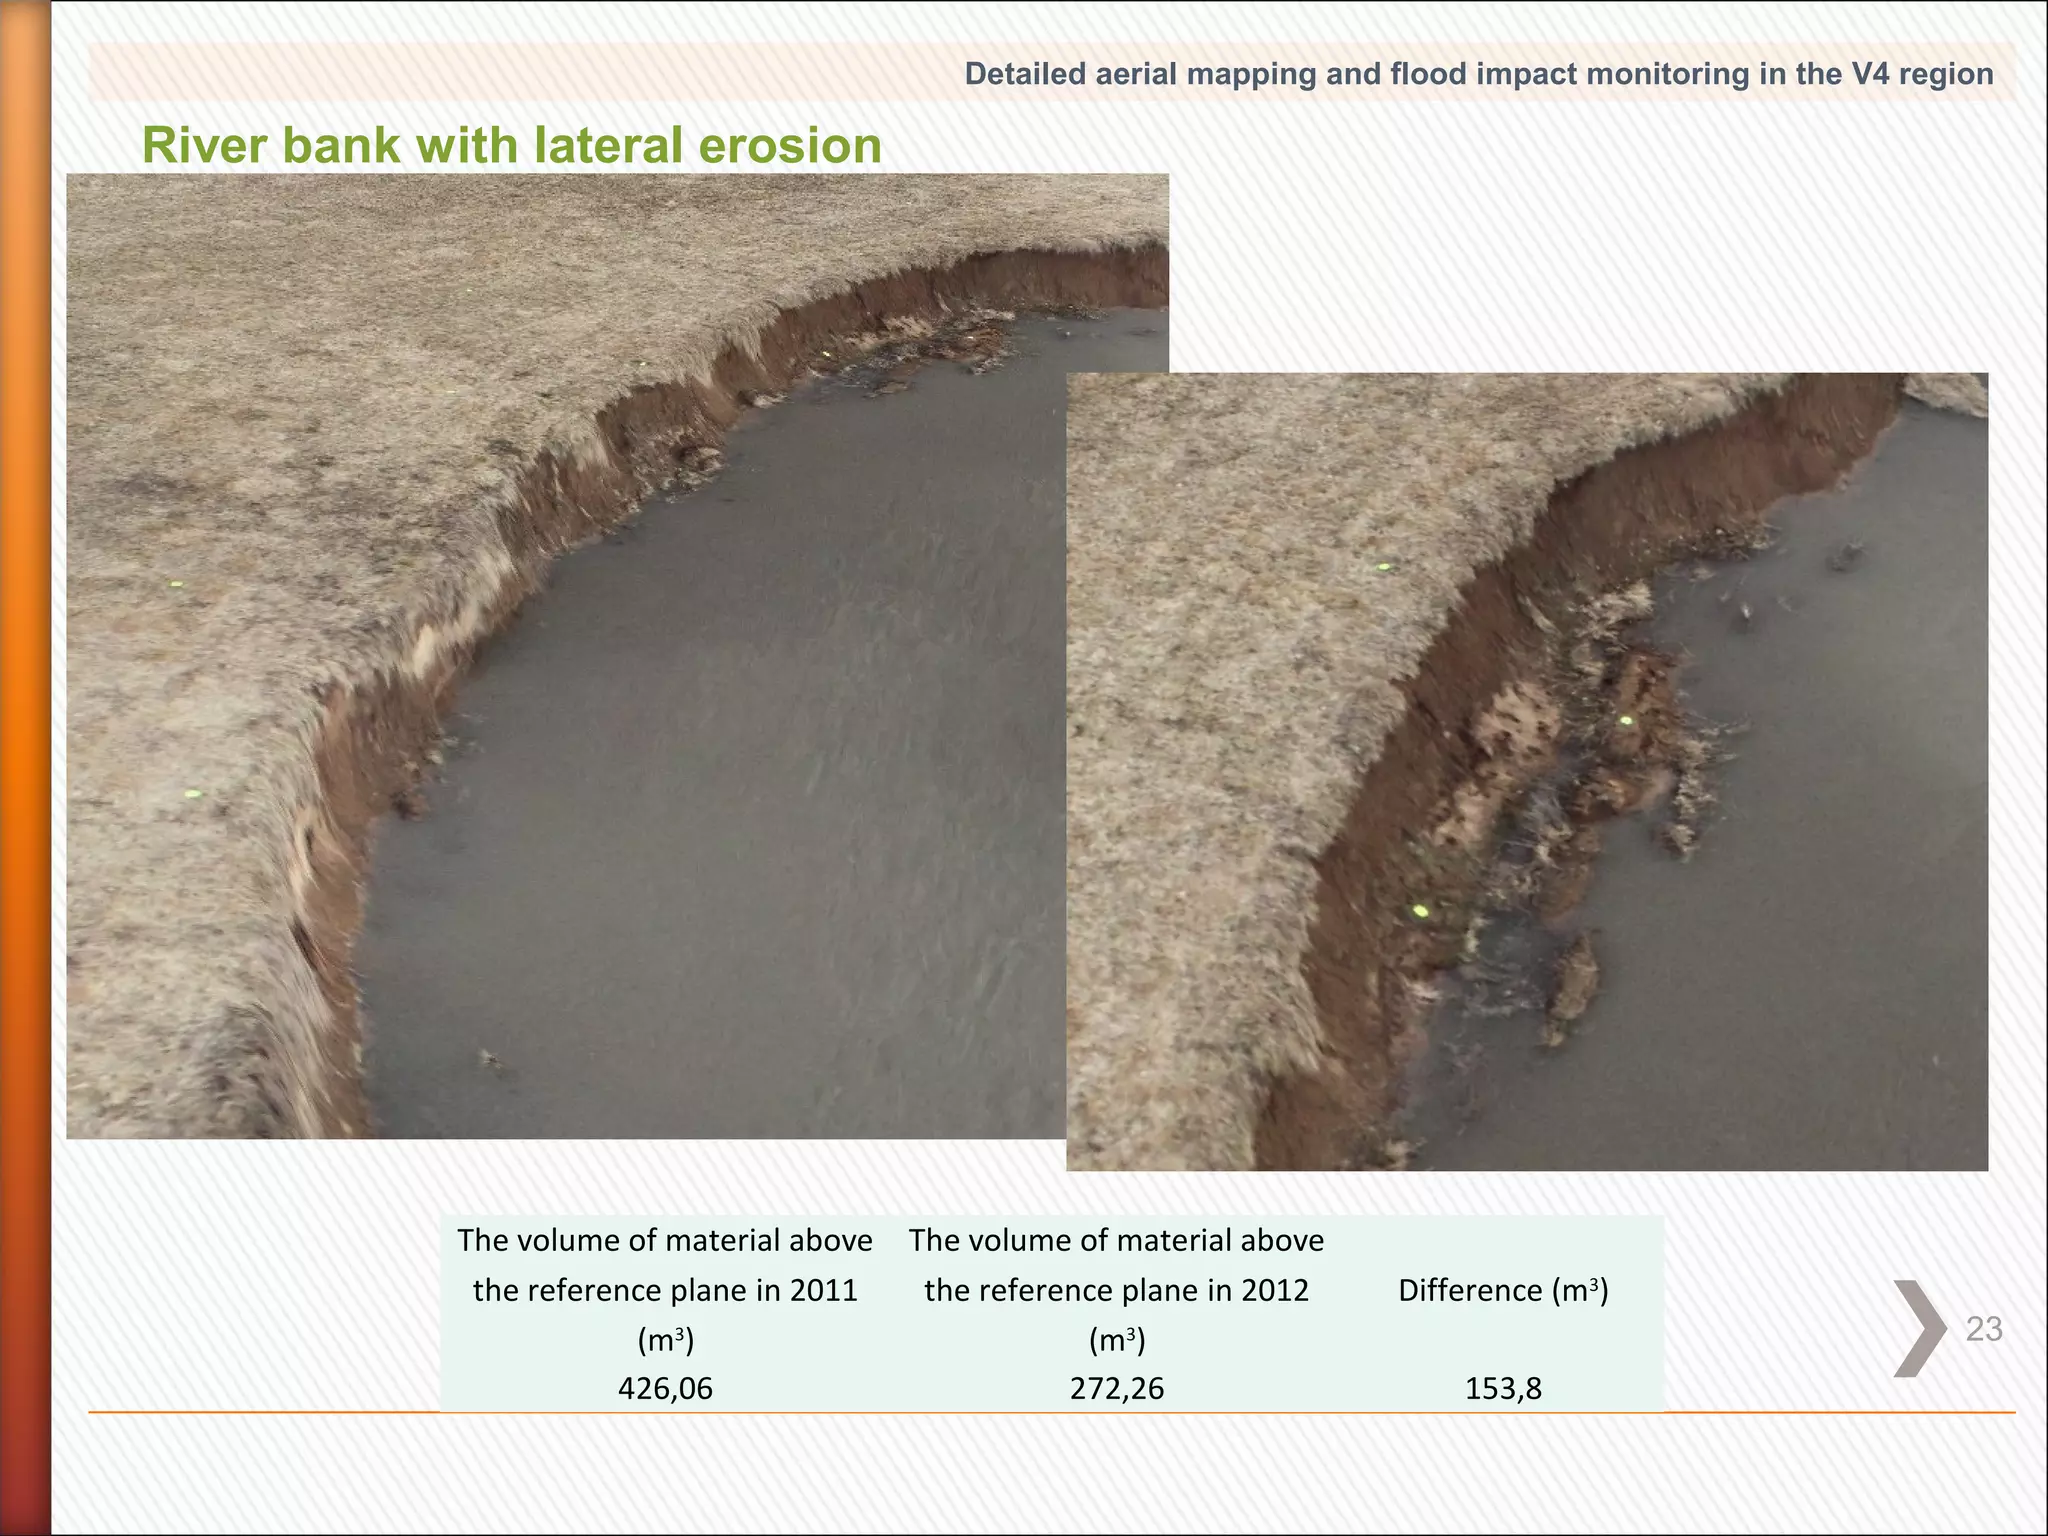
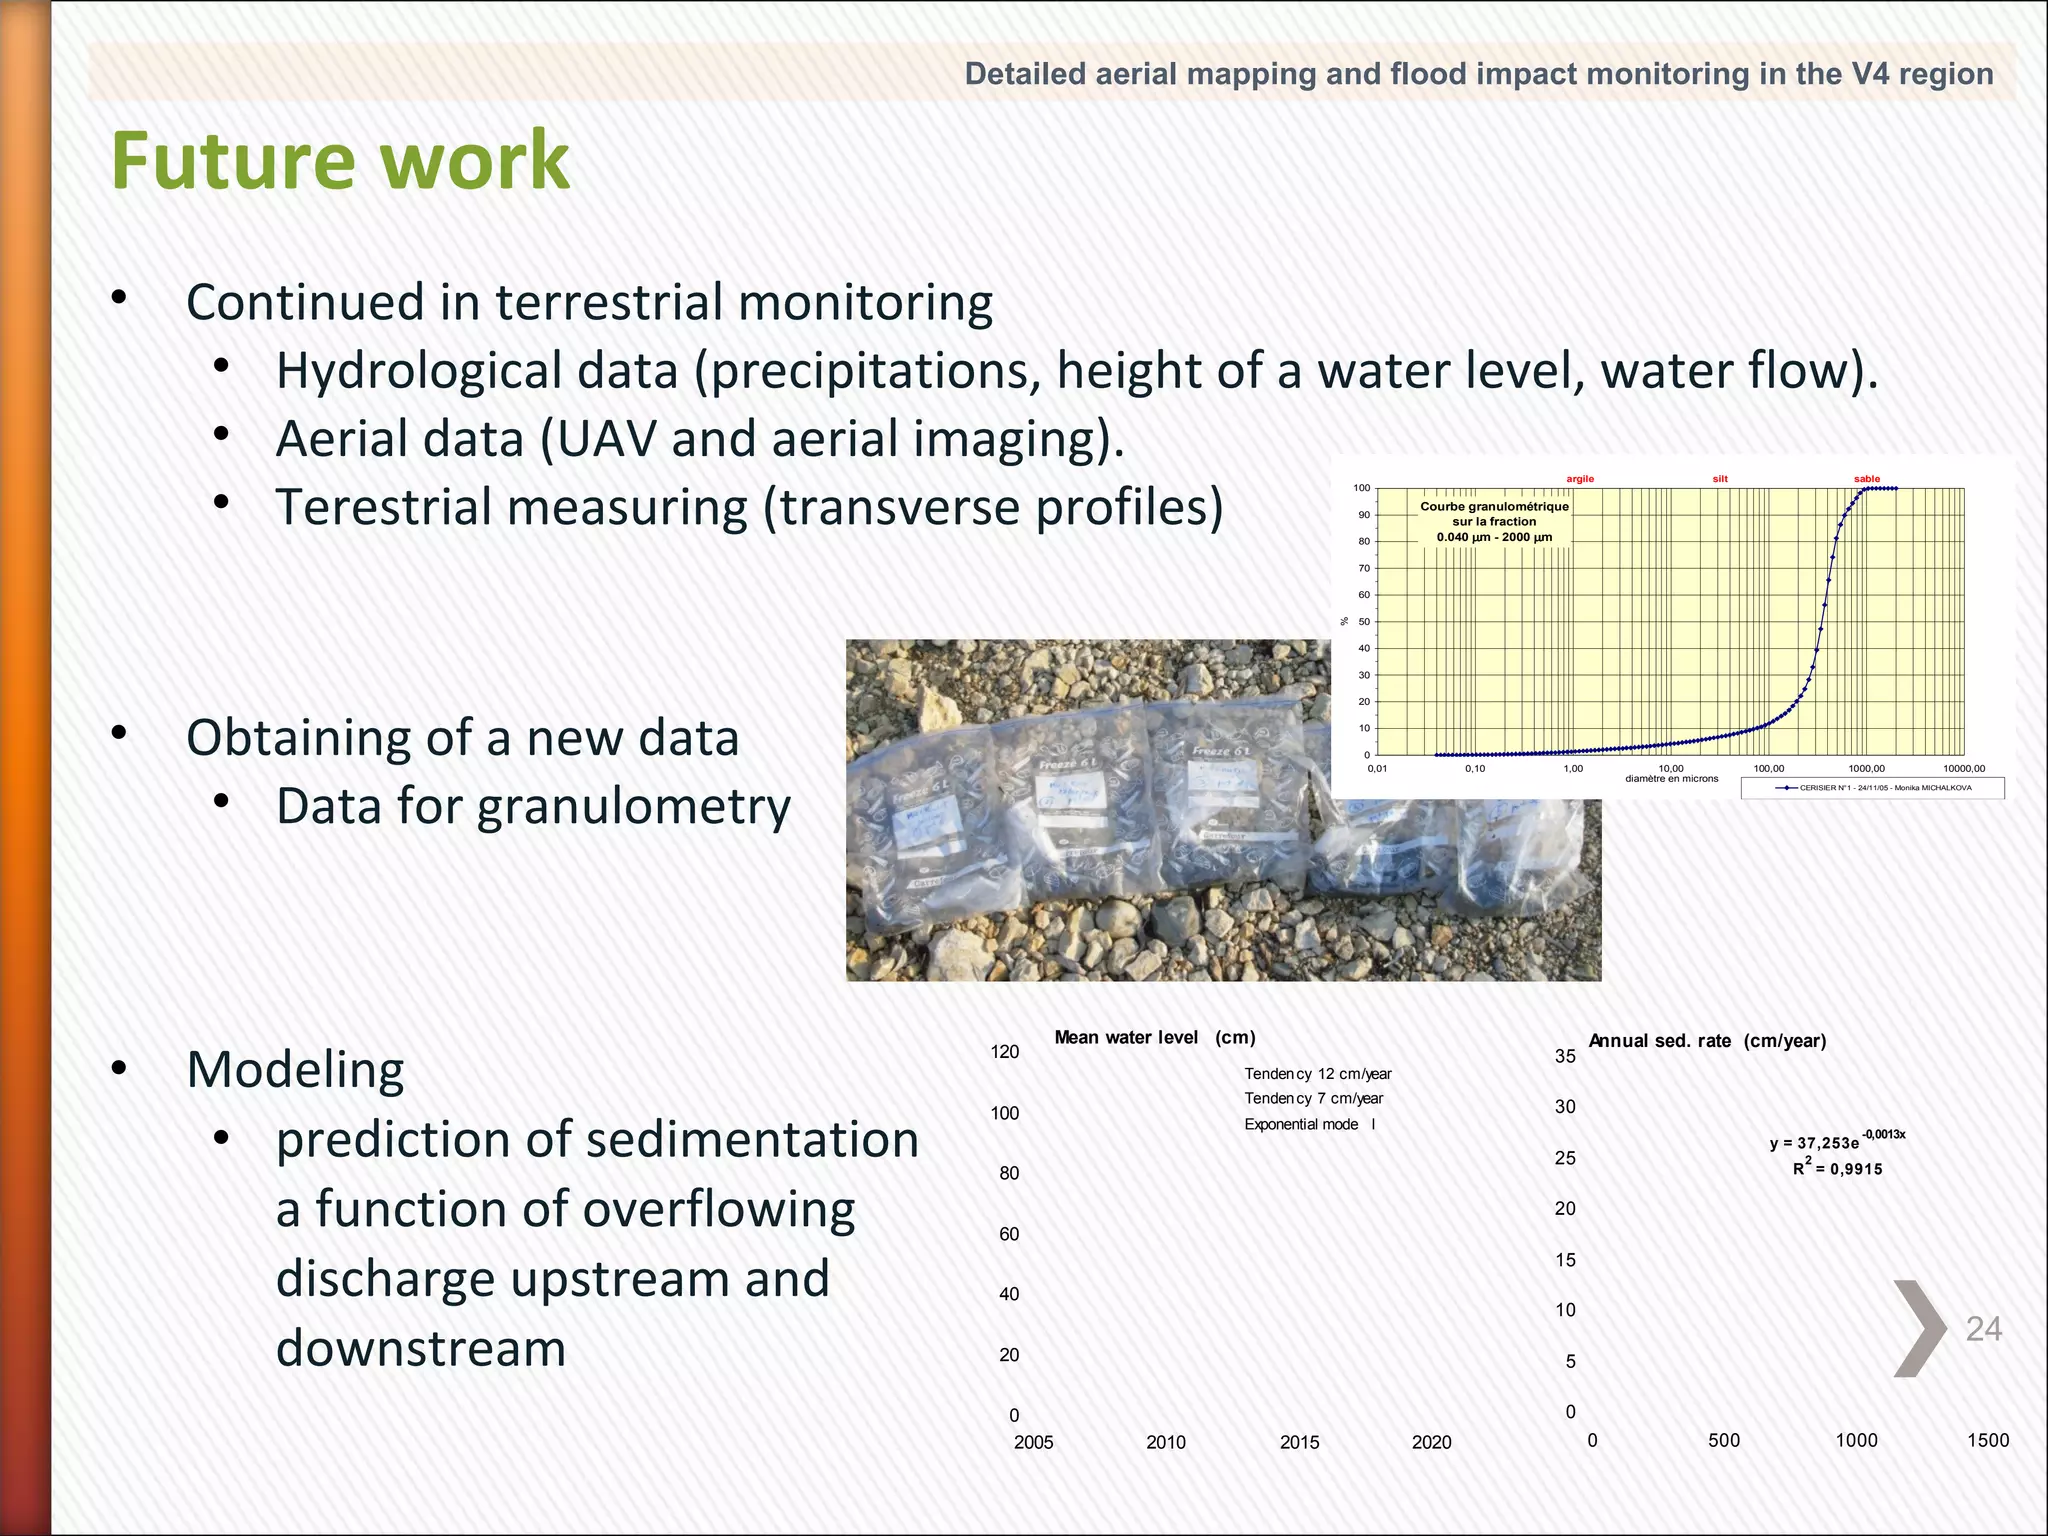
The document details aerial mapping and flood monitoring in the Morava River region of the Czech Republic. The main goals are detailed aerial and terrestrial mapping of low-lying floodplain regions near active rivers to monitor flood impacts over time. Methodologies used include aerial photography with drones and planes, as well as sediment sampling, hydrological monitoring, and geodetic surveying. Initial results from mapping a meander of the Morava River show high detail with measurement differences of under 2 meters. Ongoing work includes continued monitoring of hydrological data, aerial imagery, and modeling sedimentation rates.
2. Detailed aerial mapping and flood impact monitoring in the V4 region
Short description
•
•
Main aim is: Detailed aerial and terrestrial mapping and flood impact
monitoring in the Morava River region (Litovelské Pomoraví Protected area,
Osypané Břehy)
Main target area are lowland regions and region of floodplains near active
rivers.
Source: Český úřad zeměměřický a katastrální
1.
Meander in the Osypané břehy locality
2
3. Detailed aerial mapping and flood impact monitoring in the V4 region
Area of interest
Source: Český úřad zeměměřický a katastrální
1.
Kenický meander
2.
river bank with lateral erosion
3
4. Detailed aerial mapping and flood impact monitoring in the V4 region
Floodplain lake
•
A floodplain lake is an area of fluvial hydrosystem spatial delimited by an axis
of ancient active channel.
•
It is composed from two parts: humid perifluvial (aquatic perifluvial zone with
ecoton zone) and terestric zone presented by an alluvial plug (Rollet, Citterio,
Piégay, 2004).
4
5. Detailed aerial mapping and flood impact monitoring in the V4 region
Floodplain lake
•
Floodplain lake is most of
the year without water
5
6. Detailed aerial mapping and flood impact monitoring in the V4 region
Methodology
•
From methodological point of view, we use the methodology of sediment
survey established recently by Citterio & Piégay, 2008.
• Two steps are considered:
• The measurement of the sedimentation rates based on the ratio between the mean
sediment thickness and the date of the revitalisation;
• The statistical analysis of the relationships and inter-lake analysis (the characterisation
of connection frequency and to define the life expectancy of former channels).
•
For a UAV and aerial imaging we use methodology established by Miřijovský,
2013
•
Additional measuring
• Terrestrial photogrammetry
• Geodetic measuring of the transverse profiles
•
Collaboration with Komenského University in Bratislava and Masaryk
University in Brno
6
8. Detailed aerial mapping and flood impact monitoring in the V4 region
Technical equipment
Hexacopter XL, Cessna 172
• Copter with six propellers
• Advantages of UAV systems
• Operability
• Relatively cheap technology
• Spatial resolution from 1 cm
• Cessna 172
• Used to spatially
extensive area
imaging.
8
9. Detailed aerial mapping and flood impact monitoring in the V4 region
Technical equipment
Camera, hydrologic and geodetic devices
• DSLR camera with a prime lens.
• Rain gauge
• Levelogger, Barologger
• Total station Topcon
• Levelling instrument
9
10. Detailed aerial mapping and flood impact monitoring in the V4 region
Field work
• Installation of the levelogger
• Geodetic measuring – two sets
of measuring (cooperation with
students of Palacký University).
• Aerial imaging
• Three flights above the Kenický
meander
• Three flights above the meander in
Osypané břehy locality.
10
11. Detailed aerial mapping and flood impact monitoring in the V4 region
RAW data from an aerial imaging
• Overlay 70 % – 90 %
11
13. Detailed aerial mapping and flood impact monitoring in the V4 region
Measuring on the image
• UAV photogrammetry - the application of known procedures for
photogrammetric data obtained from the air models.
13
14. Detailed aerial mapping and flood impact monitoring in the V4 region
Methods
• Interior and Exterior orientation
• Surveying methods
• Very accurate measuring of the Ground Control
Points (GCPs), often in a difficult terrain
morphology.
14
15. Detailed aerial mapping and flood impact monitoring in the V4 region
Photogrammetric processing
Structure from Motion –
Agisoft Photoscan
proffesional
Stereophotogrammetry –
ERDAS LPS
15
16. Detailed aerial mapping and flood impact monitoring in the V4 region
Results - Kenický meander
16
17. Detailed aerial mapping and flood impact monitoring in the V4 region
Results - Kenický meander
17
18. Detailed aerial mapping and flood impact monitoring in the V4 region
Results - Kenický meander
Max. difference:
2m
18
19. Detailed aerial mapping and flood impact monitoring in the V4 region
Results - Kenický meander
19
20. Detailed aerial mapping and flood impact monitoring in the V4 region
Precipitations, water level
• Speed of the lateral erosion and sediments accumulation.
Rain
high water level
• Maximal erosion if there is riverbeds-forming flow
20
21. Detailed aerial mapping and flood impact monitoring in the V4 region
Precipitations, water level
21
22. Detailed aerial mapping and flood impact monitoring in the V4 region
River bank with lateral
erosion
River bank between 2003 and 2012
22
23. Detailed aerial mapping and flood impact monitoring in the V4 region
River bank with lateral erosion
The volume of material above
the reference plane in 2011
(m3)
426,06
The volume of material above
the reference plane in 2012
(m3)
272,26
Difference (m3)
153,8
23
24. Detailed aerial mapping and flood impact monitoring in the V4 region
Future work
•
Continued in terrestrial monitoring
• Hydrological data (precipitations, height of a water level, water flow).
• Aerial data (UAV and aerial imaging).
• Terestrial measuring (transverse profiles)
argile
100
90
80
silt
sable
Courbe granulométrique
sur la fraction
0.040 µm - 2000 µm
70
%
60
50
40
30
•
•
20
Obtaining of a new data
• Data for granulometry
Modeling
• prediction of sedimentation
a function of overflowing
discharge upstream and
downstream
10
0
0,01
0,10
1,00
10,00
diamètre en microns
100,00
1000,00
10000,00
CERISIER N°1 - 24/11/05 - Monika MICHALKOVA
120
Mean water level (cm)
35
Tenden cy 12 cm/year
Tenden cy 7 cm/year
100
Annual sed. rate (cm/year)
30
Exponential mode l
y = 37,253e
25
80
-0,0013x
2
R = 0,9915
20
60
15
40
10
20
0
2005
24
5
0
2010
2015
2020
0
500
1000
1500