
Uploaded byRob Mooney
Stormwater BMP Poster
This document outlines a study to assess the effectiveness of a regional stormwater facility in Sarasota County, Florida, designed to treat stormwater runoff from over 55 square miles. It describes the methods for hydrologic and water quality monitoring over a 24-month period, including sampling during storm events and baseflow conditions. The data collected will inform future improvements in stormwater management practices and BMP designs to enhance water quality.
More Related Content


Stormwater BMP Poster
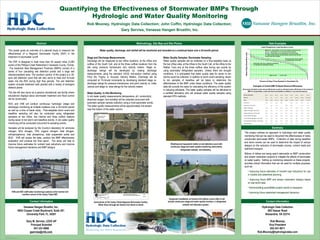
- 1. POSTER TEMPLATE BY: www.PosterPresentations.com Abstract Contactinformation Quantifying the Effectiveness of Stormwater BMPs Through Hydrologic and Water Quality Monitoring Rob Mooney, Hydrologic Data Collection; John Coffin, Hydrologic Data Collection; Gary Serviss, Vanasse Hangen Brustlin, Inc. This poster gives an overview of a planned study to measure the effectiveness of a Regional Stormwater Facility (RSF) in the treatment of stormwater runoff. The RSF is designed to treat more than 55 square miles (3,583 acres) of the Phillippi Creek Watershed in Sarasota County, Florida. The treatment Best Management Practices (BMPs) consist of a series of four cascading wet detention ponds and a large wet retention/wetland area. The southern portion of the project is a 30- acre wet detention pond that will also serve to treat and re-route water into the RSF during high flow periods. The wet detention system includes treatment cells planted with a variety of emergent wetland plants. The site will also serve as a passive recreational use facility where educational displays about stormwater treatment and flood control will be constructed. HDC and VHB will conduct continuous hydrologic (stage and discharge) monitoring at multiple locations over a 24-month period as well as a time of travel study. Flow-weighted storm event and baseflow sampling will also be conducted using refrigerated samplers at two inflow, two internal and three outflow stations during seven to ten storm and baseflow events. In situ water quality monitoring will be conducted concurrent to sampling events. Samples will be analyzed by the County’s laboratory for ammonia nitrogen, NOx nitrogen, TKN, organic nitrogen, total nitrogen, orthophosphorus, total phosphorus, total suspended solids and BOD. VHB will review the data, conduct the BMP effectiveness evaluation and produce the final report. The study will help to improve future estimates for nutrient load reductions and improve future management decisions and BMP designs. Methodology, Site Map and Site Photos Data Examples Summary Contact information Hydrologic Data Collection 805 Vassar Road Alexandria, VA 22314 Rob Mooney Vice President 202-341-9811 Rob.Mooney@hydrologicdata.com Vanasse Hangen Brustlin, Inc. 8043 Cooper Creek Boulevard, Suite 201 University Park, FL 34201 Gary M. Serviss, LEED AP Principal Scientist 941-351-8986 gserviss@vhb.com Water quality, discharge, and rainfall will be monitored and recorded on a continual basis over a 24-month period. Stage and Discharge Measurements Discharge will be measured at two inflow locations, at the inflow and outflow of the South Cell, and at the three outflow locations from the site using pressure transducers and velocity meters. Stage vs. discharge ratings will be developed by making discharge measurements using the standard USGS mid-section method using Price AA, Pygmy or Acoustic Velocity Meters. Discharge will be computed at 15-minute increments by developing standard stage vs. discharge ratings for pressure transducers, and point velocity vs. index velocity and stage vs. area ratings for the velocity meters. Water Quality: In Situ Monitoring In situ water quality measurements (temperature, pH, conductivity, dissolved oxygen, and turbidity) will be collected concurrent with automatic sampler sample collection using a multi-parameter sonde. The water quality measurements will be approximately mid-stream near the bottom of the water column. Water Quality Samples: Stormwater Sampling Water quality samples will be collected on a flow-weighted basis at the two inflow sites, at the inflow to the South Cell, at the inflow to the Walker Tract and at the three outflow sites during rain events by using automated refrigerated samplers. Unless there are drought conditions, it is anticipated that water quality data for seven to ten storms would be collected. In addition to storm event sampling, seven to ten samples of baseflow will be taken to determine the effectiveness of the BMP under these conditions. The water quality data will provide the basis for calculating the efficiency of the system in reducing pollutants. The water quality samples will be delivered to a certified laboratory who will analyze water quality samples using standard EPA methods. This project outlines an approach to hydrologic and water quality monitoring that can be used to document the effectiveness of newly constructed stormwater BMPs. Collection of data during baseflow and storm events can be used to determine the impact of various designs on the reduction of stormwater volume, nutrient loads and sediment transport. Billions of dollars are being spent nationwide on BMP construction and stream restoration projects to mitigate the effects of stormwater on water quality. Setting up monitoring networks on these projects provides critical information that can be used for multiple purposes, such as: • Improving future estimates of nutrient load reductions for use in models and watershed planning. • Improving future BMP and stream restoration designs based on real-world data. • Demonstrating quantifiable project results to taxpayers. • Improving future watershed management decisions. Examples of Overall BMP Pollutant Removal Efficiencies (Final report will detail overall removal efficiencies as well as individual section efficiencies of the monitored BMP for all parameters, under both storm and baseflow conditions, in dry and wet seasons). Aerial photo of the Celery Fields Regional Stormwater Facility. Water flows through the facility from North to South. VHB and HDC staff select monitoring locations at the Central Cell overflow culvert of the Celery Fields RSF. Weatherproof equipment shelter at wet detention pond with continuous stage and water quality monitoring instruments, refrigerated sampler, and telemetry. Equipment installation at Central Cell outflow culvert (Site 4) will include continuous stage and water quality monitors, a refrigerated sampler and telemetry system. Total Phosphorus Load Duration Curve 0.0 0.1 1.0 10.0 100.0 1000.0 10000.0 0 10 20 30 40 50 60 70 80 90 100 Percent of Days Flow Equaled or Exceeded (%) MeanDailyStreamflow(cfs) Higher Loads Lower Loads Discharge of 36.4 cfs is equalled or exceeded 60% of the time Black Line - flow duration curve for the station's period of record Red line - load duration curve for the parameter standard Blue line - load duration curve allowing for a 10% safe margin ▲ - Water quality samples as loads plotted using the flow duration at which they were sampled. Points above the curve represent exceedance of standards and allowable loadings