Download as PDF, PPTX
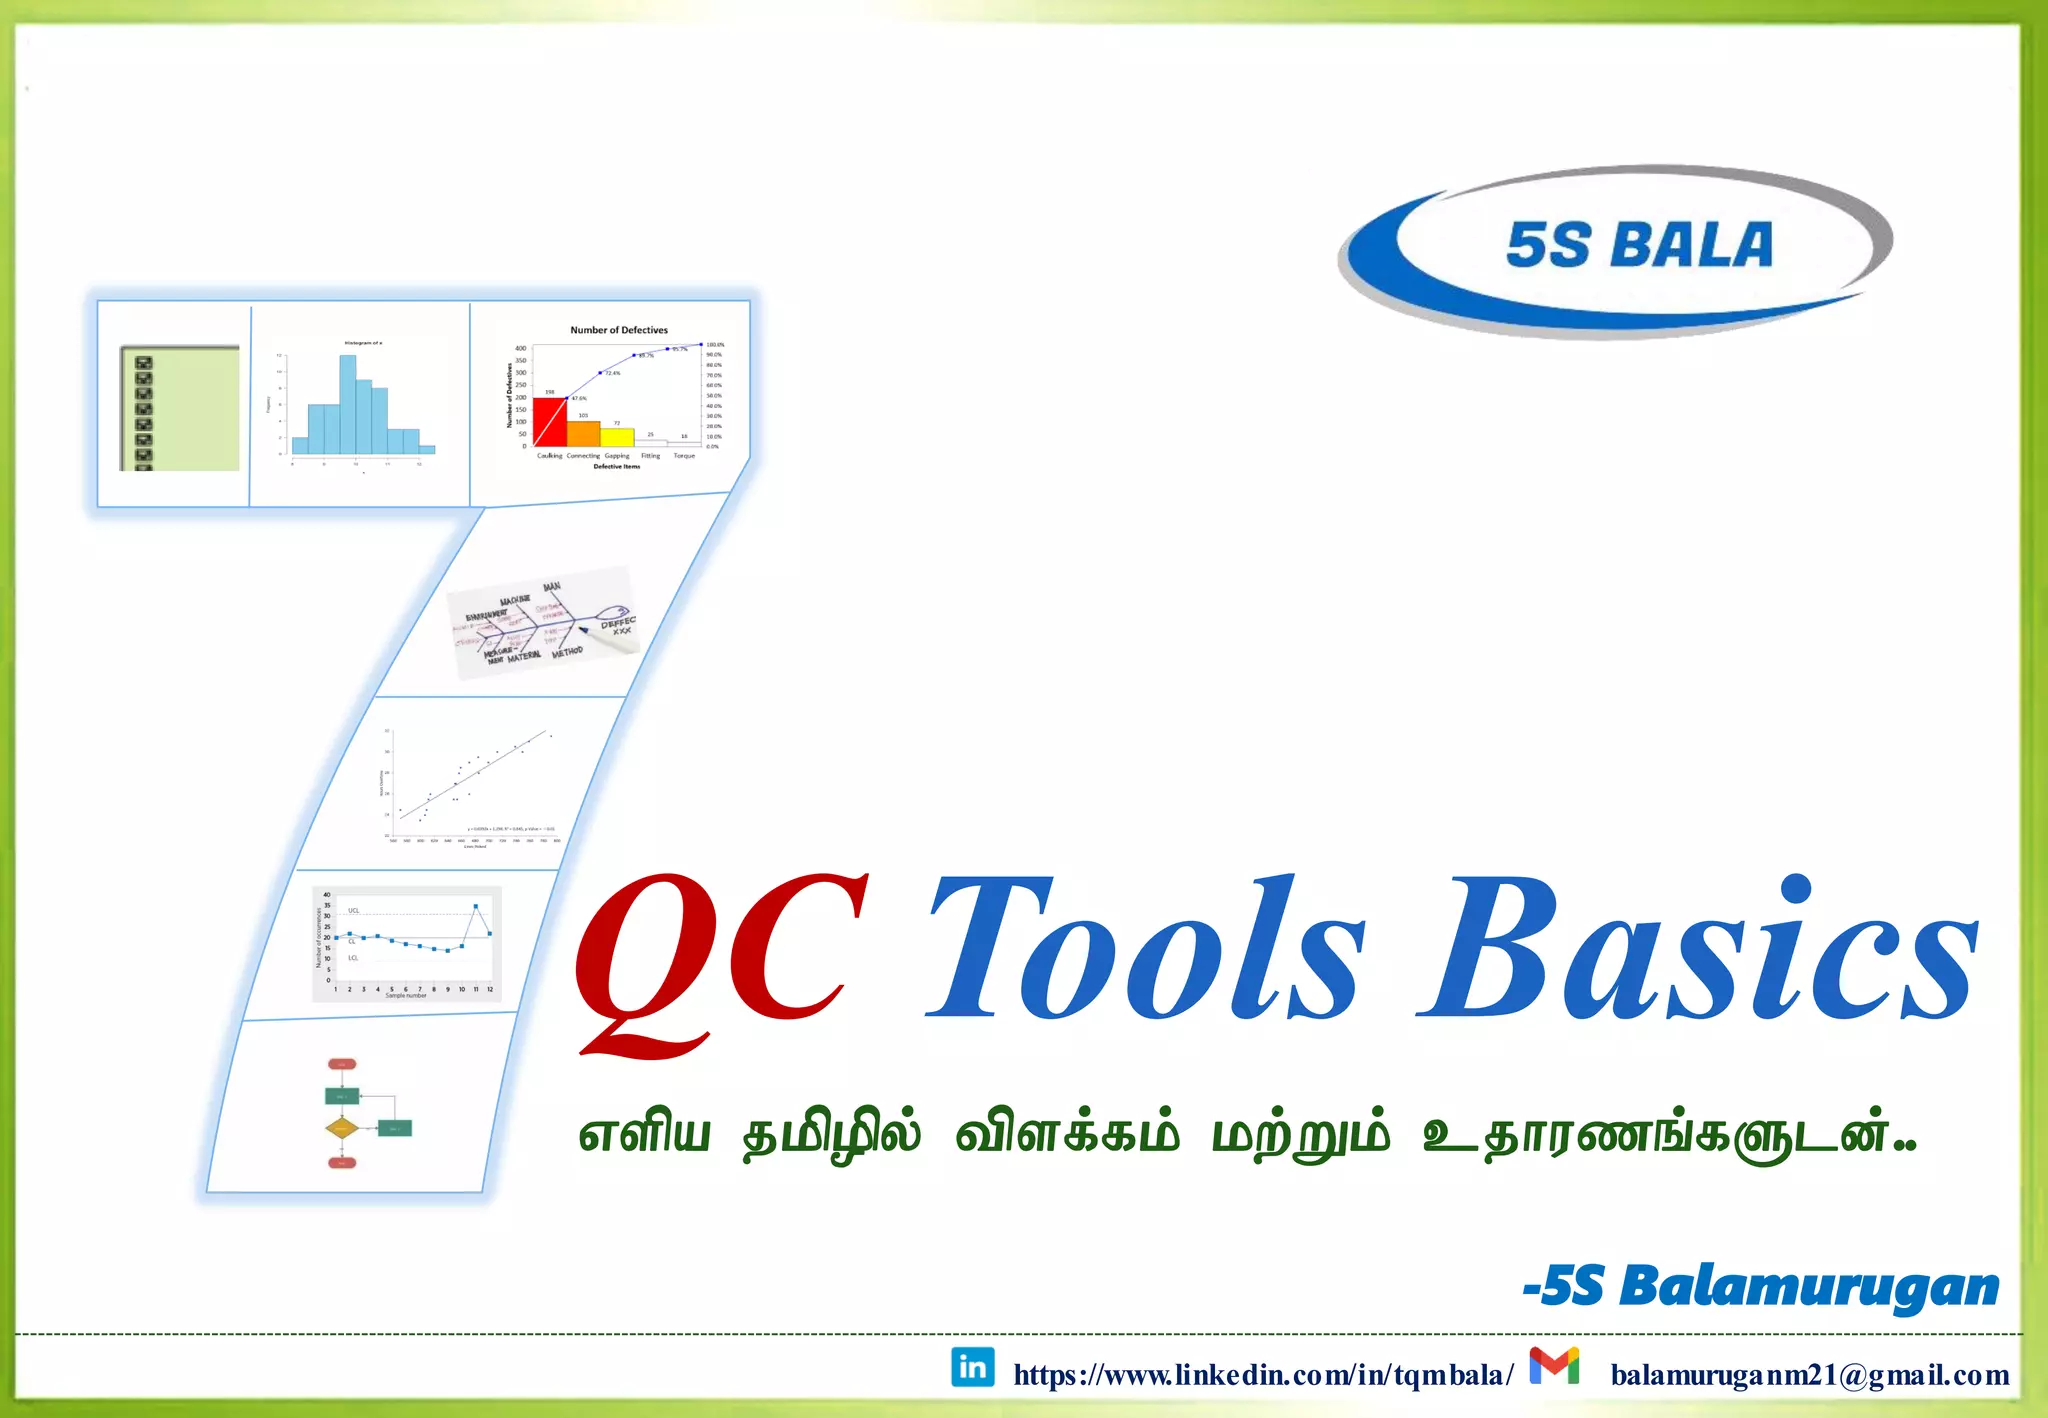
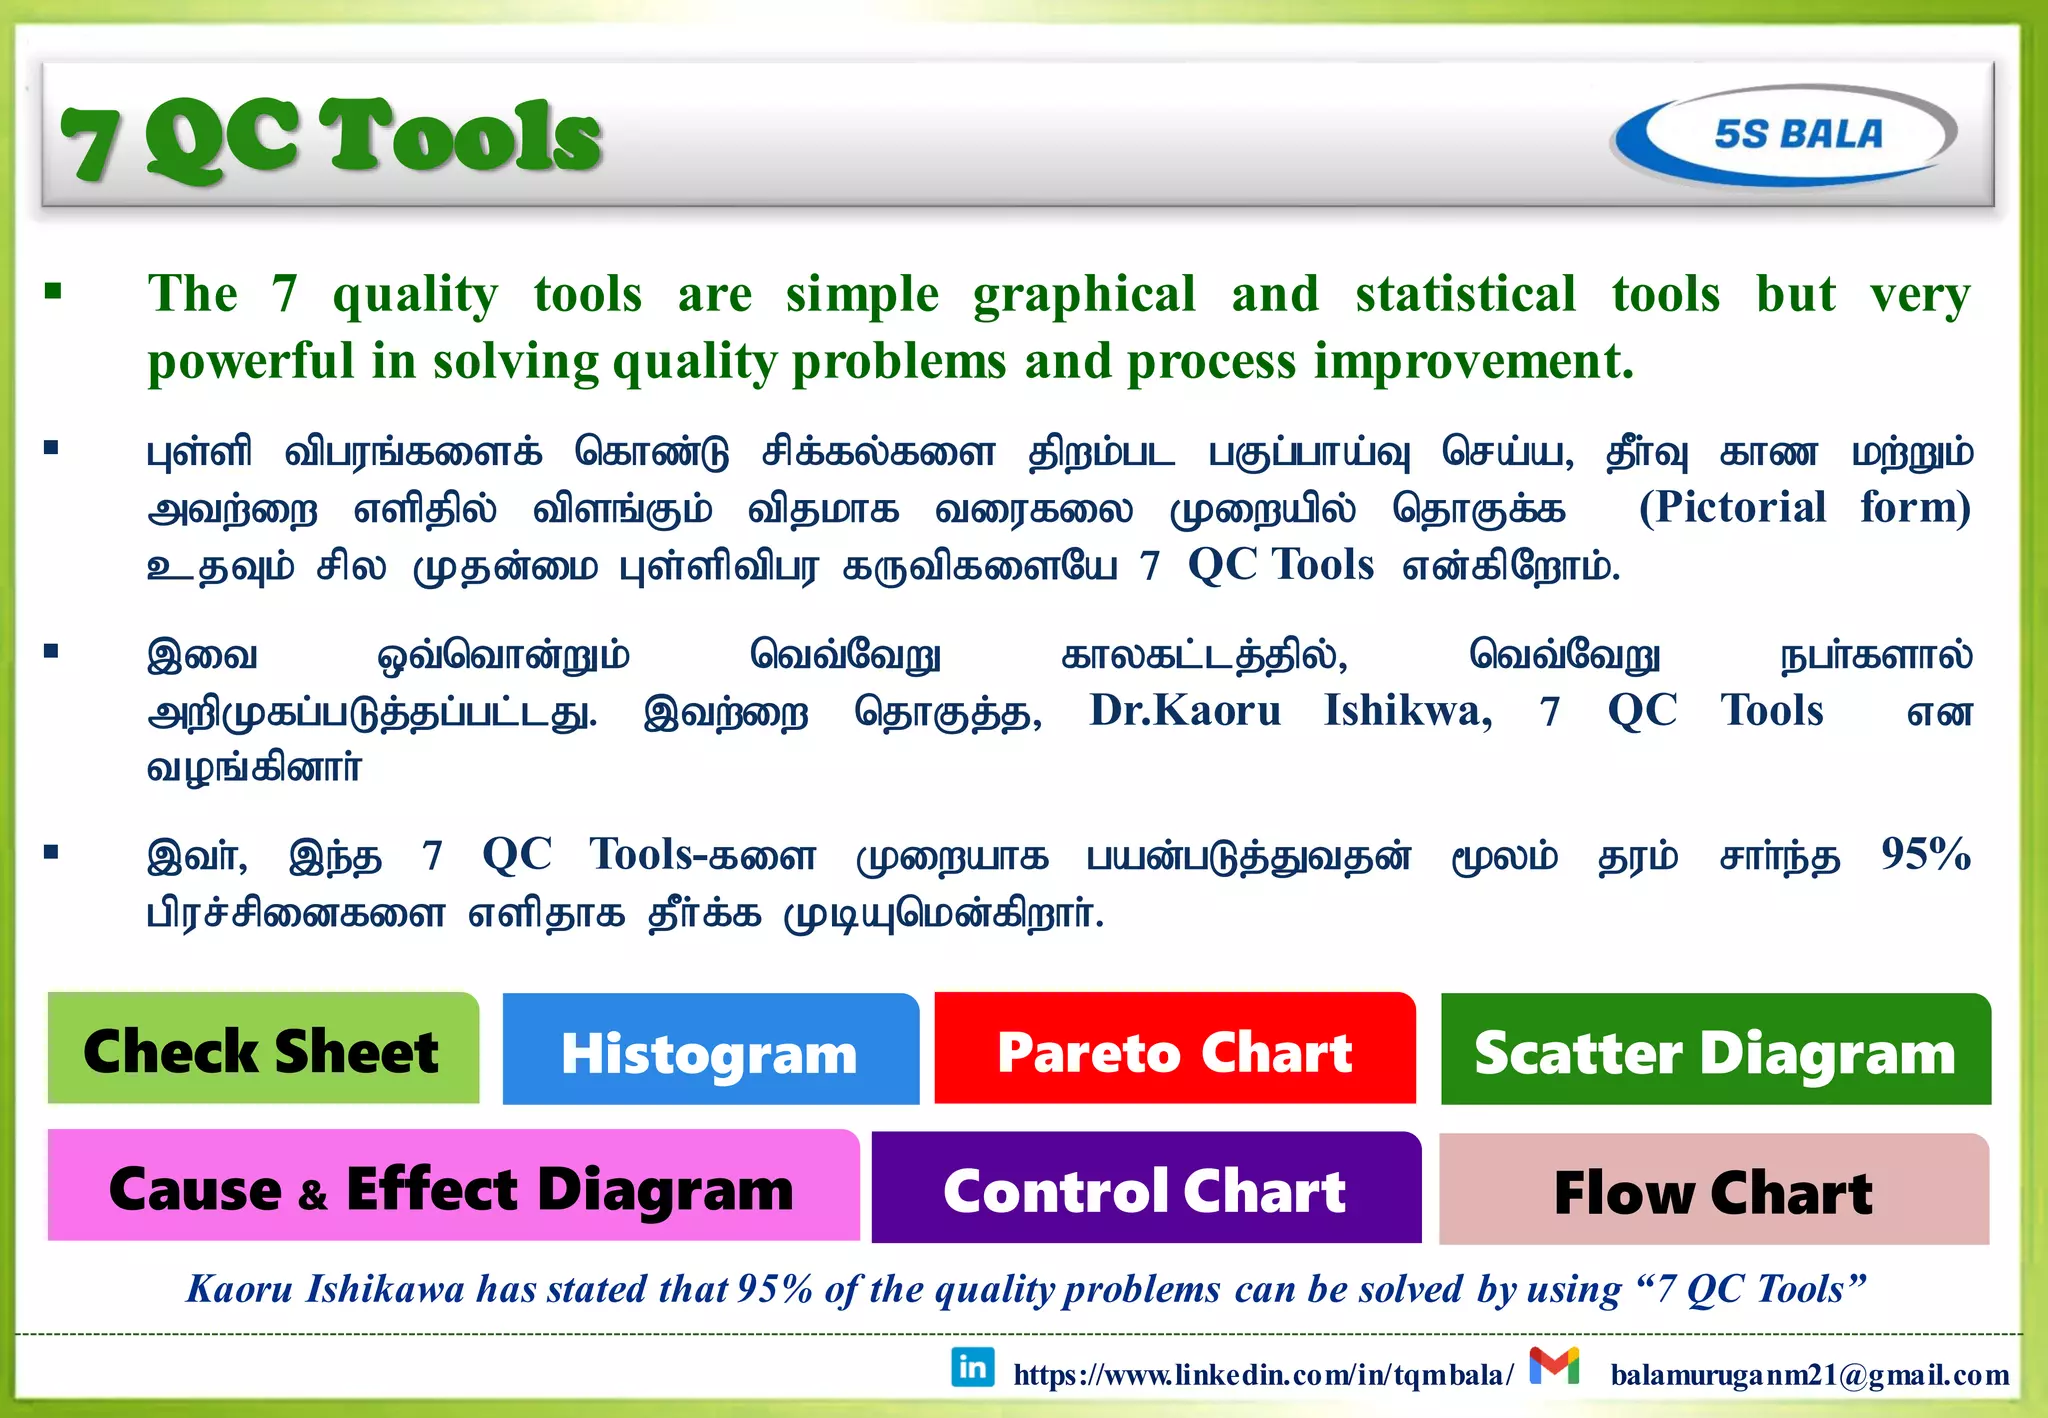
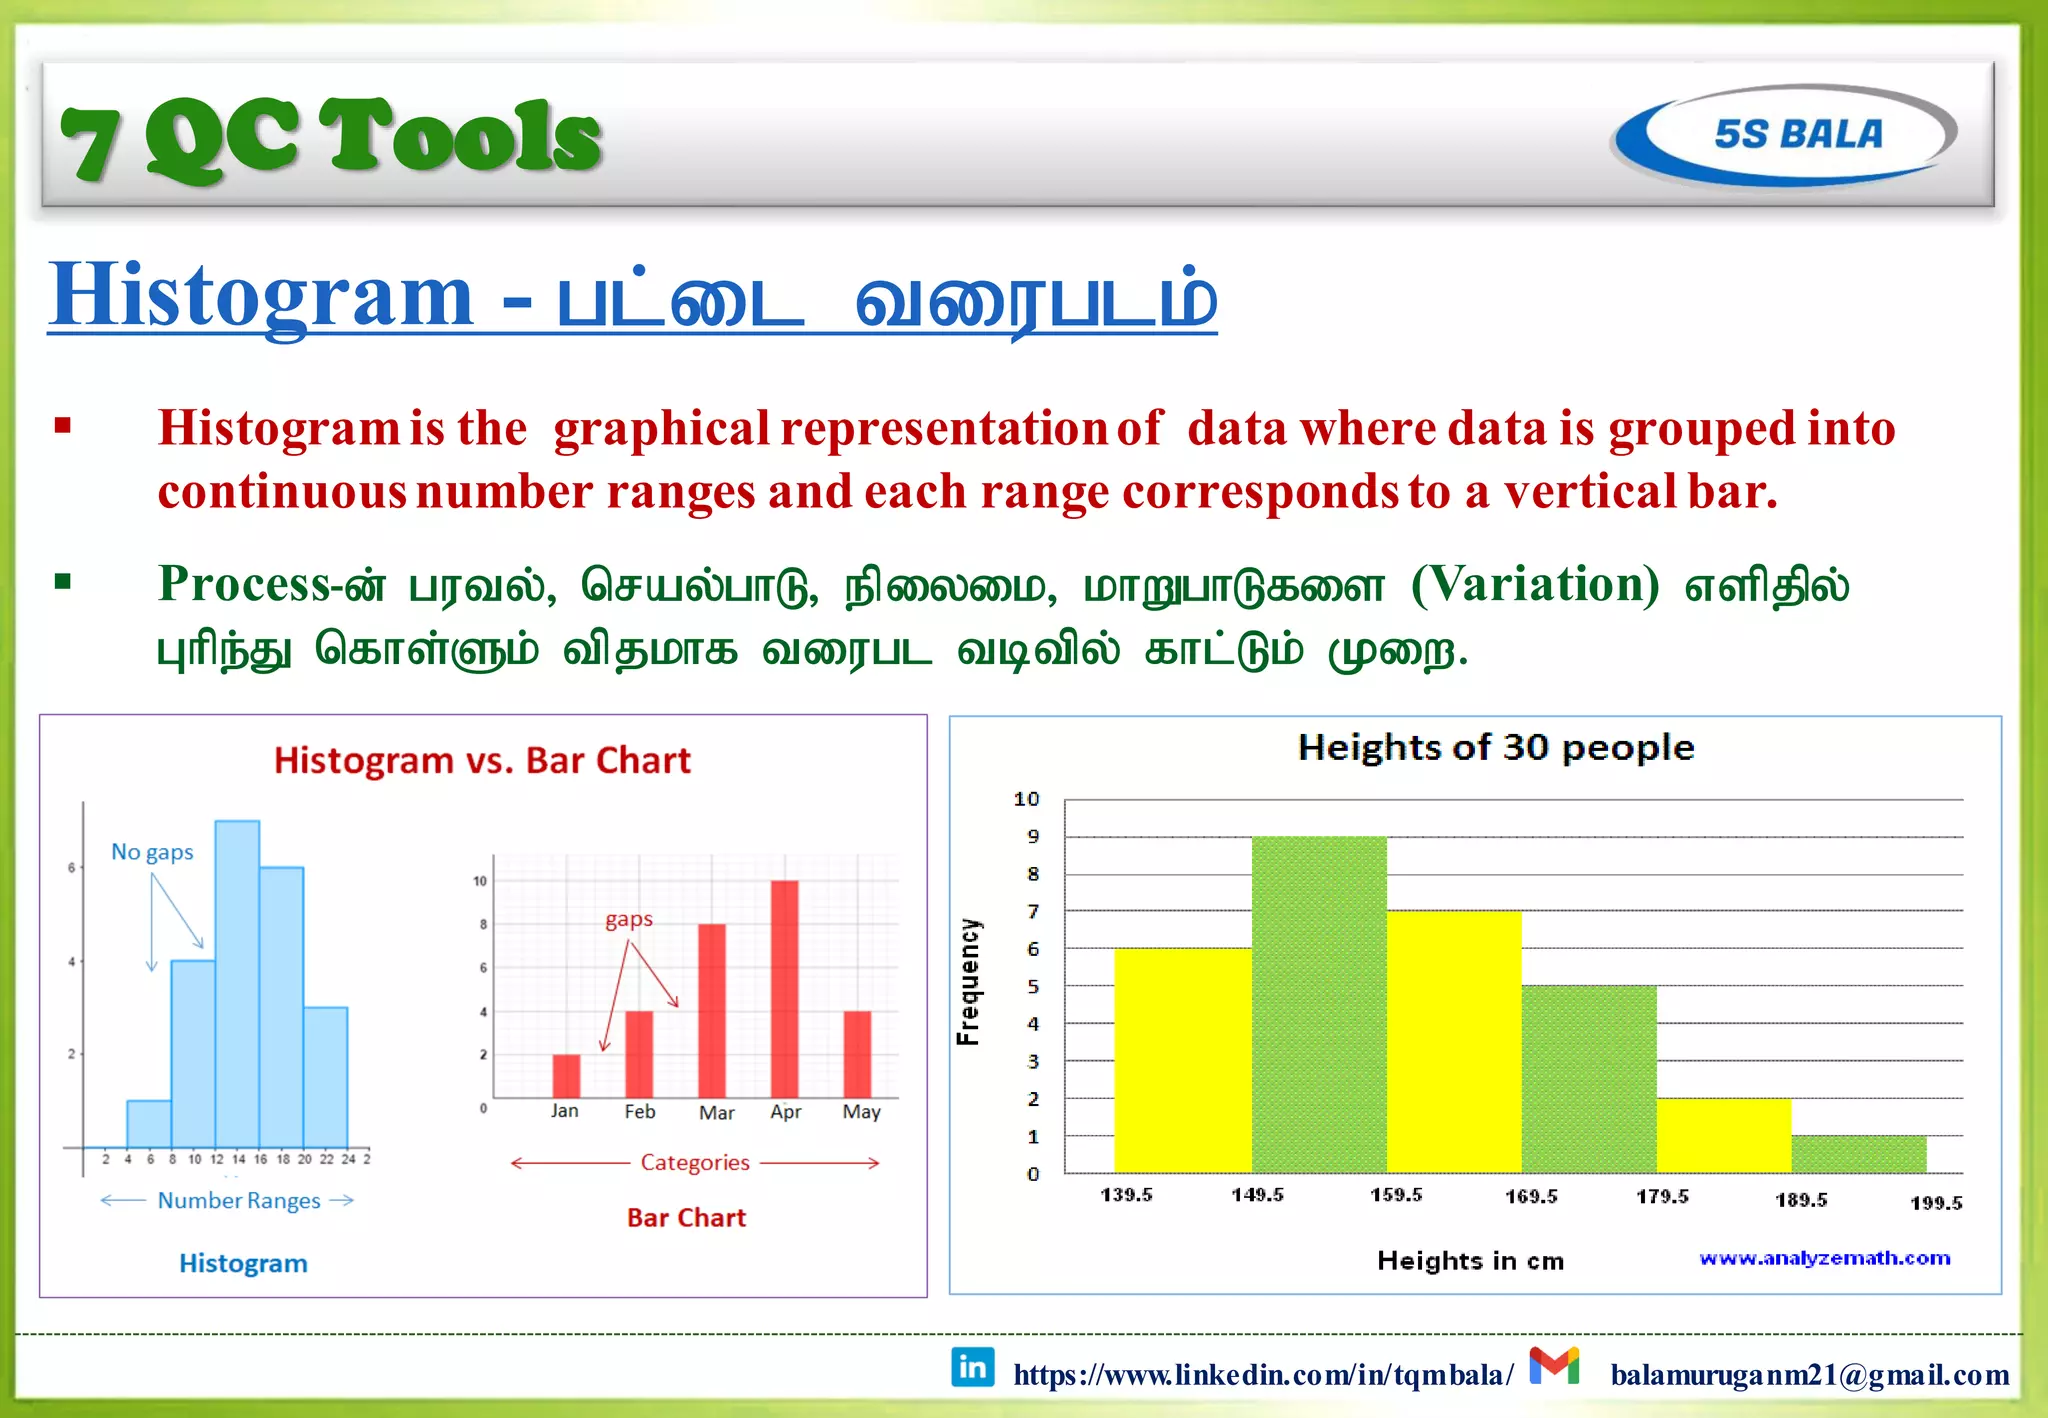
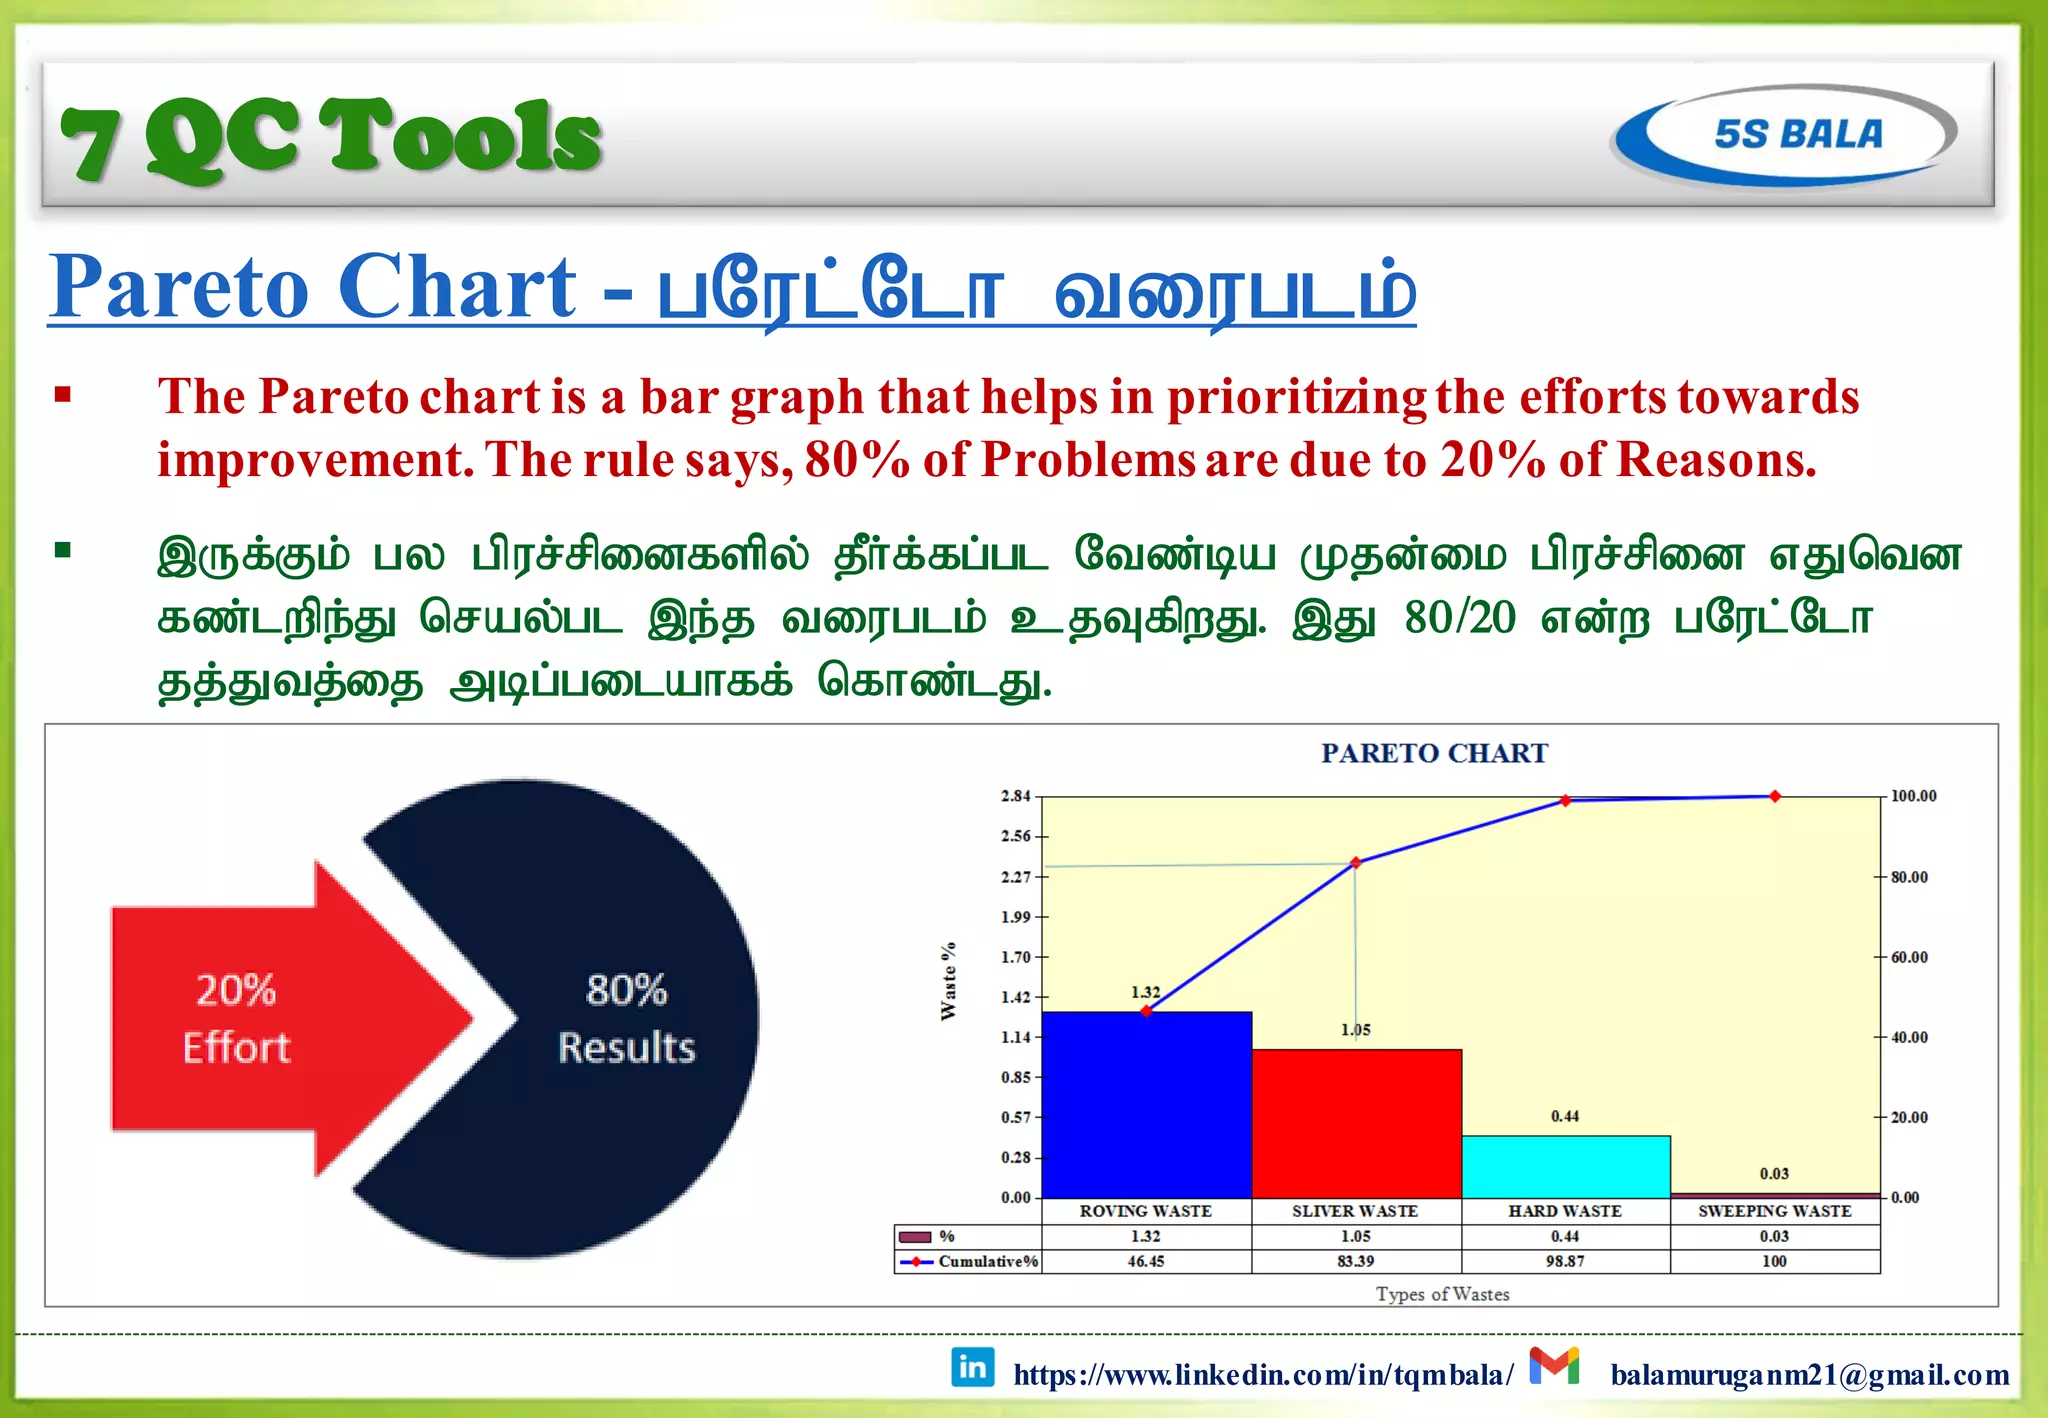
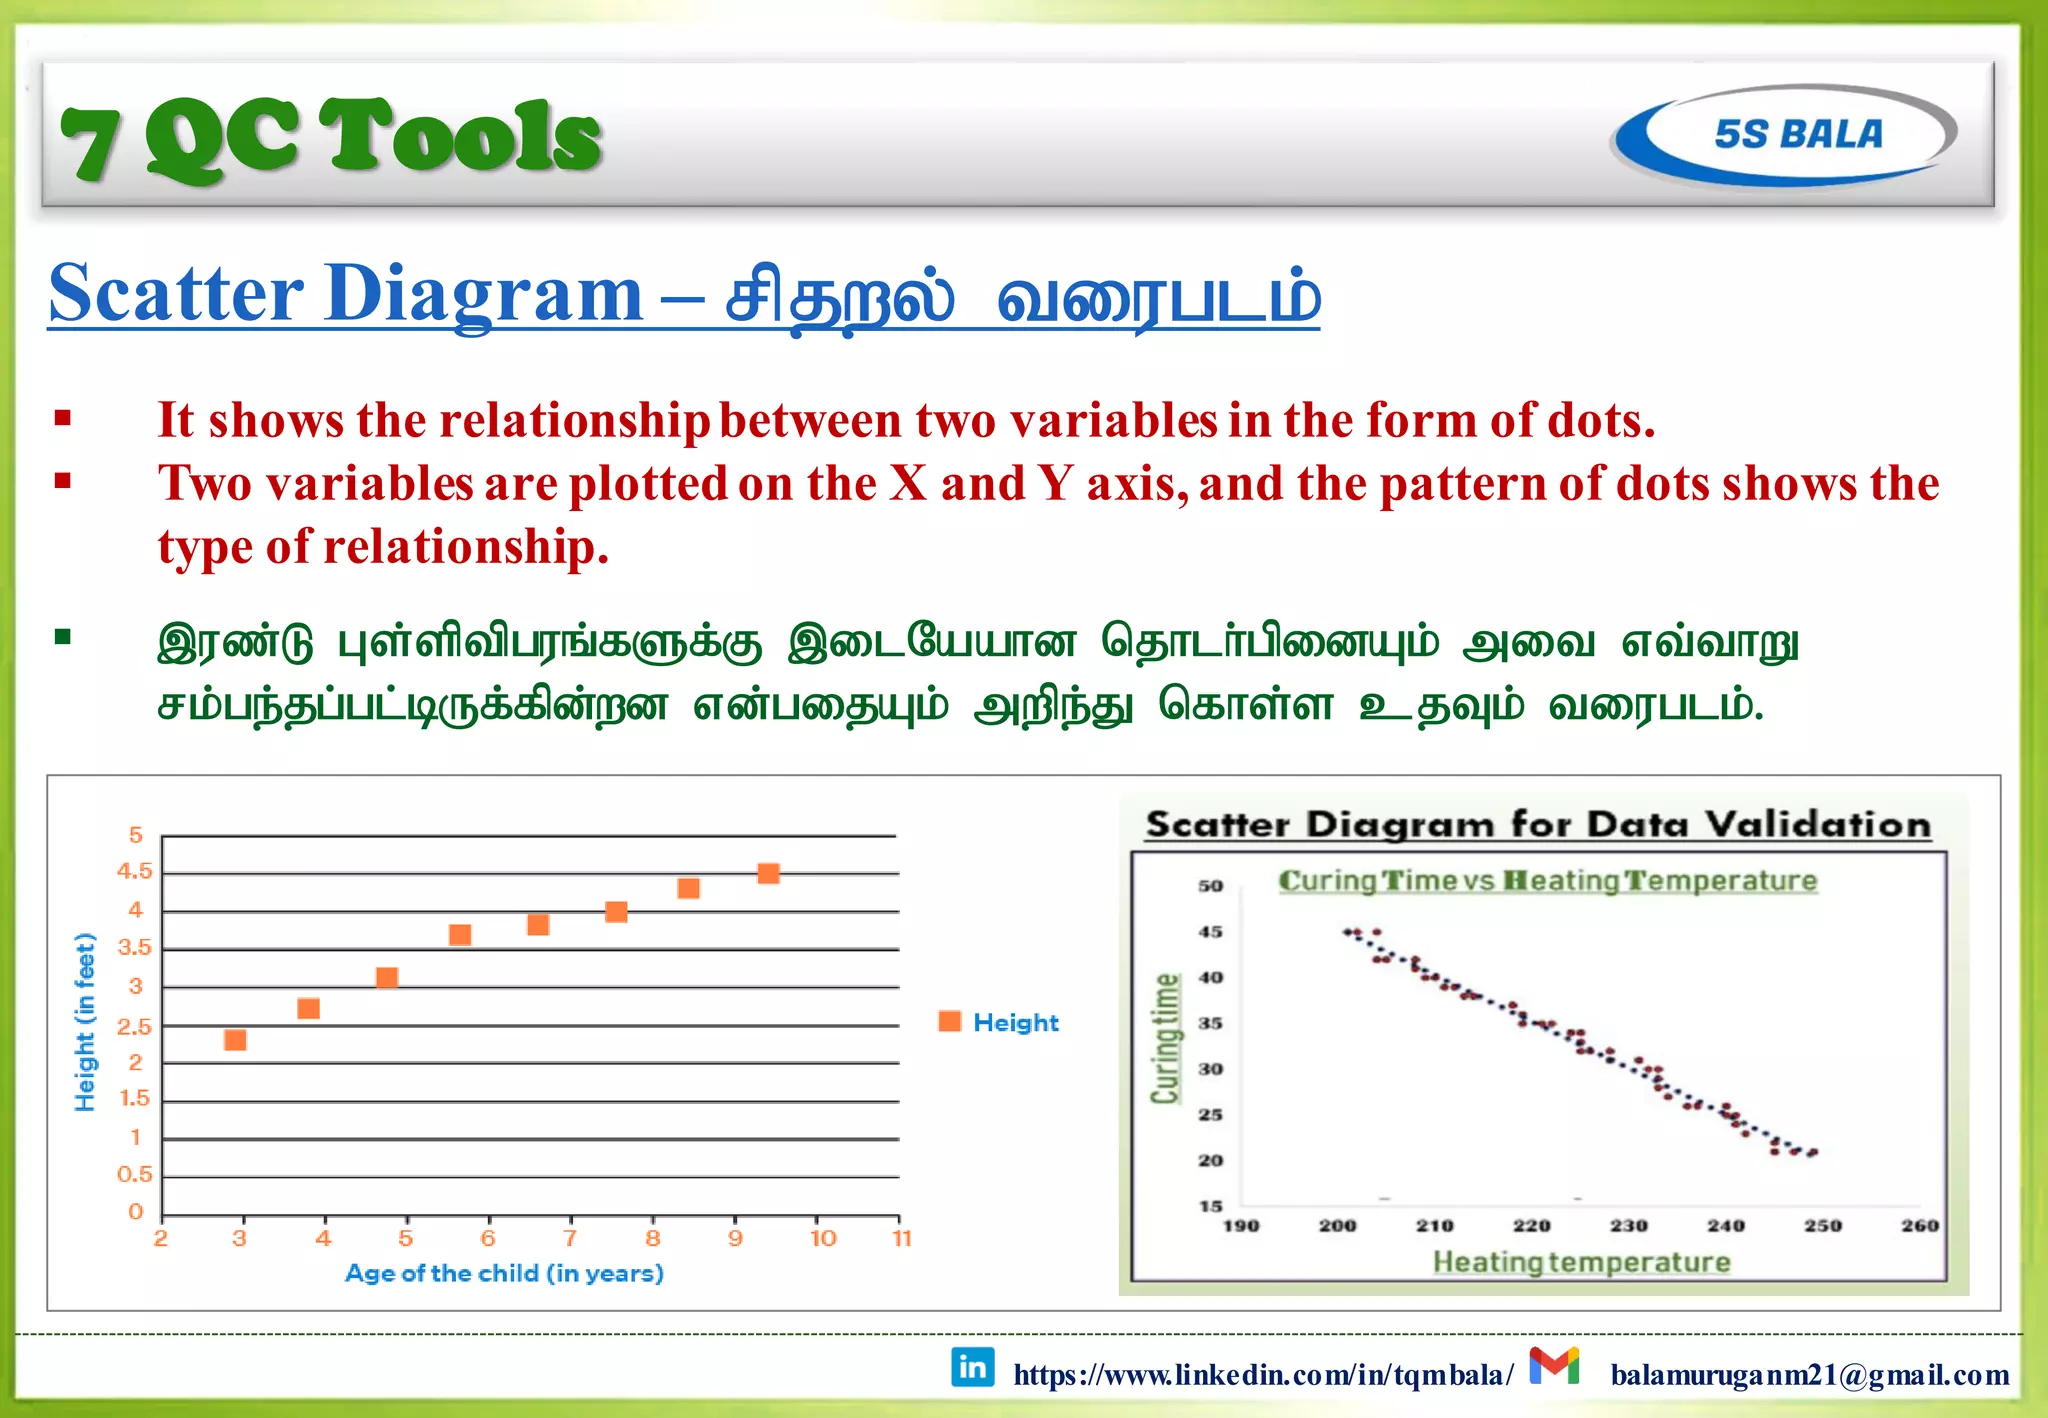
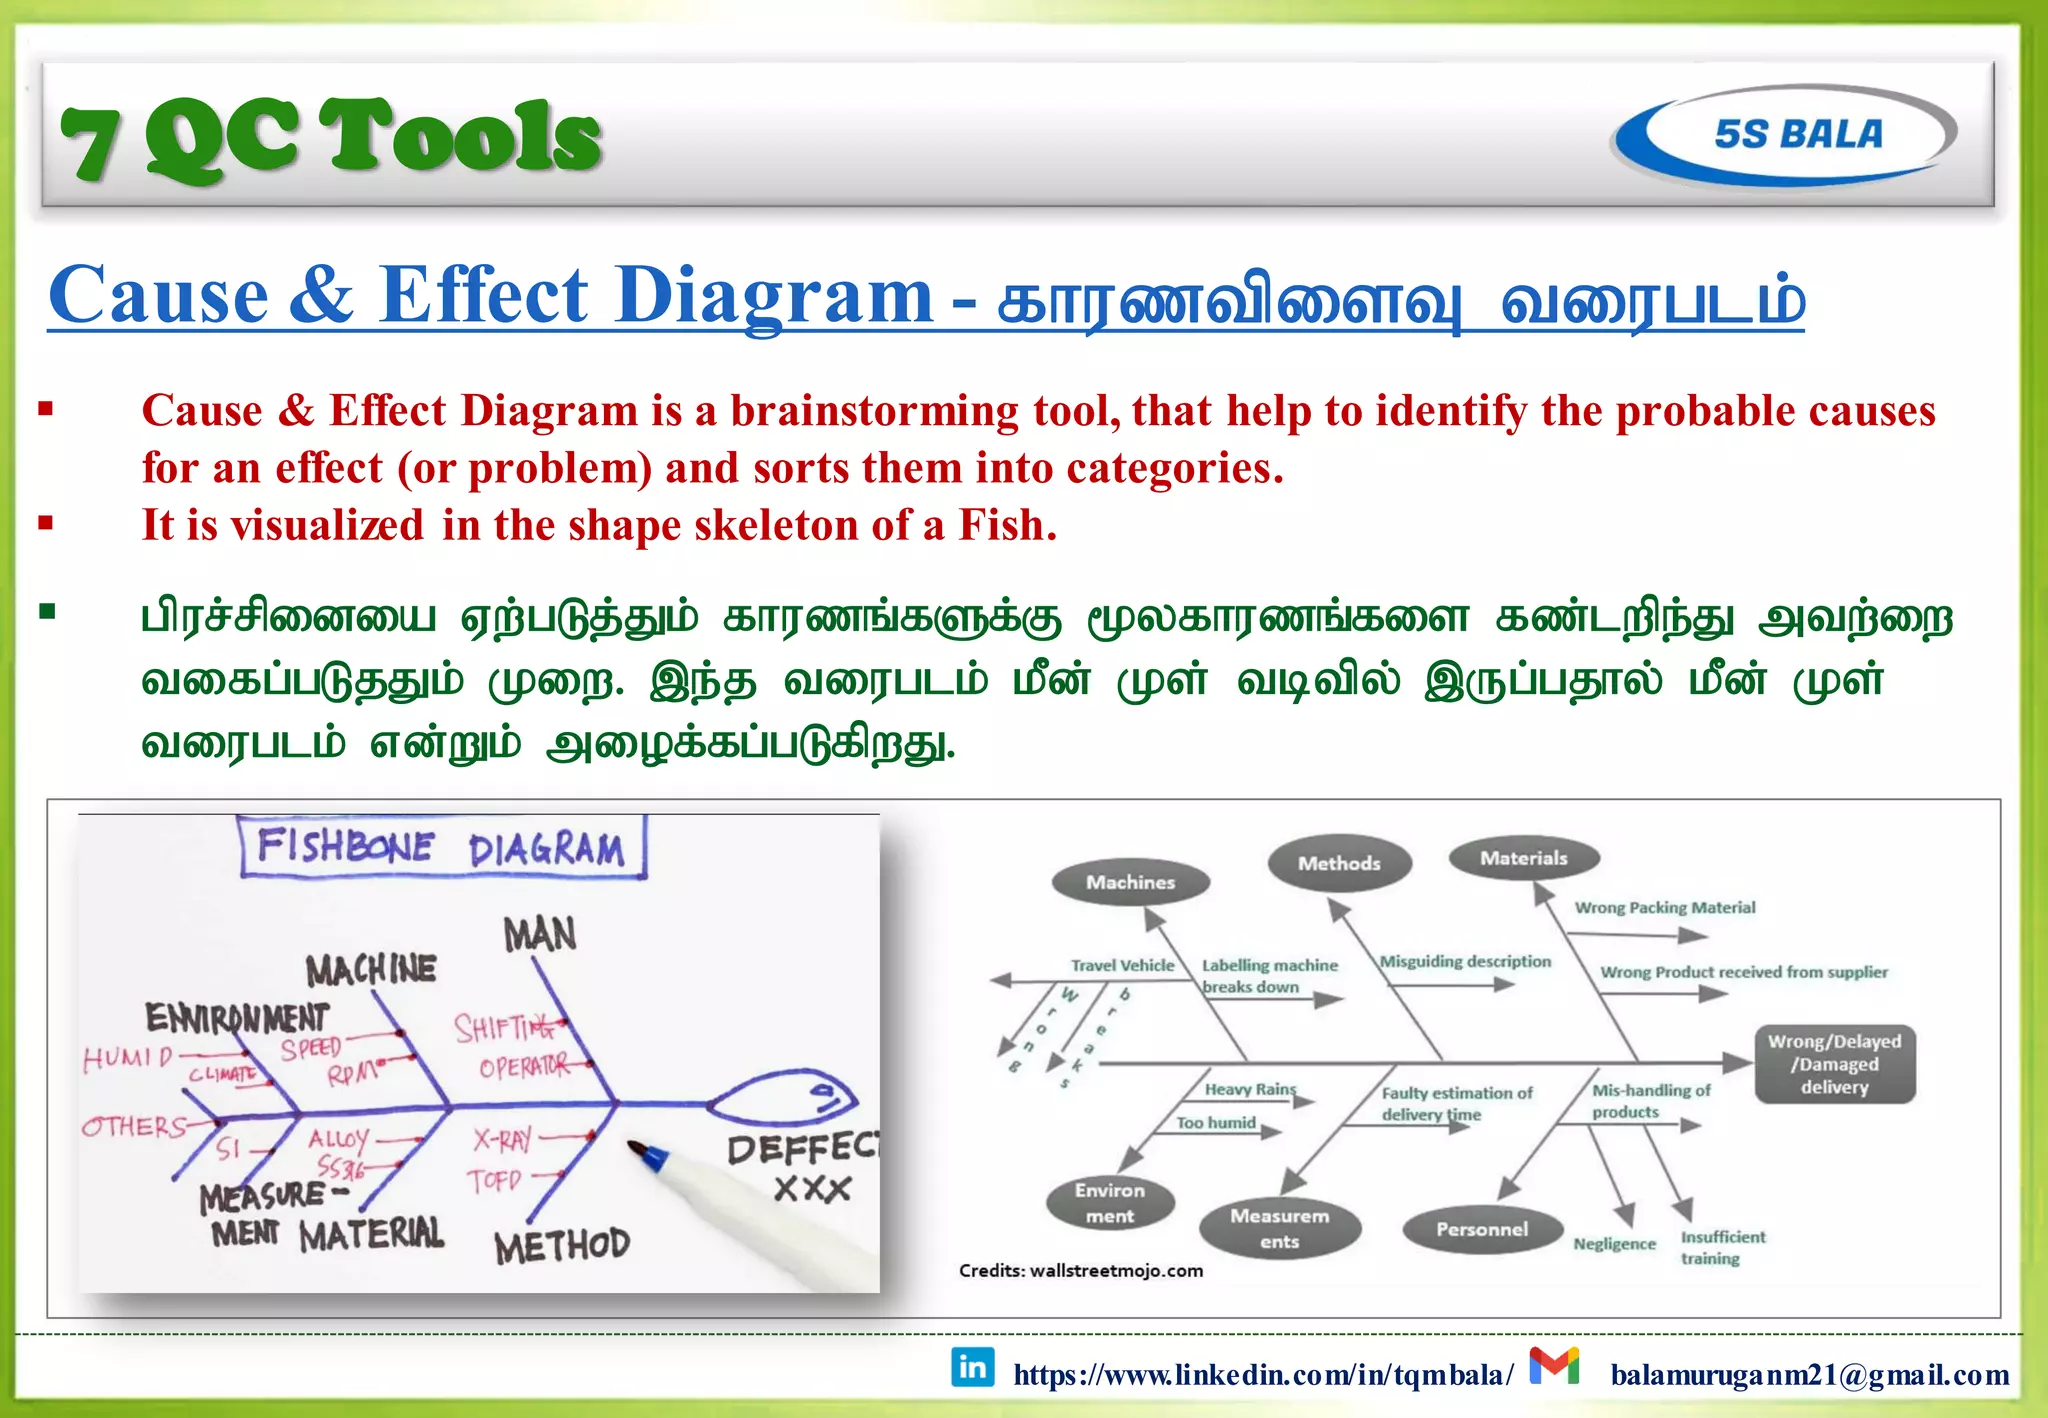
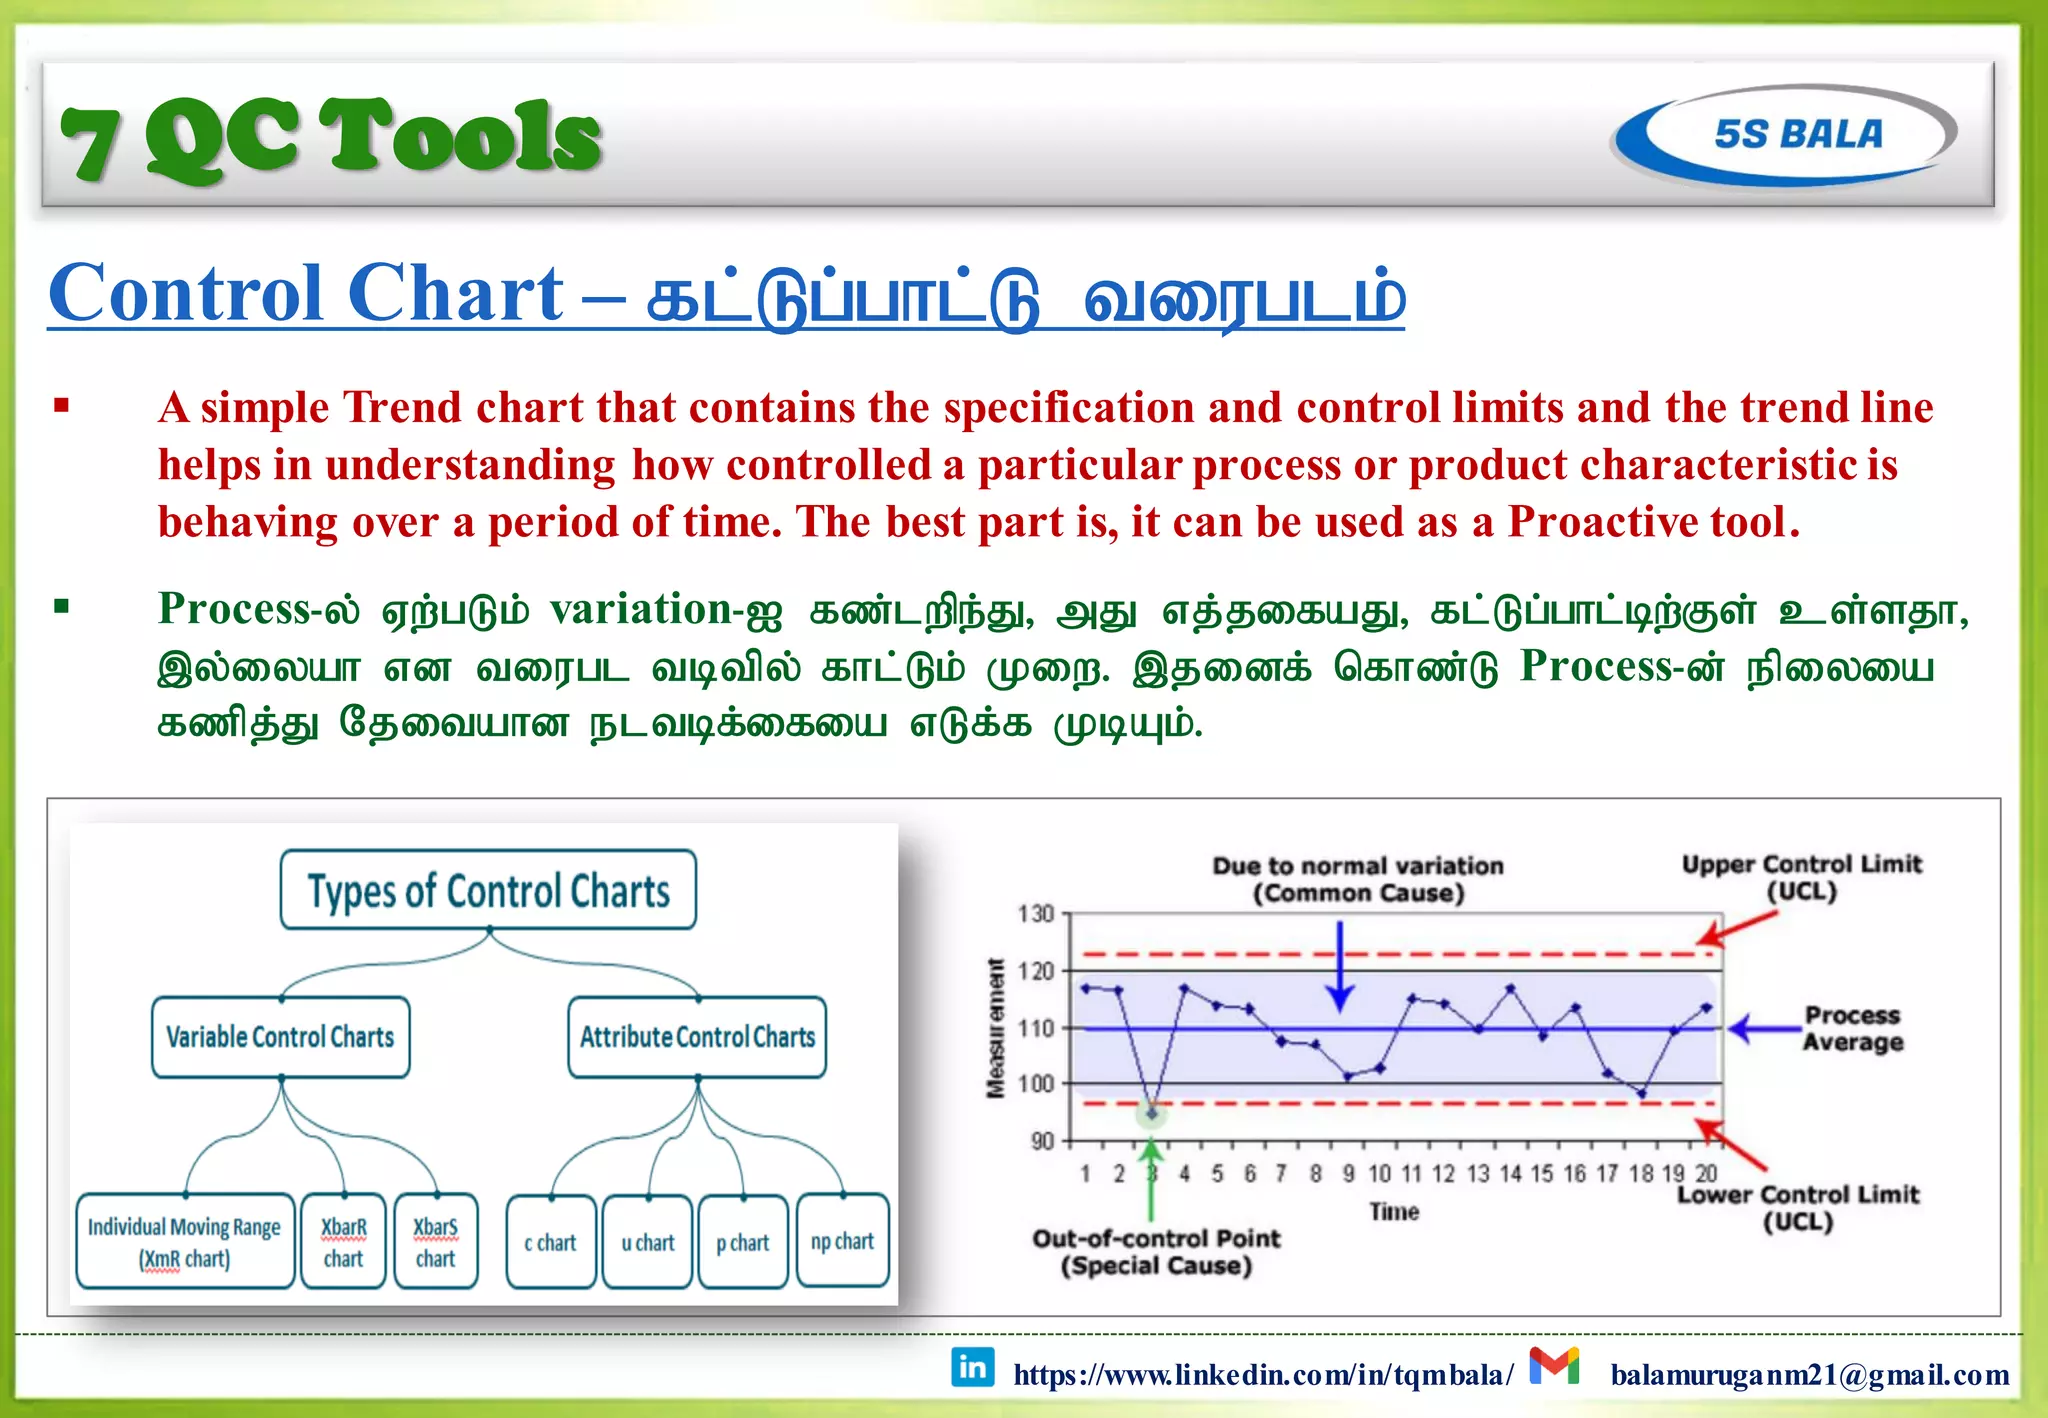
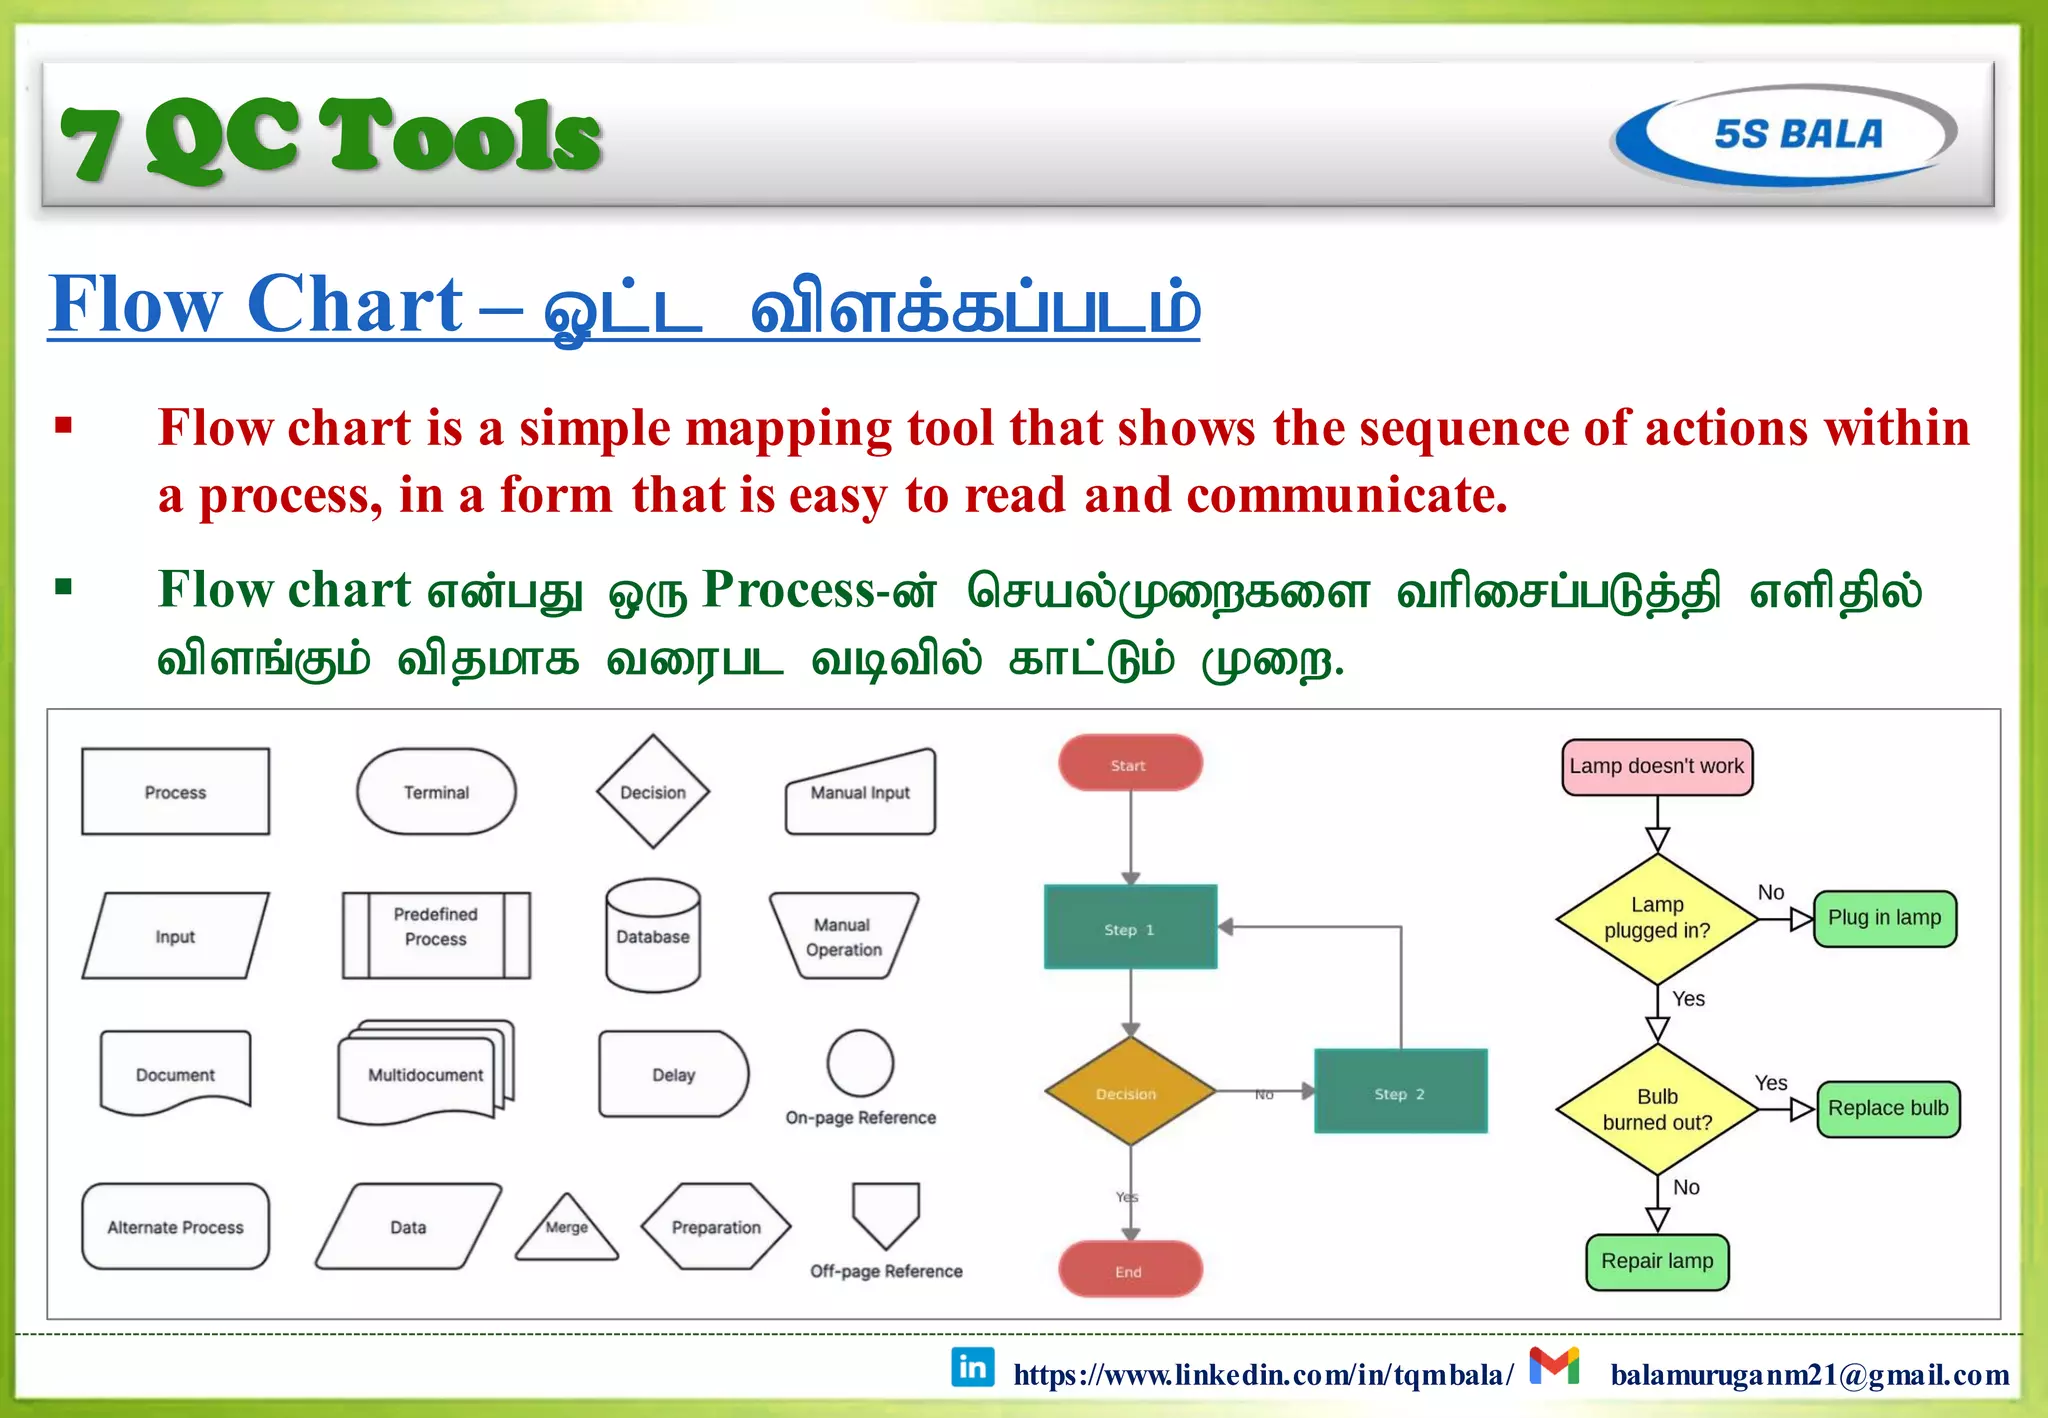


The document outlines the 7 Quality Control (QC) tools, which are essential for solving quality problems and improving processes. These tools, as stated by Dr. Kaoru Ishikawa, can solve 95% of quality issues and include check sheets, histograms, pareto charts, cause and effect diagrams, scatter diagrams, flow charts, and control charts. Each tool serves a specific function in data collection and analysis to enhance quality management.


