Downloaded 123 times

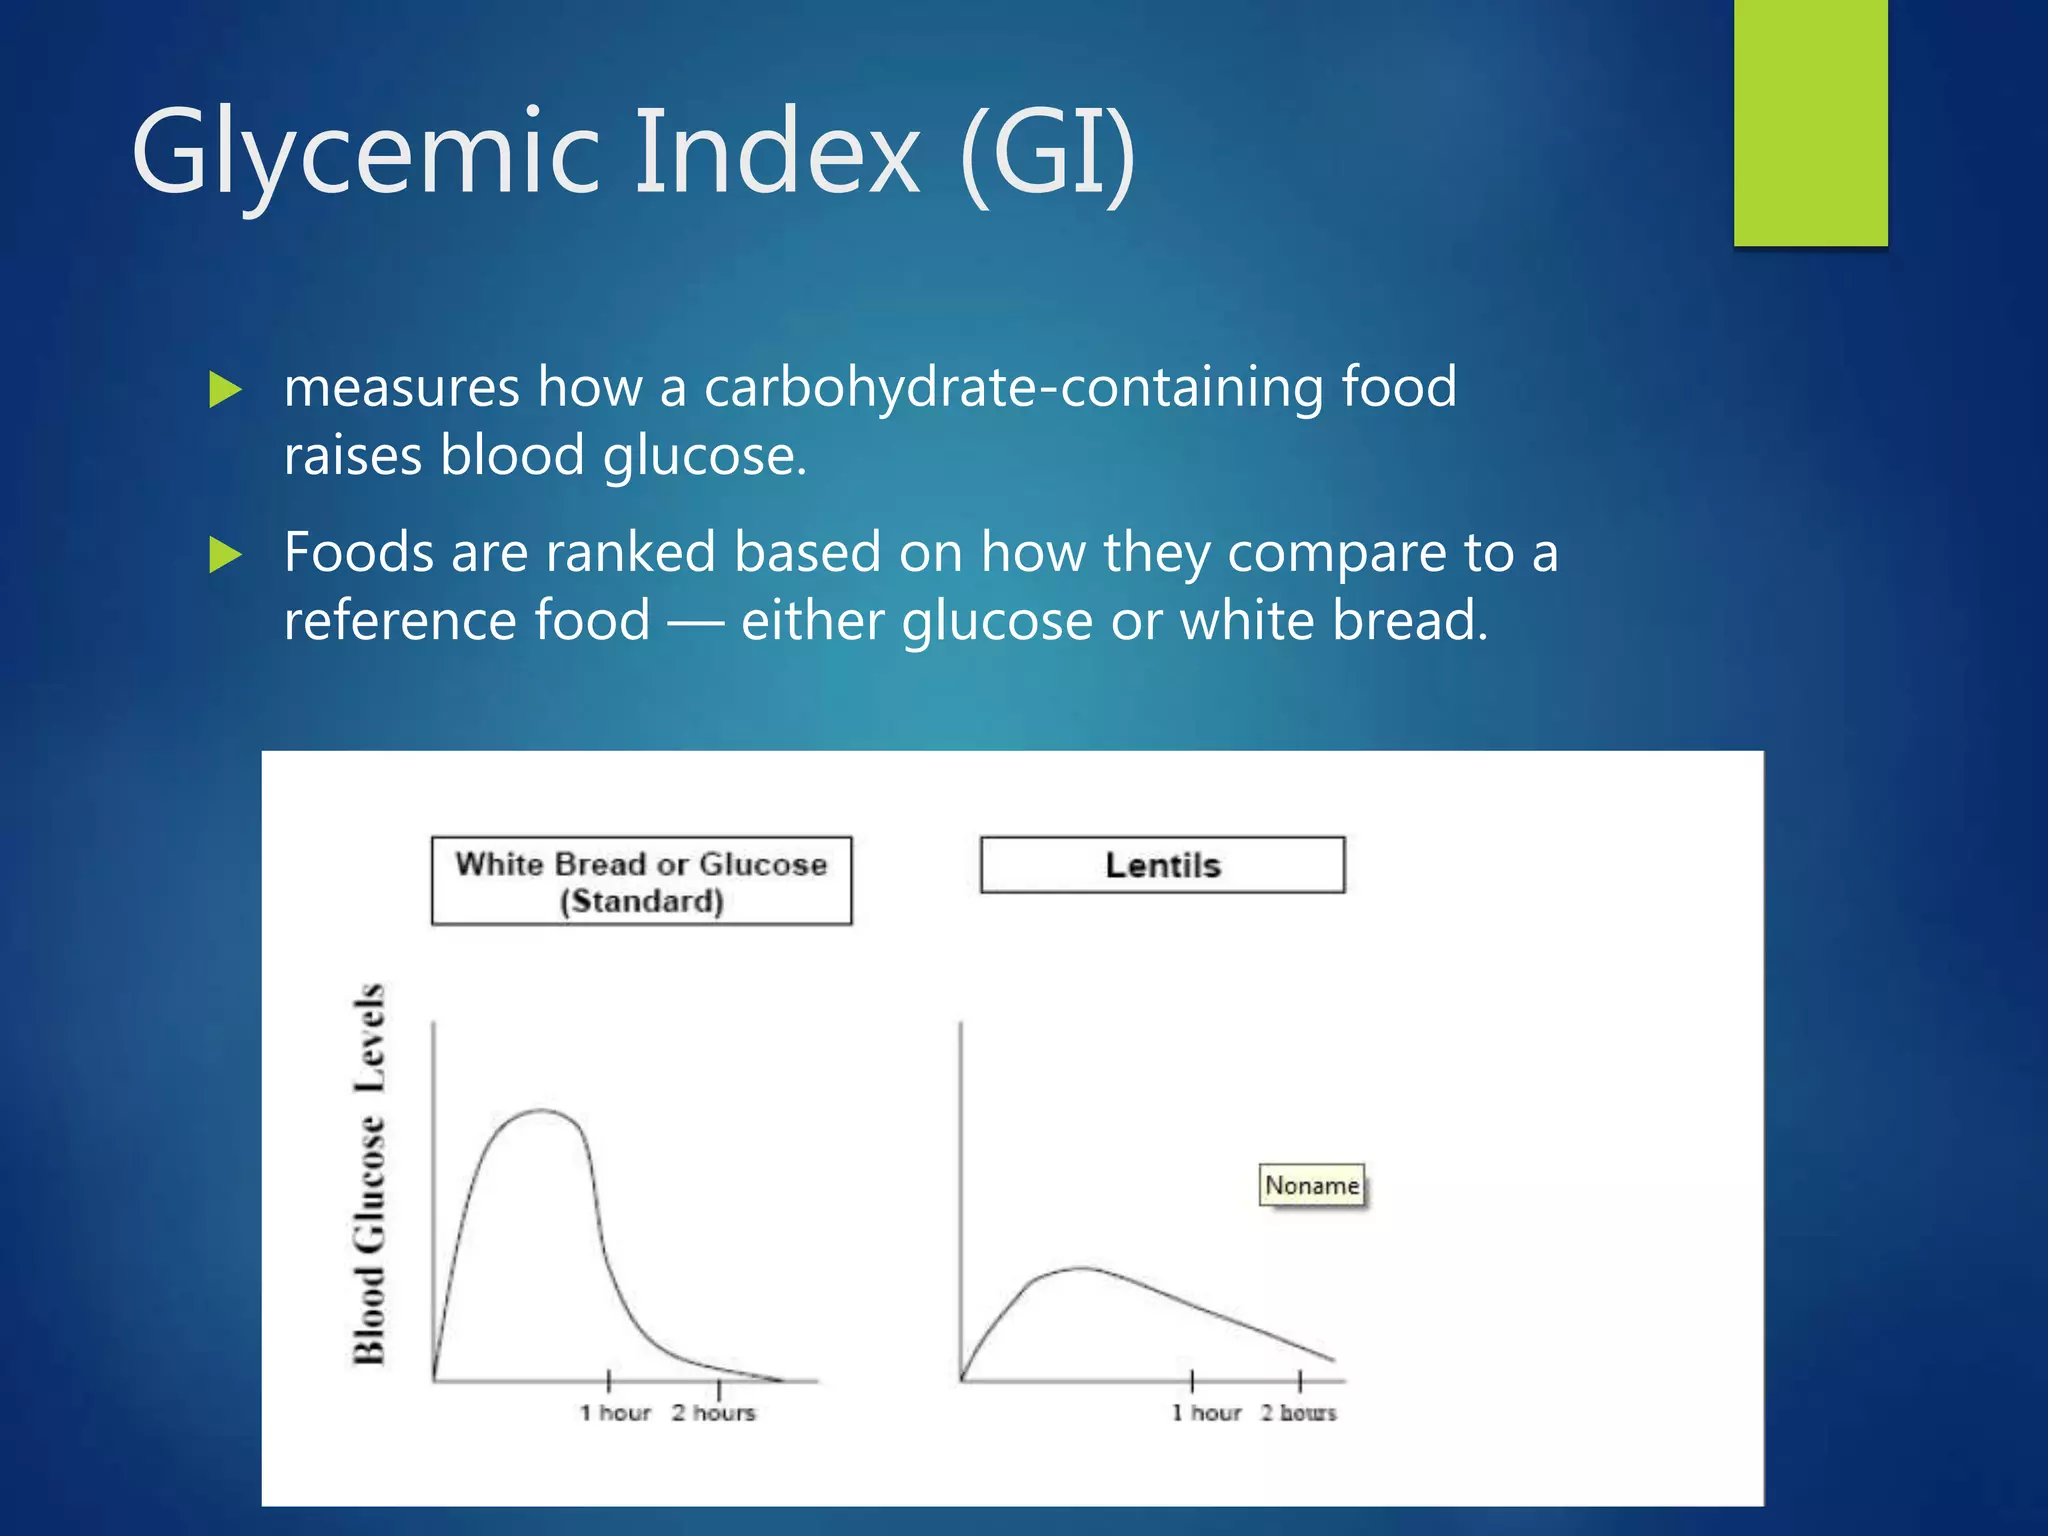


The document explains the glycemic index (GI) as a measure of how carbohydrate-containing foods affect blood glucose levels, categorizing foods into low, medium, and high GI ranges. It discusses various factors influencing GI ranking, including the type of starch, physical entrapment, fiber viscosity, and the impact of food processing and cooking. Additionally, it highlights the limitations of solely using GI for diabetes management, suggesting that glycemic load (GL) and carbohydrate counting may offer more effective strategies.


