SlideShare a Scribd company logo
Isaac Elementary School District No. 5
                     Arizona 2010 Mathematic Standards Glossary of Terms
                                          2012-2013


          Glossary  
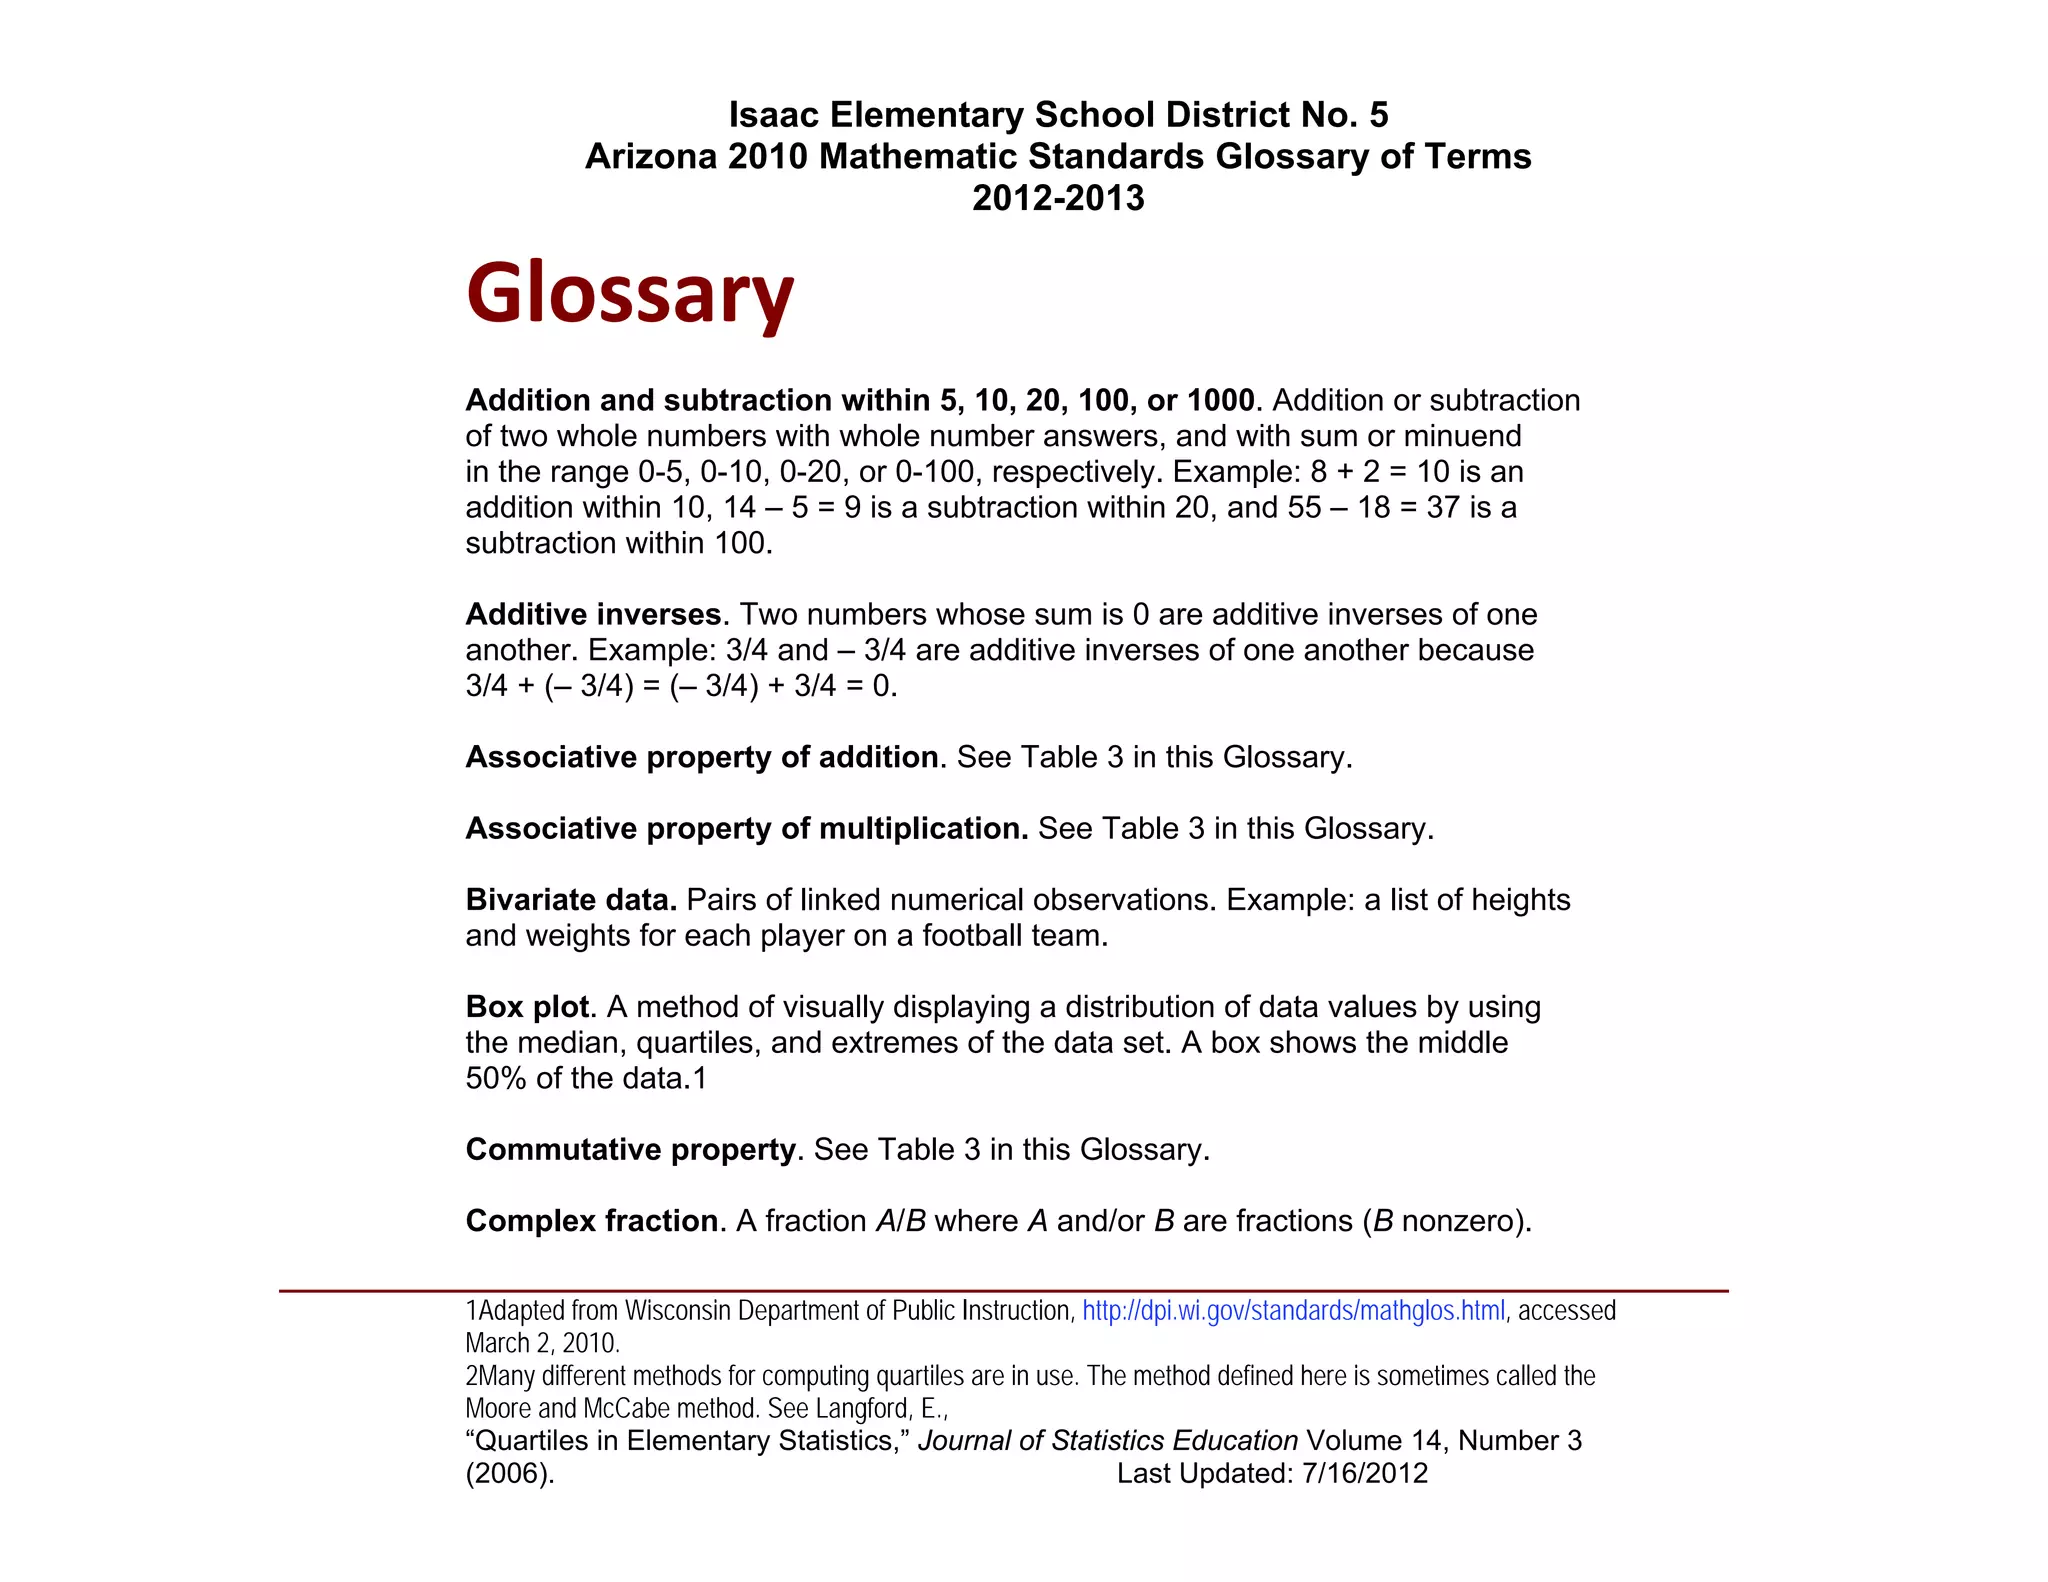
          Addition and subtraction within 5, 10, 20, 100, or 1000. Addition or subtraction
          of two whole numbers with whole number answers, and with sum or minuend
          in the range 0-5, 0-10, 0-20, or 0-100, respectively. Example: 8 + 2 = 10 is an
          addition within 10, 14 – 5 = 9 is a subtraction within 20, and 55 – 18 = 37 is a
          subtraction within 100.

          Additive inverses. Two numbers whose sum is 0 are additive inverses of one
          another. Example: 3/4 and – 3/4 are additive inverses of one another because
          3/4 + (– 3/4) = (– 3/4) + 3/4 = 0.

          Associative property of addition. See Table 3 in this Glossary.

          Associative property of multiplication. See Table 3 in this Glossary.

          Bivariate data. Pairs of linked numerical observations. Example: a list of heights
          and weights for each player on a football team.

          Box plot. A method of visually displaying a distribution of data values by using
          the median, quartiles, and extremes of the data set. A box shows the middle
          50% of the data.1

          Commutative property. See Table 3 in this Glossary.

          Complex fraction. A fraction A/B where A and/or B are fractions (B nonzero).
____________________________________________________________________________________
          1Adapted from Wisconsin Department of Public Instruction, http://dpi.wi.gov/standards/mathglos.html, accessed
          March 2, 2010.
          2Many different methods for computing quartiles are in use. The method defined here is sometimes called the
          Moore and McCabe method. See Langford, E.,
          “Quartiles in Elementary Statistics,” Journal of Statistics Education Volume 14, Number 3
          (2006).                                                       Last Updated: 7/16/2012
Isaac Elementary School District No. 5
                     Arizona 2010 Mathematic Standards Glossary of Terms
                                          2012-2013
          Computation algorithm. A set of predefined steps applicable to a class of
          problems that gives the correct result in every case when the steps are carried
          out correctly. See also: computation strategy.

          Computation strategy. Purposeful manipulations that may be chosen for
          specific problems, may not have a fixed order, and may be aimed at converting
          one problem into another. See also: computation algorithm.

          Congruent. Two plane or solid figures are congruent if one can be obtained from
          the other by rigid motion (a sequence of rotations, reflections, and translations).

          Counting on. A strategy for finding the number of objects in a group without
          having to count every member of the group. For example, if a stack of books
          is known to have 8 books and 3 more books are added to the top, it is not
          necessary to count the stack all over again. One can find the total by counting
          on—pointing to the top book and saying “eight,” following this with “nine, ten,
          eleven. There are eleven books now.”

          Dot plot. See: line plot.

          Dilation. A transformation that moves each point along the ray through the
          point emanating from a fixed center, and multiplies distances from the center by
          a common scale factor.

          Expanded form. A multi-digit number is expressed in expanded form when it is
          written as a sum of single-digit multiples of powers of ten. For example, 643 =
          600 + 40 + 3.


____________________________________________________________________________________
          1Adapted from Wisconsin Department of Public Instruction, http://dpi.wi.gov/standards/mathglos.html, accessed
          March 2, 2010.
          2Many different methods for computing quartiles are in use. The method defined here is sometimes called the
          Moore and McCabe method. See Langford, E.,
          “Quartiles in Elementary Statistics,” Journal of Statistics Education Volume 14, Number 3
          (2006).                                                       Last Updated: 7/16/2012
Isaac Elementary School District No. 5
                     Arizona 2010 Mathematic Standards Glossary of Terms
                                          2012-2013
          Expected value. For a random variable, the weighted average of its possible
          values, with weights given by their respective probabilities.

          First quartile. For a data set with median M, the first quartile is the median of
          the data values less than M. Example: For the data set {1, 3, 6, 7, 10, 12, 14, 15, 22,
          120}, the first quartile is 6.2 See also: median, third quartile, interquartile range.

          Fraction. A number expressible in the form a/b where a is a whole number and
          b is a positive whole number. (The word fraction in these standards always refers
          to a non-negative number.) See also: rational number.

          Identity property of 0. See Table 3 in this Glossary.

          Independently combined probability models. Two probability models are
          said to be combined independently if the probability of each ordered pair in
          the combined model equals the product of the original probabilities of the two
          individual outcomes in the ordered pair.

          Integer. A number expressible in the form a or –a for some whole number a.

          Interquartile Range. A measure of variation in a set of numerical data, the
          interquartile range is the distance between the first and third quartiles of
          the data set. Example: For the data set {1, 3, 6, 7, 10, 12, 14, 15, 22, 120}, the
          interquartile range is 15 – 6 = 9. See also: first quartile, third quartile.

          Line plot. A method of visually displaying a distribution of data values where
          each data value is shown as a dot or mark above a number line. Also known as a
          dot plot.3
____________________________________________________________________________________
          1Adapted from Wisconsin Department of Public Instruction, http://dpi.wi.gov/standards/mathglos.html, accessed
          March 2, 2010.
          2Many different methods for computing quartiles are in use. The method defined here is sometimes called the
          Moore and McCabe method. See Langford, E.,
          “Quartiles in Elementary Statistics,” Journal of Statistics Education Volume 14, Number 3
          (2006).                                                       Last Updated: 7/16/2012
Isaac Elementary School District No. 5
                     Arizona 2010 Mathematic Standards Glossary of Terms
                                          2012-2013
          Mean. A measure of center in a set of numerical data, computed by adding the
          values in a list and then dividing by the number of values in the list.4 Example:
          For the data set {1, 3, 6, 7, 10, 12, 14, 15, 22, 120}, the mean is 21.

          Mean absolute deviation. A measure of variation in a set of numerical data,
          computed by adding the distances between each data value and the mean, then
          dividing by the number of data values. Example: For the data set {2, 3, 6, 7, 10,
          12, 14, 15, 22, 120}, the mean absolute deviation is 20.

          Median. A measure of center in a set of numerical data. The median of a list of
          values is the value appearing at the center of a sorted version of the list—or the
          mean of the two central values, if the list contains an even number of values.
          Example: For the data set {2, 3, 6, 7, 10, 12, 14, 15, 22, 90}, the median is 11.

          Midline. In the graph of a trigonometric function, the horizontal line halfway
          between its maximum and minimum values.

          Multiplication and division within 100. Multiplication or division of two whole
          numbers with whole number answers, and with product or dividend in the range
          0-100. Example: 72 ÷ 8 = 9.

          Multiplicative inverses. Two numbers whose product is 1 are multiplicative
          inverses of one another. Example: 3/4 and 4/3 are multiplicative inverses of one
          another because 3/4 × 4/3 = 4/3 × 3/4 = 1.

          Number line diagram. A diagram of the number line used to represent numbers
          and support reasoning about them. In a number line diagram for measurement
          quantities, the interval from 0 to 1 on the diagram represents the unit of measure
____________________________________________________________________________________
          1Adapted from Wisconsin Department of Public Instruction, http://dpi.wi.gov/standards/mathglos.html, accessed
          March 2, 2010.
          2Many different methods for computing quartiles are in use. The method defined here is sometimes called the
          Moore and McCabe method. See Langford, E.,
          “Quartiles in Elementary Statistics,” Journal of Statistics Education Volume 14, Number 3
          (2006).                                                       Last Updated: 7/16/2012
Isaac Elementary School District No. 5
                     Arizona 2010 Mathematic Standards Glossary of Terms
                                          2012-2013
          for the quantity.

          Percent rate of change. A rate of change expressed as a percent. Example: if a
          population grows from 50 to 55 in a year, it grows by 5/50 = 10% per year.

          Probability distribution. The set of possible values of a random variable with a
          probability assigned to each.

          Properties of operations. See Table 3 in this Glossary.

          Properties of equality. See Table 4 in this Glossary.

          Properties of inequality. See Table 5 in this Glossary.

          Properties of operations. See Table 3 in this Glossary.

          Probability. A number between 0 and 1 used to quantify likelihood for processes
          that have uncertain outcomes (such as tossing a coin, selecting a person at
          random from a group of people, tossing a ball at a target, or testing for a
          medical condition).

          Probability model. A probability model is used to assign probabilities to
          outcomes of a chance process by examining the nature of the process. The set
          of all outcomes is called the sample space, and their probabilities sum to 1. See
          also: uniform probability model.

          Random variable. An assignment of a numerical value to each outcome in a
          sample space.
____________________________________________________________________________________
          1Adapted from Wisconsin Department of Public Instruction, http://dpi.wi.gov/standards/mathglos.html, accessed
          March 2, 2010.
          2Many different methods for computing quartiles are in use. The method defined here is sometimes called the
          Moore and McCabe method. See Langford, E.,
          “Quartiles in Elementary Statistics,” Journal of Statistics Education Volume 14, Number 3
          (2006).                                                       Last Updated: 7/16/2012
Isaac Elementary School District No. 5
                     Arizona 2010 Mathematic Standards Glossary of Terms
                                          2012-2013
          Rational expression. A quotient of two polynomials with a non-zero
          denominator.

          Rational number. A number expressible in the form a/b or – a/b for some
          fraction a/b. The rational numbers include the integers.

          Rectilinear figure. A polygon all angles of which are right angles.

          Rigid motion. A transformation of points in space consisting of
          a sequence ofone or more translations, reflections, and/or rotations. Rigid motions are here
          assumed to preserve distances and angle measures.

          Repeating decimal. The decimal form of a rational number. See also: terminating
          decimal.

          Sample space. In a probability model for a random process, a list of the
          individual outcomes that are to be considered.

          Scatter plot. A graph in the coordinate plane representing a set of bivariate
          data. For example, the heights and weights of a group of people could be
          displayed on a scatter plot.5

          Similarity transformation. A rigid motion followed by a dilation.

          Tape diagram. A drawing that looks like a segment of tape, used to illustrate
          number relationships. Also known as a strip diagram, bar model, fraction strip, or
          length model.


____________________________________________________________________________________
          1Adapted from Wisconsin Department of Public Instruction, http://dpi.wi.gov/standards/mathglos.html, accessed
          March 2, 2010.
          2Many different methods for computing quartiles are in use. The method defined here is sometimes called the
          Moore and McCabe method. See Langford, E.,
          “Quartiles in Elementary Statistics,” Journal of Statistics Education Volume 14, Number 3
          (2006).                                                       Last Updated: 7/16/2012
Isaac Elementary School District No. 5
                     Arizona 2010 Mathematic Standards Glossary of Terms
                                          2012-2013
          Terminating decimal. A decimal is called terminating if its repeating digit is 0.

          Third quartile. For a data set with median M, the third quartile is the median of
          the data values greater than M. Example: For the data set {2, 3, 6, 7, 10, 12, 14,
          15, 22, 120}, the third quartile is 15. See also: median, first quartile, interquartile
          range.

          Transitivity principle for indirect measurement. If the length of object A is
          greater than the length of object B, and the length of object B is greater than
          the length of object C, then the length of object A is greater than the length of
          object C. This principle applies to measurement of other quantities as well.

          Uniform probability model. A probability model which assigns equal
          probability to all outcomes. See also: probability model.

          Vector. A quantity with magnitude and direction in the plane or in space,
          defined by an ordered pair or triple of real numbers.

          Visual fraction model. A tape diagram, number line diagram, or area model.

          Whole numbers. The numbers 0, 1, 2, 3, ….


____________________________________________________________________________________
          1Adapted from Wisconsin Department of Public Instruction, http://dpi.wi.gov/standards/mathglos.html, accessed
          March 2, 2010.
          2Many different methods for computing quartiles are in use. The method defined here is sometimes called the
          Moore and McCabe method. See Langford, E.,
          “Quartiles in Elementary Statistics,” Journal of Statistics Education Volume 14, Number 3
          (2006).                                                       Last Updated: 7/16/2012
Isaac Elementary School District No. 5
                     Arizona 2010 Mathematic Standards Glossary of Terms
                                          2012-2013


____________________________________________________________________________________
          1Adapted from Wisconsin Department of Public Instruction, http://dpi.wi.gov/standards/mathglos.html, accessed
          March 2, 2010.
          2Many different methods for computing quartiles are in use. The method defined here is sometimes called the
          Moore and McCabe method. See Langford, E.,
          “Quartiles in Elementary Statistics,” Journal of Statistics Education Volume 14, Number 3
          (2006).                                                       Last Updated: 7/16/2012

More Related Content

What's hot

Study of Correlation Theory with Different Views and Methodsamong Variables i...
Study of Correlation Theory with Different Views and Methodsamong Variables i...Study of Correlation Theory with Different Views and Methodsamong Variables i...
Study of Correlation Theory with Different Views and Methodsamong Variables i...
inventionjournals
 
Elementary statistics for Food Indusrty
Elementary statistics for Food IndusrtyElementary statistics for Food Indusrty
Elementary statistics for Food IndusrtyAtcharaporn Khoomtong
 
Statics for management
Statics for managementStatics for management
Statics for managementparth06
 
Presentation on Regression Analysis
Presentation on Regression AnalysisPresentation on Regression Analysis
Presentation on Regression Analysis
J P Verma
 
9.1 9.2 9.3 using the graph calc
9.1 9.2 9.3 using the graph calc9.1 9.2 9.3 using the graph calc
9.1 9.2 9.3 using the graph calcleblance
 
Elementary Statistics
Elementary Statistics Elementary Statistics
Elementary Statistics
jennytuazon01630
 
Ratio and Product Type Estimators Using Stratified Ranked Set Sampling
Ratio and Product Type Estimators Using Stratified Ranked Set SamplingRatio and Product Type Estimators Using Stratified Ranked Set Sampling
Ratio and Product Type Estimators Using Stratified Ranked Set Sampling
inventionjournals
 
Regression analysis by akanksha Bali
Regression analysis by akanksha BaliRegression analysis by akanksha Bali
Regression analysis by akanksha Bali
Akanksha Bali
 
Econometrics of High-Dimensional Sparse Models
Econometrics of High-Dimensional Sparse ModelsEconometrics of High-Dimensional Sparse Models
Econometrics of High-Dimensional Sparse Models
NBER
 
Bbs10 ppt ch03
Bbs10 ppt ch03Bbs10 ppt ch03
Bbs10 ppt ch03
Anwar Afridi
 
Chap01 describing data; graphical
Chap01 describing data;  graphicalChap01 describing data;  graphical
Chap01 describing data; graphical
Judianto Nugroho
 
Quality Engineering material
Quality Engineering materialQuality Engineering material
Quality Engineering material
TeluguSudhakar3
 
Applied Business Statistics ch1
Applied Business Statistics ch1Applied Business Statistics ch1
Applied Business Statistics ch1
AbdelmonsifFadl
 
Day 3 descriptive statistics
Day 3  descriptive statisticsDay 3  descriptive statistics
Day 3 descriptive statistics
Elih Sutisna Yanto
 
Lecture 1
Lecture 1Lecture 1
Lecture 1
diogor21atlas
 
Correlation and regression
Correlation and regressionCorrelation and regression
Correlation and regressionKhalid Aziz
 
Lesson 1 07 measures of variation
Lesson 1 07 measures of variationLesson 1 07 measures of variation
Lesson 1 07 measures of variation
Perla Pelicano Corpez
 

What's hot (19)

Study of Correlation Theory with Different Views and Methodsamong Variables i...
Study of Correlation Theory with Different Views and Methodsamong Variables i...Study of Correlation Theory with Different Views and Methodsamong Variables i...
Study of Correlation Theory with Different Views and Methodsamong Variables i...
 
assignment 2
assignment 2assignment 2
assignment 2
 
Elementary statistics for Food Indusrty
Elementary statistics for Food IndusrtyElementary statistics for Food Indusrty
Elementary statistics for Food Indusrty
 
Statics for management
Statics for managementStatics for management
Statics for management
 
Presentation on Regression Analysis
Presentation on Regression AnalysisPresentation on Regression Analysis
Presentation on Regression Analysis
 
9.1 9.2 9.3 using the graph calc
9.1 9.2 9.3 using the graph calc9.1 9.2 9.3 using the graph calc
9.1 9.2 9.3 using the graph calc
 
Elementary Statistics
Elementary Statistics Elementary Statistics
Elementary Statistics
 
Ratio and Product Type Estimators Using Stratified Ranked Set Sampling
Ratio and Product Type Estimators Using Stratified Ranked Set SamplingRatio and Product Type Estimators Using Stratified Ranked Set Sampling
Ratio and Product Type Estimators Using Stratified Ranked Set Sampling
 
Regression analysis by akanksha Bali
Regression analysis by akanksha BaliRegression analysis by akanksha Bali
Regression analysis by akanksha Bali
 
Econometrics of High-Dimensional Sparse Models
Econometrics of High-Dimensional Sparse ModelsEconometrics of High-Dimensional Sparse Models
Econometrics of High-Dimensional Sparse Models
 
Bbs10 ppt ch03
Bbs10 ppt ch03Bbs10 ppt ch03
Bbs10 ppt ch03
 
Chap01 describing data; graphical
Chap01 describing data;  graphicalChap01 describing data;  graphical
Chap01 describing data; graphical
 
Quality Engineering material
Quality Engineering materialQuality Engineering material
Quality Engineering material
 
Applied Business Statistics ch1
Applied Business Statistics ch1Applied Business Statistics ch1
Applied Business Statistics ch1
 
Day 3 descriptive statistics
Day 3  descriptive statisticsDay 3  descriptive statistics
Day 3 descriptive statistics
 
Lecture 1
Lecture 1Lecture 1
Lecture 1
 
Correlation and regression
Correlation and regressionCorrelation and regression
Correlation and regression
 
Using SPSS: A Tutorial
Using SPSS: A TutorialUsing SPSS: A Tutorial
Using SPSS: A Tutorial
 
Lesson 1 07 measures of variation
Lesson 1 07 measures of variationLesson 1 07 measures of variation
Lesson 1 07 measures of variation
 

Similar to 5th Grade Math Glossary

Statistics in research
Statistics in researchStatistics in research
Statistics in research
Balaji P
 
Data Management_new.pptx
Data Management_new.pptxData Management_new.pptx
Data Management_new.pptx
DharenOla3
 
Measures of central tendency
Measures of central tendencyMeasures of central tendency
Measures of central tendency
gaya3lavanya92
 
Class1.ppt
Class1.pptClass1.ppt
Class1.ppt
Gautam G
 
Class1.ppt
Class1.pptClass1.ppt
Class1.ppt
PerumalPitchandi
 
Class1.ppt
Class1.pptClass1.ppt
Class1.ppt
Sandeepkumar628916
 
Introduction to Statistics - Basics of Data - Class 1
Introduction to Statistics - Basics of Data - Class 1Introduction to Statistics - Basics of Data - Class 1
Introduction to Statistics - Basics of Data - Class 1
RajnishSingh367990
 
Class1.ppt
Class1.pptClass1.ppt
Class1.ppt
hanreaz219
 
STATISTICS BASICS INCLUDING DESCRIPTIVE STATISTICS
STATISTICS BASICS INCLUDING DESCRIPTIVE STATISTICSSTATISTICS BASICS INCLUDING DESCRIPTIVE STATISTICS
STATISTICS BASICS INCLUDING DESCRIPTIVE STATISTICS
nagamani651296
 
Statistics
StatisticsStatistics
Statistics
Deepanshu Sharma
 
Topic 2 Measures of Central Tendency.pptx
Topic 2   Measures of Central Tendency.pptxTopic 2   Measures of Central Tendency.pptx
Topic 2 Measures of Central Tendency.pptx
CallplanetsDeveloper
 
Statistics
StatisticsStatistics
Statisticspikuoec
 
3-Measures of Central Tendency for Ungrouped data 2.pptx
3-Measures of Central Tendency for Ungrouped data 2.pptx3-Measures of Central Tendency for Ungrouped data 2.pptx
3-Measures of Central Tendency for Ungrouped data 2.pptx
ssuserdb3083
 
DATA UNIT-3.pptx
DATA UNIT-3.pptxDATA UNIT-3.pptx
DATA UNIT-3.pptx
bibha737
 
Topic 2 Measures of Central Tendency.pptx
Topic 2   Measures of Central Tendency.pptxTopic 2   Measures of Central Tendency.pptx
Topic 2 Measures of Central Tendency.pptx
CallplanetsDeveloper
 
MMW (Data Management)-Part 1 for ULO 2 (1).pptx
MMW (Data Management)-Part 1 for ULO 2 (1).pptxMMW (Data Management)-Part 1 for ULO 2 (1).pptx
MMW (Data Management)-Part 1 for ULO 2 (1).pptx
PETTIROSETALISIC
 
Principal components
Principal componentsPrincipal components
Principal componentsHutami Endang
 
Measure of Association
Measure of AssociationMeasure of Association
Measure of Association
Kalahandi University
 
Use of Excel in Statistics: Problem Solving Vs Problem Understanding
Use of Excel in Statistics: Problem Solving Vs Problem Understanding Use of Excel in Statistics: Problem Solving Vs Problem Understanding
Use of Excel in Statistics: Problem Solving Vs Problem Understanding
IJITE
 
dispersion1.pptx
dispersion1.pptxdispersion1.pptx
dispersion1.pptx
apsoniyajaingtu
 

Similar to 5th Grade Math Glossary (20)

Statistics in research
Statistics in researchStatistics in research
Statistics in research
 
Data Management_new.pptx
Data Management_new.pptxData Management_new.pptx
Data Management_new.pptx
 
Measures of central tendency
Measures of central tendencyMeasures of central tendency
Measures of central tendency
 
Class1.ppt
Class1.pptClass1.ppt
Class1.ppt
 
Class1.ppt
Class1.pptClass1.ppt
Class1.ppt
 
Class1.ppt
Class1.pptClass1.ppt
Class1.ppt
 
Introduction to Statistics - Basics of Data - Class 1
Introduction to Statistics - Basics of Data - Class 1Introduction to Statistics - Basics of Data - Class 1
Introduction to Statistics - Basics of Data - Class 1
 
Class1.ppt
Class1.pptClass1.ppt
Class1.ppt
 
STATISTICS BASICS INCLUDING DESCRIPTIVE STATISTICS
STATISTICS BASICS INCLUDING DESCRIPTIVE STATISTICSSTATISTICS BASICS INCLUDING DESCRIPTIVE STATISTICS
STATISTICS BASICS INCLUDING DESCRIPTIVE STATISTICS
 
Statistics
StatisticsStatistics
Statistics
 
Topic 2 Measures of Central Tendency.pptx
Topic 2   Measures of Central Tendency.pptxTopic 2   Measures of Central Tendency.pptx
Topic 2 Measures of Central Tendency.pptx
 
Statistics
StatisticsStatistics
Statistics
 
3-Measures of Central Tendency for Ungrouped data 2.pptx
3-Measures of Central Tendency for Ungrouped data 2.pptx3-Measures of Central Tendency for Ungrouped data 2.pptx
3-Measures of Central Tendency for Ungrouped data 2.pptx
 
DATA UNIT-3.pptx
DATA UNIT-3.pptxDATA UNIT-3.pptx
DATA UNIT-3.pptx
 
Topic 2 Measures of Central Tendency.pptx
Topic 2   Measures of Central Tendency.pptxTopic 2   Measures of Central Tendency.pptx
Topic 2 Measures of Central Tendency.pptx
 
MMW (Data Management)-Part 1 for ULO 2 (1).pptx
MMW (Data Management)-Part 1 for ULO 2 (1).pptxMMW (Data Management)-Part 1 for ULO 2 (1).pptx
MMW (Data Management)-Part 1 for ULO 2 (1).pptx
 
Principal components
Principal componentsPrincipal components
Principal components
 
Measure of Association
Measure of AssociationMeasure of Association
Measure of Association
 
Use of Excel in Statistics: Problem Solving Vs Problem Understanding
Use of Excel in Statistics: Problem Solving Vs Problem Understanding Use of Excel in Statistics: Problem Solving Vs Problem Understanding
Use of Excel in Statistics: Problem Solving Vs Problem Understanding
 
dispersion1.pptx
dispersion1.pptxdispersion1.pptx
dispersion1.pptx
 

More from Isaac_Schools_5

2012 8th grade_math_curriculum_guide
2012 8th grade_math_curriculum_guide2012 8th grade_math_curriculum_guide
2012 8th grade_math_curriculum_guideIsaac_Schools_5
 
2012 7th grade_math_curriculum_guide
2012 7th grade_math_curriculum_guide2012 7th grade_math_curriculum_guide
2012 7th grade_math_curriculum_guideIsaac_Schools_5
 
2012 6th grade_math_curriculum_guide
2012 6th grade_math_curriculum_guide2012 6th grade_math_curriculum_guide
2012 6th grade_math_curriculum_guideIsaac_Schools_5
 
8th Grade Math Curriculum Map
8th Grade Math Curriculum Map8th Grade Math Curriculum Map
8th Grade Math Curriculum MapIsaac_Schools_5
 
7th Grade Math Curriculum Map
7th Grade Math Curriculum Map7th Grade Math Curriculum Map
7th Grade Math Curriculum MapIsaac_Schools_5
 
6th Grade Math Curriculum Map
6th Grade Math Curriculum Map6th Grade Math Curriculum Map
6th Grade Math Curriculum MapIsaac_Schools_5
 
8th Grade Science Map revised
8th Grade Science Map  revised8th Grade Science Map  revised
8th Grade Science Map revisedIsaac_Schools_5
 
7th Grade Science Maps revised
7th Grade Science Maps revised7th Grade Science Maps revised
7th Grade Science Maps revisedIsaac_Schools_5
 
6th Grade Science Maps revised
6th Grade Science Maps revised6th Grade Science Maps revised
6th Grade Science Maps revisedIsaac_Schools_5
 
5th Grade Science Maps revised
5th Grade Science Maps revised5th Grade Science Maps revised
5th Grade Science Maps revisedIsaac_Schools_5
 
4th Grade Science Maps revised
4th Grade Science Maps revised4th Grade Science Maps revised
4th Grade Science Maps revisedIsaac_Schools_5
 
Unit 9 Fifth Grade cs 2012 2013
Unit 9 Fifth Grade cs 2012 2013Unit 9 Fifth Grade cs 2012 2013
Unit 9 Fifth Grade cs 2012 2013Isaac_Schools_5
 
Unit 8 Fifth Grade cs 2012 2013
Unit 8 Fifth Grade cs 2012 2013Unit 8 Fifth Grade cs 2012 2013
Unit 8 Fifth Grade cs 2012 2013Isaac_Schools_5
 
Unit 7 Fifth Grade cs 2012 2013
Unit 7 Fifth Grade cs 2012 2013Unit 7 Fifth Grade cs 2012 2013
Unit 7 Fifth Grade cs 2012 2013Isaac_Schools_5
 
Unit 6 Fifth Grade cs 2012 2013
Unit 6 Fifth Grade cs 2012 2013Unit 6 Fifth Grade cs 2012 2013
Unit 6 Fifth Grade cs 2012 2013Isaac_Schools_5
 
Unit 5 Fifth Grade cs 2012 2013
Unit 5 Fifth Grade cs 2012 2013Unit 5 Fifth Grade cs 2012 2013
Unit 5 Fifth Grade cs 2012 2013Isaac_Schools_5
 
Unit 4 Fifth Grade cs 2012 2013
Unit 4 Fifth Grade cs 2012 2013Unit 4 Fifth Grade cs 2012 2013
Unit 4 Fifth Grade cs 2012 2013Isaac_Schools_5
 
Unit 3 Fifth Grade cs 2012 2013
Unit 3 Fifth Grade cs 2012 2013Unit 3 Fifth Grade cs 2012 2013
Unit 3 Fifth Grade cs 2012 2013Isaac_Schools_5
 
Unit 2 Fifth Grade cs 2012 2013
Unit 2 Fifth Grade cs 2012 2013Unit 2 Fifth Grade cs 2012 2013
Unit 2 Fifth Grade cs 2012 2013Isaac_Schools_5
 

More from Isaac_Schools_5 (20)

2012 8th grade_math_curriculum_guide
2012 8th grade_math_curriculum_guide2012 8th grade_math_curriculum_guide
2012 8th grade_math_curriculum_guide
 
2012 7th grade_math_curriculum_guide
2012 7th grade_math_curriculum_guide2012 7th grade_math_curriculum_guide
2012 7th grade_math_curriculum_guide
 
2012 6th grade_math_curriculum_guide
2012 6th grade_math_curriculum_guide2012 6th grade_math_curriculum_guide
2012 6th grade_math_curriculum_guide
 
8th Grade Math Curriculum Map
8th Grade Math Curriculum Map8th Grade Math Curriculum Map
8th Grade Math Curriculum Map
 
7th Grade Math Curriculum Map
7th Grade Math Curriculum Map7th Grade Math Curriculum Map
7th Grade Math Curriculum Map
 
6th Grade Math Curriculum Map
6th Grade Math Curriculum Map6th Grade Math Curriculum Map
6th Grade Math Curriculum Map
 
8th science map revised
8th science map  revised8th science map  revised
8th science map revised
 
8th Grade Science Map revised
8th Grade Science Map  revised8th Grade Science Map  revised
8th Grade Science Map revised
 
7th Grade Science Maps revised
7th Grade Science Maps revised7th Grade Science Maps revised
7th Grade Science Maps revised
 
6th Grade Science Maps revised
6th Grade Science Maps revised6th Grade Science Maps revised
6th Grade Science Maps revised
 
5th Grade Science Maps revised
5th Grade Science Maps revised5th Grade Science Maps revised
5th Grade Science Maps revised
 
4th Grade Science Maps revised
4th Grade Science Maps revised4th Grade Science Maps revised
4th Grade Science Maps revised
 
Unit 9 Fifth Grade cs 2012 2013
Unit 9 Fifth Grade cs 2012 2013Unit 9 Fifth Grade cs 2012 2013
Unit 9 Fifth Grade cs 2012 2013
 
Unit 8 Fifth Grade cs 2012 2013
Unit 8 Fifth Grade cs 2012 2013Unit 8 Fifth Grade cs 2012 2013
Unit 8 Fifth Grade cs 2012 2013
 
Unit 7 Fifth Grade cs 2012 2013
Unit 7 Fifth Grade cs 2012 2013Unit 7 Fifth Grade cs 2012 2013
Unit 7 Fifth Grade cs 2012 2013
 
Unit 6 Fifth Grade cs 2012 2013
Unit 6 Fifth Grade cs 2012 2013Unit 6 Fifth Grade cs 2012 2013
Unit 6 Fifth Grade cs 2012 2013
 
Unit 5 Fifth Grade cs 2012 2013
Unit 5 Fifth Grade cs 2012 2013Unit 5 Fifth Grade cs 2012 2013
Unit 5 Fifth Grade cs 2012 2013
 
Unit 4 Fifth Grade cs 2012 2013
Unit 4 Fifth Grade cs 2012 2013Unit 4 Fifth Grade cs 2012 2013
Unit 4 Fifth Grade cs 2012 2013
 
Unit 3 Fifth Grade cs 2012 2013
Unit 3 Fifth Grade cs 2012 2013Unit 3 Fifth Grade cs 2012 2013
Unit 3 Fifth Grade cs 2012 2013
 
Unit 2 Fifth Grade cs 2012 2013
Unit 2 Fifth Grade cs 2012 2013Unit 2 Fifth Grade cs 2012 2013
Unit 2 Fifth Grade cs 2012 2013
 

Recently uploaded

Chapter 4 - Islamic Financial Institutions in Malaysia.pptx
Chapter 4 - Islamic Financial Institutions in Malaysia.pptxChapter 4 - Islamic Financial Institutions in Malaysia.pptx
Chapter 4 - Islamic Financial Institutions in Malaysia.pptx
Mohd Adib Abd Muin, Senior Lecturer at Universiti Utara Malaysia
 
Pride Month Slides 2024 David Douglas School District
Pride Month Slides 2024 David Douglas School DistrictPride Month Slides 2024 David Douglas School District
Pride Month Slides 2024 David Douglas School District
David Douglas School District
 
Top five deadliest dog breeds in America
Top five deadliest dog breeds in AmericaTop five deadliest dog breeds in America
Top five deadliest dog breeds in America
Bisnar Chase Personal Injury Attorneys
 
World environment day ppt For 5 June 2024
World environment day ppt For 5 June 2024World environment day ppt For 5 June 2024
World environment day ppt For 5 June 2024
ak6969907
 
TESDA TM1 REVIEWER FOR NATIONAL ASSESSMENT WRITTEN AND ORAL QUESTIONS WITH A...
TESDA TM1 REVIEWER  FOR NATIONAL ASSESSMENT WRITTEN AND ORAL QUESTIONS WITH A...TESDA TM1 REVIEWER  FOR NATIONAL ASSESSMENT WRITTEN AND ORAL QUESTIONS WITH A...
TESDA TM1 REVIEWER FOR NATIONAL ASSESSMENT WRITTEN AND ORAL QUESTIONS WITH A...
EugeneSaldivar
 
Exploiting Artificial Intelligence for Empowering Researchers and Faculty, In...
Exploiting Artificial Intelligence for Empowering Researchers and Faculty, In...Exploiting Artificial Intelligence for Empowering Researchers and Faculty, In...
Exploiting Artificial Intelligence for Empowering Researchers and Faculty, In...
Dr. Vinod Kumar Kanvaria
 
How to Build a Module in Odoo 17 Using the Scaffold Method
How to Build a Module in Odoo 17 Using the Scaffold MethodHow to Build a Module in Odoo 17 Using the Scaffold Method
How to Build a Module in Odoo 17 Using the Scaffold Method
Celine George
 
Digital Artifact 1 - 10VCD Environments Unit
Digital Artifact 1 - 10VCD Environments UnitDigital Artifact 1 - 10VCD Environments Unit
Digital Artifact 1 - 10VCD Environments Unit
chanes7
 
Unit 2- Research Aptitude (UGC NET Paper I).pdf
Unit 2- Research Aptitude (UGC NET Paper I).pdfUnit 2- Research Aptitude (UGC NET Paper I).pdf
Unit 2- Research Aptitude (UGC NET Paper I).pdf
Thiyagu K
 
How to Add Chatter in the odoo 17 ERP Module
How to Add Chatter in the odoo 17 ERP ModuleHow to Add Chatter in the odoo 17 ERP Module
How to Add Chatter in the odoo 17 ERP Module
Celine George
 
Mule 4.6 & Java 17 Upgrade | MuleSoft Mysore Meetup #46
Mule 4.6 & Java 17 Upgrade | MuleSoft Mysore Meetup #46Mule 4.6 & Java 17 Upgrade | MuleSoft Mysore Meetup #46
Mule 4.6 & Java 17 Upgrade | MuleSoft Mysore Meetup #46
MysoreMuleSoftMeetup
 
PIMS Job Advertisement 2024.pdf Islamabad
PIMS Job Advertisement 2024.pdf IslamabadPIMS Job Advertisement 2024.pdf Islamabad
PIMS Job Advertisement 2024.pdf Islamabad
AyyanKhan40
 
MATATAG CURRICULUM: ASSESSING THE READINESS OF ELEM. PUBLIC SCHOOL TEACHERS I...
MATATAG CURRICULUM: ASSESSING THE READINESS OF ELEM. PUBLIC SCHOOL TEACHERS I...MATATAG CURRICULUM: ASSESSING THE READINESS OF ELEM. PUBLIC SCHOOL TEACHERS I...
MATATAG CURRICULUM: ASSESSING THE READINESS OF ELEM. PUBLIC SCHOOL TEACHERS I...
NelTorrente
 
BÀI TẬP BỔ TRỢ TIẾNG ANH GLOBAL SUCCESS LỚP 3 - CẢ NĂM (CÓ FILE NGHE VÀ ĐÁP Á...
BÀI TẬP BỔ TRỢ TIẾNG ANH GLOBAL SUCCESS LỚP 3 - CẢ NĂM (CÓ FILE NGHE VÀ ĐÁP Á...BÀI TẬP BỔ TRỢ TIẾNG ANH GLOBAL SUCCESS LỚP 3 - CẢ NĂM (CÓ FILE NGHE VÀ ĐÁP Á...
BÀI TẬP BỔ TRỢ TIẾNG ANH GLOBAL SUCCESS LỚP 3 - CẢ NĂM (CÓ FILE NGHE VÀ ĐÁP Á...
Nguyen Thanh Tu Collection
 
DRUGS AND ITS classification slide share
DRUGS AND ITS classification slide shareDRUGS AND ITS classification slide share
DRUGS AND ITS classification slide share
taiba qazi
 
Delivering Micro-Credentials in Technical and Vocational Education and Training
Delivering Micro-Credentials in Technical and Vocational Education and TrainingDelivering Micro-Credentials in Technical and Vocational Education and Training
Delivering Micro-Credentials in Technical and Vocational Education and Training
AG2 Design
 
ANATOMY AND BIOMECHANICS OF HIP JOINT.pdf
ANATOMY AND BIOMECHANICS OF HIP JOINT.pdfANATOMY AND BIOMECHANICS OF HIP JOINT.pdf
ANATOMY AND BIOMECHANICS OF HIP JOINT.pdf
Priyankaranawat4
 
Azure Interview Questions and Answers PDF By ScholarHat
Azure Interview Questions and Answers PDF By ScholarHatAzure Interview Questions and Answers PDF By ScholarHat
Azure Interview Questions and Answers PDF By ScholarHat
Scholarhat
 
2024.06.01 Introducing a competency framework for languag learning materials ...
2024.06.01 Introducing a competency framework for languag learning materials ...2024.06.01 Introducing a competency framework for languag learning materials ...
2024.06.01 Introducing a competency framework for languag learning materials ...
Sandy Millin
 
Introduction to AI for Nonprofits with Tapp Network
Introduction to AI for Nonprofits with Tapp NetworkIntroduction to AI for Nonprofits with Tapp Network
Introduction to AI for Nonprofits with Tapp Network
TechSoup
 

Recently uploaded (20)

Chapter 4 - Islamic Financial Institutions in Malaysia.pptx
Chapter 4 - Islamic Financial Institutions in Malaysia.pptxChapter 4 - Islamic Financial Institutions in Malaysia.pptx
Chapter 4 - Islamic Financial Institutions in Malaysia.pptx
 
Pride Month Slides 2024 David Douglas School District
Pride Month Slides 2024 David Douglas School DistrictPride Month Slides 2024 David Douglas School District
Pride Month Slides 2024 David Douglas School District
 
Top five deadliest dog breeds in America
Top five deadliest dog breeds in AmericaTop five deadliest dog breeds in America
Top five deadliest dog breeds in America
 
World environment day ppt For 5 June 2024
World environment day ppt For 5 June 2024World environment day ppt For 5 June 2024
World environment day ppt For 5 June 2024
 
TESDA TM1 REVIEWER FOR NATIONAL ASSESSMENT WRITTEN AND ORAL QUESTIONS WITH A...
TESDA TM1 REVIEWER  FOR NATIONAL ASSESSMENT WRITTEN AND ORAL QUESTIONS WITH A...TESDA TM1 REVIEWER  FOR NATIONAL ASSESSMENT WRITTEN AND ORAL QUESTIONS WITH A...
TESDA TM1 REVIEWER FOR NATIONAL ASSESSMENT WRITTEN AND ORAL QUESTIONS WITH A...
 
Exploiting Artificial Intelligence for Empowering Researchers and Faculty, In...
Exploiting Artificial Intelligence for Empowering Researchers and Faculty, In...Exploiting Artificial Intelligence for Empowering Researchers and Faculty, In...
Exploiting Artificial Intelligence for Empowering Researchers and Faculty, In...
 
How to Build a Module in Odoo 17 Using the Scaffold Method
How to Build a Module in Odoo 17 Using the Scaffold MethodHow to Build a Module in Odoo 17 Using the Scaffold Method
How to Build a Module in Odoo 17 Using the Scaffold Method
 
Digital Artifact 1 - 10VCD Environments Unit
Digital Artifact 1 - 10VCD Environments UnitDigital Artifact 1 - 10VCD Environments Unit
Digital Artifact 1 - 10VCD Environments Unit
 
Unit 2- Research Aptitude (UGC NET Paper I).pdf
Unit 2- Research Aptitude (UGC NET Paper I).pdfUnit 2- Research Aptitude (UGC NET Paper I).pdf
Unit 2- Research Aptitude (UGC NET Paper I).pdf
 
How to Add Chatter in the odoo 17 ERP Module
How to Add Chatter in the odoo 17 ERP ModuleHow to Add Chatter in the odoo 17 ERP Module
How to Add Chatter in the odoo 17 ERP Module
 
Mule 4.6 & Java 17 Upgrade | MuleSoft Mysore Meetup #46
Mule 4.6 & Java 17 Upgrade | MuleSoft Mysore Meetup #46Mule 4.6 & Java 17 Upgrade | MuleSoft Mysore Meetup #46
Mule 4.6 & Java 17 Upgrade | MuleSoft Mysore Meetup #46
 
PIMS Job Advertisement 2024.pdf Islamabad
PIMS Job Advertisement 2024.pdf IslamabadPIMS Job Advertisement 2024.pdf Islamabad
PIMS Job Advertisement 2024.pdf Islamabad
 
MATATAG CURRICULUM: ASSESSING THE READINESS OF ELEM. PUBLIC SCHOOL TEACHERS I...
MATATAG CURRICULUM: ASSESSING THE READINESS OF ELEM. PUBLIC SCHOOL TEACHERS I...MATATAG CURRICULUM: ASSESSING THE READINESS OF ELEM. PUBLIC SCHOOL TEACHERS I...
MATATAG CURRICULUM: ASSESSING THE READINESS OF ELEM. PUBLIC SCHOOL TEACHERS I...
 
BÀI TẬP BỔ TRỢ TIẾNG ANH GLOBAL SUCCESS LỚP 3 - CẢ NĂM (CÓ FILE NGHE VÀ ĐÁP Á...
BÀI TẬP BỔ TRỢ TIẾNG ANH GLOBAL SUCCESS LỚP 3 - CẢ NĂM (CÓ FILE NGHE VÀ ĐÁP Á...BÀI TẬP BỔ TRỢ TIẾNG ANH GLOBAL SUCCESS LỚP 3 - CẢ NĂM (CÓ FILE NGHE VÀ ĐÁP Á...
BÀI TẬP BỔ TRỢ TIẾNG ANH GLOBAL SUCCESS LỚP 3 - CẢ NĂM (CÓ FILE NGHE VÀ ĐÁP Á...
 
DRUGS AND ITS classification slide share
DRUGS AND ITS classification slide shareDRUGS AND ITS classification slide share
DRUGS AND ITS classification slide share
 
Delivering Micro-Credentials in Technical and Vocational Education and Training
Delivering Micro-Credentials in Technical and Vocational Education and TrainingDelivering Micro-Credentials in Technical and Vocational Education and Training
Delivering Micro-Credentials in Technical and Vocational Education and Training
 
ANATOMY AND BIOMECHANICS OF HIP JOINT.pdf
ANATOMY AND BIOMECHANICS OF HIP JOINT.pdfANATOMY AND BIOMECHANICS OF HIP JOINT.pdf
ANATOMY AND BIOMECHANICS OF HIP JOINT.pdf
 
Azure Interview Questions and Answers PDF By ScholarHat
Azure Interview Questions and Answers PDF By ScholarHatAzure Interview Questions and Answers PDF By ScholarHat
Azure Interview Questions and Answers PDF By ScholarHat
 
2024.06.01 Introducing a competency framework for languag learning materials ...
2024.06.01 Introducing a competency framework for languag learning materials ...2024.06.01 Introducing a competency framework for languag learning materials ...
2024.06.01 Introducing a competency framework for languag learning materials ...
 
Introduction to AI for Nonprofits with Tapp Network
Introduction to AI for Nonprofits with Tapp NetworkIntroduction to AI for Nonprofits with Tapp Network
Introduction to AI for Nonprofits with Tapp Network
 

5th Grade Math Glossary

  • 1. Isaac Elementary School District No. 5 Arizona 2010 Mathematic Standards Glossary of Terms 2012-2013 Glossary   Addition and subtraction within 5, 10, 20, 100, or 1000. Addition or subtraction of two whole numbers with whole number answers, and with sum or minuend in the range 0-5, 0-10, 0-20, or 0-100, respectively. Example: 8 + 2 = 10 is an addition within 10, 14 – 5 = 9 is a subtraction within 20, and 55 – 18 = 37 is a subtraction within 100. Additive inverses. Two numbers whose sum is 0 are additive inverses of one another. Example: 3/4 and – 3/4 are additive inverses of one another because 3/4 + (– 3/4) = (– 3/4) + 3/4 = 0. Associative property of addition. See Table 3 in this Glossary. Associative property of multiplication. See Table 3 in this Glossary. Bivariate data. Pairs of linked numerical observations. Example: a list of heights and weights for each player on a football team. Box plot. A method of visually displaying a distribution of data values by using the median, quartiles, and extremes of the data set. A box shows the middle 50% of the data.1 Commutative property. See Table 3 in this Glossary. Complex fraction. A fraction A/B where A and/or B are fractions (B nonzero). ____________________________________________________________________________________ 1Adapted from Wisconsin Department of Public Instruction, http://dpi.wi.gov/standards/mathglos.html, accessed March 2, 2010. 2Many different methods for computing quartiles are in use. The method defined here is sometimes called the Moore and McCabe method. See Langford, E., “Quartiles in Elementary Statistics,” Journal of Statistics Education Volume 14, Number 3 (2006). Last Updated: 7/16/2012
  • 2. Isaac Elementary School District No. 5 Arizona 2010 Mathematic Standards Glossary of Terms 2012-2013 Computation algorithm. A set of predefined steps applicable to a class of problems that gives the correct result in every case when the steps are carried out correctly. See also: computation strategy. Computation strategy. Purposeful manipulations that may be chosen for specific problems, may not have a fixed order, and may be aimed at converting one problem into another. See also: computation algorithm. Congruent. Two plane or solid figures are congruent if one can be obtained from the other by rigid motion (a sequence of rotations, reflections, and translations). Counting on. A strategy for finding the number of objects in a group without having to count every member of the group. For example, if a stack of books is known to have 8 books and 3 more books are added to the top, it is not necessary to count the stack all over again. One can find the total by counting on—pointing to the top book and saying “eight,” following this with “nine, ten, eleven. There are eleven books now.” Dot plot. See: line plot. Dilation. A transformation that moves each point along the ray through the point emanating from a fixed center, and multiplies distances from the center by a common scale factor. Expanded form. A multi-digit number is expressed in expanded form when it is written as a sum of single-digit multiples of powers of ten. For example, 643 = 600 + 40 + 3. ____________________________________________________________________________________ 1Adapted from Wisconsin Department of Public Instruction, http://dpi.wi.gov/standards/mathglos.html, accessed March 2, 2010. 2Many different methods for computing quartiles are in use. The method defined here is sometimes called the Moore and McCabe method. See Langford, E., “Quartiles in Elementary Statistics,” Journal of Statistics Education Volume 14, Number 3 (2006). Last Updated: 7/16/2012
  • 3. Isaac Elementary School District No. 5 Arizona 2010 Mathematic Standards Glossary of Terms 2012-2013 Expected value. For a random variable, the weighted average of its possible values, with weights given by their respective probabilities. First quartile. For a data set with median M, the first quartile is the median of the data values less than M. Example: For the data set {1, 3, 6, 7, 10, 12, 14, 15, 22, 120}, the first quartile is 6.2 See also: median, third quartile, interquartile range. Fraction. A number expressible in the form a/b where a is a whole number and b is a positive whole number. (The word fraction in these standards always refers to a non-negative number.) See also: rational number. Identity property of 0. See Table 3 in this Glossary. Independently combined probability models. Two probability models are said to be combined independently if the probability of each ordered pair in the combined model equals the product of the original probabilities of the two individual outcomes in the ordered pair. Integer. A number expressible in the form a or –a for some whole number a. Interquartile Range. A measure of variation in a set of numerical data, the interquartile range is the distance between the first and third quartiles of the data set. Example: For the data set {1, 3, 6, 7, 10, 12, 14, 15, 22, 120}, the interquartile range is 15 – 6 = 9. See also: first quartile, third quartile. Line plot. A method of visually displaying a distribution of data values where each data value is shown as a dot or mark above a number line. Also known as a dot plot.3 ____________________________________________________________________________________ 1Adapted from Wisconsin Department of Public Instruction, http://dpi.wi.gov/standards/mathglos.html, accessed March 2, 2010. 2Many different methods for computing quartiles are in use. The method defined here is sometimes called the Moore and McCabe method. See Langford, E., “Quartiles in Elementary Statistics,” Journal of Statistics Education Volume 14, Number 3 (2006). Last Updated: 7/16/2012
  • 4. Isaac Elementary School District No. 5 Arizona 2010 Mathematic Standards Glossary of Terms 2012-2013 Mean. A measure of center in a set of numerical data, computed by adding the values in a list and then dividing by the number of values in the list.4 Example: For the data set {1, 3, 6, 7, 10, 12, 14, 15, 22, 120}, the mean is 21. Mean absolute deviation. A measure of variation in a set of numerical data, computed by adding the distances between each data value and the mean, then dividing by the number of data values. Example: For the data set {2, 3, 6, 7, 10, 12, 14, 15, 22, 120}, the mean absolute deviation is 20. Median. A measure of center in a set of numerical data. The median of a list of values is the value appearing at the center of a sorted version of the list—or the mean of the two central values, if the list contains an even number of values. Example: For the data set {2, 3, 6, 7, 10, 12, 14, 15, 22, 90}, the median is 11. Midline. In the graph of a trigonometric function, the horizontal line halfway between its maximum and minimum values. Multiplication and division within 100. Multiplication or division of two whole numbers with whole number answers, and with product or dividend in the range 0-100. Example: 72 ÷ 8 = 9. Multiplicative inverses. Two numbers whose product is 1 are multiplicative inverses of one another. Example: 3/4 and 4/3 are multiplicative inverses of one another because 3/4 × 4/3 = 4/3 × 3/4 = 1. Number line diagram. A diagram of the number line used to represent numbers and support reasoning about them. In a number line diagram for measurement quantities, the interval from 0 to 1 on the diagram represents the unit of measure ____________________________________________________________________________________ 1Adapted from Wisconsin Department of Public Instruction, http://dpi.wi.gov/standards/mathglos.html, accessed March 2, 2010. 2Many different methods for computing quartiles are in use. The method defined here is sometimes called the Moore and McCabe method. See Langford, E., “Quartiles in Elementary Statistics,” Journal of Statistics Education Volume 14, Number 3 (2006). Last Updated: 7/16/2012
  • 5. Isaac Elementary School District No. 5 Arizona 2010 Mathematic Standards Glossary of Terms 2012-2013 for the quantity. Percent rate of change. A rate of change expressed as a percent. Example: if a population grows from 50 to 55 in a year, it grows by 5/50 = 10% per year. Probability distribution. The set of possible values of a random variable with a probability assigned to each. Properties of operations. See Table 3 in this Glossary. Properties of equality. See Table 4 in this Glossary. Properties of inequality. See Table 5 in this Glossary. Properties of operations. See Table 3 in this Glossary. Probability. A number between 0 and 1 used to quantify likelihood for processes that have uncertain outcomes (such as tossing a coin, selecting a person at random from a group of people, tossing a ball at a target, or testing for a medical condition). Probability model. A probability model is used to assign probabilities to outcomes of a chance process by examining the nature of the process. The set of all outcomes is called the sample space, and their probabilities sum to 1. See also: uniform probability model. Random variable. An assignment of a numerical value to each outcome in a sample space. ____________________________________________________________________________________ 1Adapted from Wisconsin Department of Public Instruction, http://dpi.wi.gov/standards/mathglos.html, accessed March 2, 2010. 2Many different methods for computing quartiles are in use. The method defined here is sometimes called the Moore and McCabe method. See Langford, E., “Quartiles in Elementary Statistics,” Journal of Statistics Education Volume 14, Number 3 (2006). Last Updated: 7/16/2012
  • 6. Isaac Elementary School District No. 5 Arizona 2010 Mathematic Standards Glossary of Terms 2012-2013 Rational expression. A quotient of two polynomials with a non-zero denominator. Rational number. A number expressible in the form a/b or – a/b for some fraction a/b. The rational numbers include the integers. Rectilinear figure. A polygon all angles of which are right angles. Rigid motion. A transformation of points in space consisting of a sequence ofone or more translations, reflections, and/or rotations. Rigid motions are here assumed to preserve distances and angle measures. Repeating decimal. The decimal form of a rational number. See also: terminating decimal. Sample space. In a probability model for a random process, a list of the individual outcomes that are to be considered. Scatter plot. A graph in the coordinate plane representing a set of bivariate data. For example, the heights and weights of a group of people could be displayed on a scatter plot.5 Similarity transformation. A rigid motion followed by a dilation. Tape diagram. A drawing that looks like a segment of tape, used to illustrate number relationships. Also known as a strip diagram, bar model, fraction strip, or length model. ____________________________________________________________________________________ 1Adapted from Wisconsin Department of Public Instruction, http://dpi.wi.gov/standards/mathglos.html, accessed March 2, 2010. 2Many different methods for computing quartiles are in use. The method defined here is sometimes called the Moore and McCabe method. See Langford, E., “Quartiles in Elementary Statistics,” Journal of Statistics Education Volume 14, Number 3 (2006). Last Updated: 7/16/2012
  • 7. Isaac Elementary School District No. 5 Arizona 2010 Mathematic Standards Glossary of Terms 2012-2013 Terminating decimal. A decimal is called terminating if its repeating digit is 0. Third quartile. For a data set with median M, the third quartile is the median of the data values greater than M. Example: For the data set {2, 3, 6, 7, 10, 12, 14, 15, 22, 120}, the third quartile is 15. See also: median, first quartile, interquartile range. Transitivity principle for indirect measurement. If the length of object A is greater than the length of object B, and the length of object B is greater than the length of object C, then the length of object A is greater than the length of object C. This principle applies to measurement of other quantities as well. Uniform probability model. A probability model which assigns equal probability to all outcomes. See also: probability model. Vector. A quantity with magnitude and direction in the plane or in space, defined by an ordered pair or triple of real numbers. Visual fraction model. A tape diagram, number line diagram, or area model. Whole numbers. The numbers 0, 1, 2, 3, …. ____________________________________________________________________________________ 1Adapted from Wisconsin Department of Public Instruction, http://dpi.wi.gov/standards/mathglos.html, accessed March 2, 2010. 2Many different methods for computing quartiles are in use. The method defined here is sometimes called the Moore and McCabe method. See Langford, E., “Quartiles in Elementary Statistics,” Journal of Statistics Education Volume 14, Number 3 (2006). Last Updated: 7/16/2012
  • 8. Isaac Elementary School District No. 5 Arizona 2010 Mathematic Standards Glossary of Terms 2012-2013 ____________________________________________________________________________________ 1Adapted from Wisconsin Department of Public Instruction, http://dpi.wi.gov/standards/mathglos.html, accessed March 2, 2010. 2Many different methods for computing quartiles are in use. The method defined here is sometimes called the Moore and McCabe method. See Langford, E., “Quartiles in Elementary Statistics,” Journal of Statistics Education Volume 14, Number 3 (2006). Last Updated: 7/16/2012