Downloaded 184 times
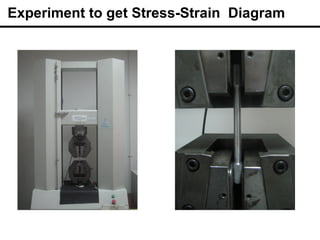
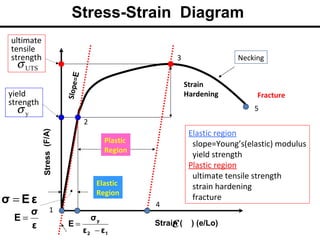
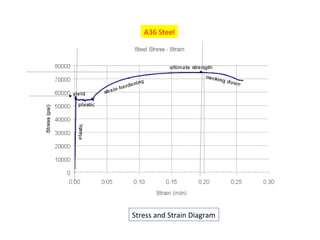
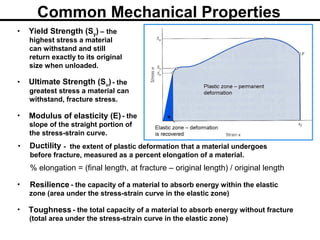
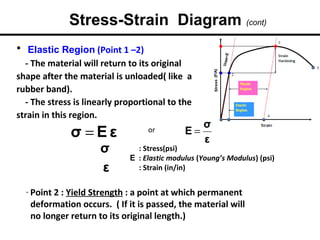
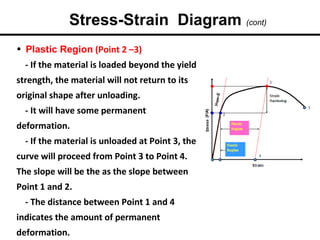
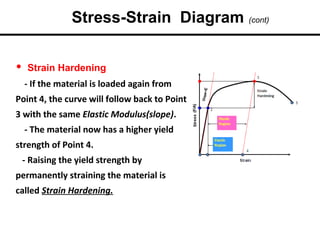
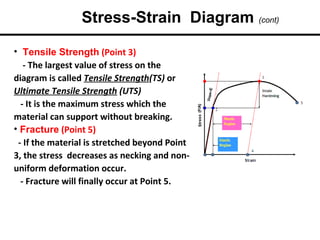
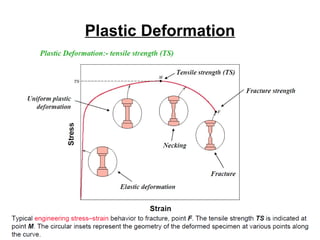
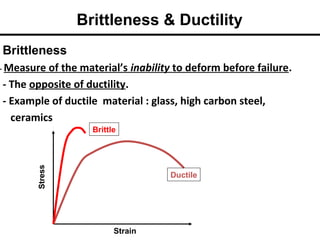
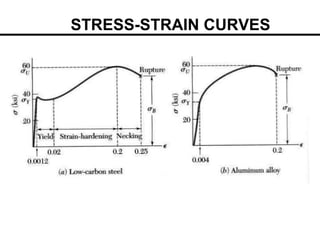
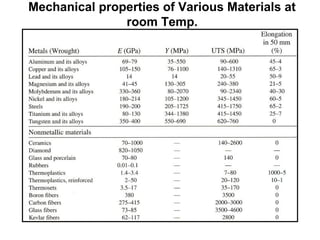


The document discusses stress-strain diagrams and the mechanical properties they represent. It begins by describing how to create a stress-strain diagram through experimentation. It then explains the different regions of the diagram - the elastic region, plastic region, strain hardening, and fracture. Key properties are defined, including yield strength, tensile/ultimate strength, modulus of elasticity, resilience, toughness, ductility, and brittleness. Examples of stress-strain diagrams are shown for A36 steel. Common mechanical testing properties are also listed.