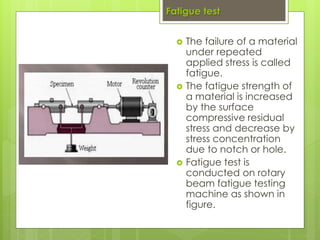
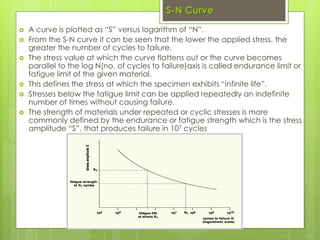
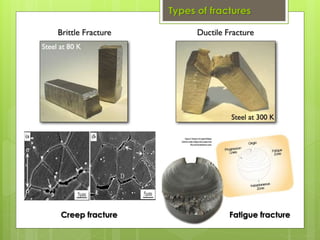
STRESS-STRAIN CURVES
LECTURE 3
By: Kanu Priya Jhanji
Asst. Professor
School of Aeronautical Sciences
Hindustan University
kanupriyaj@hindustanuniv.ac.in
AIRCRAFT
MATERIALS
UNIT-1
Introduction
 Creep is high temperature progressive deformation
at constant stress.
 "High temperature" is a relative term dependent
upon the materials involved. Creep rates are used in
evaluating materials for boilers, gas turbines, jet
engines, ovens, or any application that involves high
temperatures under load.
 Understanding high temperature behavior of metals
is useful in designing failure resistant systems.
 So, creep test is essential to predict the working life
of machine components which are subjected to
creep
SCHOOL OF AERONAUTICAL SCIENCES
HINDUSTAN UNIVERSITY
Creep test
 The test piece of metal is held in a steel structure such
that one of its ends is held in a holder and the other
end is loaded through a lever.
 Surrounding the specimen, there is a temperature
controlled chamber by which we can do the creep
testing at a constant temperature over a long period
of time.
 First, the zero reading of the length is noted.
 Load is then applied and after few minutes
extension(axial deformation) is measured periodically
throughout the test.
 In this way, a number of readings are taken.
 The extension is measured either directly by a
telescope or a mirror and scale arrangement.
Creep testing Machine
Fatigue test
 The failure of a material
under repeated
applied stress is called
fatigue.
 The fatigue strength of
a material is increased
by the surface
compressive residual
stress and decrease by
stress concentration
due to notch or hole.
 Fatigue test is
conducted on rotary
beam fatigue testing
machine as shown in
figure.
Process
 The test piece is loaded in pure bending and rotated about
its axis with the help of motor.
 With each rotation, the stress at any part of the cross-section
of the specimen (except at an axis down the center) varies
sinusoidally between maximum tensile and maximum
compressive stresses.
 Each revolution thus constitutes one cycle of stress reversal.
 The speed of the motor will indicate the frequency of the
stress reversal and it is indicated by revolution counter.
 The stress (S) is varied using different loads and the number of
cycles (N) till failure occurs is noted for each load.
 It is observed that after a sufficient number of stress reversals,
a crack is formed on the outer surface of the specimen, in the
form of a ring.
 This crack goes on extending towards the center of the test
piece till it breaks away
S-N Curve
 A curve is plotted as “S” versus logarithm of “N”.
 From the S-N curve it can be seen that the lower the applied stress, the
greater the number of cycles to failure.
 The stress value at which the curve flattens out or the curve becomes
parallel to the log N(no. of cycles to failure)axis is called endurance limit or
fatigue limit of the given material.
 This defines the stress at which the specimen exhibits “infinite life”.
 Stresses below the fatigue limit can be applied repeatedly an indefinite
number of times without causing failure.
 The strength of materials under repeated or cyclic stresses is more
commonly defined by the endurance or fatigue strength which is the stress
amplitude “S”, that produces failure in 107 cycles
Fractures
 A fracture is the separation of an object or material
into two or more pieces under the action of stress.
 The fracture of a solid usually occurs due to the
development of certain displacement discontinuity
surfaces within the solid.
 If a displacement develops perpendicular to the
surface of displacement, it is called a normal tensile
crack or simply a crack; if a displacement develops
tangentially to the surface of displacement, it is called
a shear crack, slip band, or dislocation.
 Fracture strength or breaking strength is the stress
when a specimen fails or fractures.
Types of fractures
Fatigue fractureCreep fracture
fractures
 A brittle fracture may be defined as a fracture which
takes place by the rapid propagation of crack with a
quite negligible plastic deformation
 Ductile fracture may be defined as the fracture which
takes place by a slow propagation of crack with
appreciable plastic deformation.
 Fatigue fracture is defined as fracture which takes place
under repeatedly applied fatigue stresses. It occurs at
stresses well below the tensile strength of the material.
The tendency of fatigue fracture increases with the
increase in temperature and higher rate of straining.
 Creep fracture is defined as the fracture which takes
place due to excessive creeping of materials under
steady loading. It occurs in metals like iron, copper and
nickel at higher temperatures. The tendency of creep
fracture increases with the increase in temperature and
high rate of straining.
D/B Brittle and Ductile
Fracture
 Brittle fracture is the one which
has the movement of crack
with a negligible plastic
deformation adjacent to
crack.
 Rapid rate of crack
propagation.
 Failure is on account of direct
stress.
 Surface obtained at the
fracture is dull and
accompanied with hills and
valleys.
 It is characterized by
separation of normal to tensile
stress.
 It occurs when material is in
elastic condition.
 The tendency of brittle fracture
is increased by decreasing
temperature, increasing strain
rate and work hardening.
 Ductile fracture is the one
which is accompanied with
large plastic deformation and
it is result of intense localized
plastic deformation adjacent
to crack.
 Slow rate of crack
propagation
 Failure is on account of shear
stress developed at 45⁰.
 Surface obtained at the
fracture is shining and
accompanied with the
formation of slip planes.
 It is characterized by the
formation of cup and cone.
 It occurs when the material is in
plastic condition.
 The tendency of ductile
fracture is increased by
dislocations and other defects
in metals.
Stress-Strain curve for
ductile materials
 A ductile material is one having relatively large
tensile strains up to the point of rupture like
structural steel and aluminum .
 The stress-strain diagram for mild steel is shown
below.
Proportional Limit
(Hooke's Law)
 From the origin O to the point A called proportional
limit, the stress-strain curve is a straight line.
 This linear relation between elongation and the axial
force causing was first noticed by Sir Robert Hooke in
1678 and is called Hooke's Law that within the
proportional limit, the stress is directly proportional to
strain or
σ∝ε or σ=Eε
 The constant of proportionality E is called the Modulus
of Elasticity or Young's Modulus and is equal to the
slope of the stress-strain diagram from O to A.
 The elastic limit is the limit beyond which the material will no longer
go back to its original shape when the load is removed, or it is the
maximum stress that may be developed such that there is no
permanent or residual deformation when the load is entirely
removed.
 The region in stress-strain diagram from O to B is called the elastic
range.
 The region from B to F is called the plastic range.
 Yield point is the point at which the material will have an
appreciable elongation or yielding without any increase in load.
 The maximum ordinate in the stress-strain diagram is the ultimate
strength or tensile strength.
 Rupture strength is the strength of the material at rupture. This is also
known as the breaking strength.
 From point B to point E strain hardening will takes place. In this
region, while specimen is elongating, its x-sectional area will
decrease. Decrease in area is fairly uniform over entire gauge
length
 At ultimate stress, x-sectional area begins to decrease in a localized
region. As a result, a constriction or “neck” tends to form in this
region as specimen elongates further. Specimen finally breaks at
fracture stress(point F).
 Modulus of resilience is the work done on a unit
volume of material as the force is gradually increased
from O to A, in Nm/m3.
 This may be calculated as the area under the stress-
strain curve from the origin O to up to the elastic limit
E (the shaded area in the figure).
 The resilience of the material is its ability to absorb
energy without creating a permanent distortion.
 Modulus of toughness is the work done on a unit
volume of material as the force is gradually increased
from O to F, in Nm/m3.
 This may be calculated as the area under the entire
stress-strain curve (from O to F).
 The toughness of a material is its ability to absorb
energy without causing it to break.
 Working stress is defined as the actual stress of a
material under a given loading.
 The maximum safe stress that a material can carry
is termed as the allowable stress.
 The allowable stress should be limited to values not
exceeding the proportional limit. However, since
proportional limit is difficult to determine
accurately, the allowable stress is taken as either
the yield point or ultimate strength divided by a
factor of safety.
 The ratio of this strength (ultimate or yield strength)
to allowable strength is called the factor of safety.
True stress-strain diagram
 Instead of using original cross-sectional area and
length, we can use the actual cross-sectional area
and length at the instant the load is measured
 Values of stress and strain thus calculated are called
true stress and true strain, and a plot of their values is
the true stress-strain diagram
 In strain-hardening range, conventional σ- diagram
shows specimen supporting decreasing load
 While true σ- diagram shows material to be sustaining
increasing stress
 Although both diagrams are different, most
engineering design is done within elastic range
provided
1. Material is “stiff,” like most metals
2. Strain to elastic limit remains small
3. Error in using engineering values of σ and  is very small
(0.1 %) compared to true values

Aircraft materials lecture 3

  • 1.
    STRESS-STRAIN CURVES LECTURE 3 By:Kanu Priya Jhanji Asst. Professor School of Aeronautical Sciences Hindustan University kanupriyaj@hindustanuniv.ac.in AIRCRAFT MATERIALS UNIT-1
  • 2.
    Introduction  Creep ishigh temperature progressive deformation at constant stress.  "High temperature" is a relative term dependent upon the materials involved. Creep rates are used in evaluating materials for boilers, gas turbines, jet engines, ovens, or any application that involves high temperatures under load.  Understanding high temperature behavior of metals is useful in designing failure resistant systems.  So, creep test is essential to predict the working life of machine components which are subjected to creep SCHOOL OF AERONAUTICAL SCIENCES HINDUSTAN UNIVERSITY
  • 3.
    Creep test  Thetest piece of metal is held in a steel structure such that one of its ends is held in a holder and the other end is loaded through a lever.  Surrounding the specimen, there is a temperature controlled chamber by which we can do the creep testing at a constant temperature over a long period of time.  First, the zero reading of the length is noted.  Load is then applied and after few minutes extension(axial deformation) is measured periodically throughout the test.  In this way, a number of readings are taken.  The extension is measured either directly by a telescope or a mirror and scale arrangement.
  • 4.
  • 5.
    Fatigue test  Thefailure of a material under repeated applied stress is called fatigue.  The fatigue strength of a material is increased by the surface compressive residual stress and decrease by stress concentration due to notch or hole.  Fatigue test is conducted on rotary beam fatigue testing machine as shown in figure.
  • 6.
    Process  The testpiece is loaded in pure bending and rotated about its axis with the help of motor.  With each rotation, the stress at any part of the cross-section of the specimen (except at an axis down the center) varies sinusoidally between maximum tensile and maximum compressive stresses.  Each revolution thus constitutes one cycle of stress reversal.  The speed of the motor will indicate the frequency of the stress reversal and it is indicated by revolution counter.  The stress (S) is varied using different loads and the number of cycles (N) till failure occurs is noted for each load.  It is observed that after a sufficient number of stress reversals, a crack is formed on the outer surface of the specimen, in the form of a ring.  This crack goes on extending towards the center of the test piece till it breaks away
  • 7.
    S-N Curve  Acurve is plotted as “S” versus logarithm of “N”.  From the S-N curve it can be seen that the lower the applied stress, the greater the number of cycles to failure.  The stress value at which the curve flattens out or the curve becomes parallel to the log N(no. of cycles to failure)axis is called endurance limit or fatigue limit of the given material.  This defines the stress at which the specimen exhibits “infinite life”.  Stresses below the fatigue limit can be applied repeatedly an indefinite number of times without causing failure.  The strength of materials under repeated or cyclic stresses is more commonly defined by the endurance or fatigue strength which is the stress amplitude “S”, that produces failure in 107 cycles
  • 8.
    Fractures  A fractureis the separation of an object or material into two or more pieces under the action of stress.  The fracture of a solid usually occurs due to the development of certain displacement discontinuity surfaces within the solid.  If a displacement develops perpendicular to the surface of displacement, it is called a normal tensile crack or simply a crack; if a displacement develops tangentially to the surface of displacement, it is called a shear crack, slip band, or dislocation.  Fracture strength or breaking strength is the stress when a specimen fails or fractures.
  • 9.
    Types of fractures FatiguefractureCreep fracture
  • 10.
    fractures  A brittlefracture may be defined as a fracture which takes place by the rapid propagation of crack with a quite negligible plastic deformation  Ductile fracture may be defined as the fracture which takes place by a slow propagation of crack with appreciable plastic deformation.  Fatigue fracture is defined as fracture which takes place under repeatedly applied fatigue stresses. It occurs at stresses well below the tensile strength of the material. The tendency of fatigue fracture increases with the increase in temperature and higher rate of straining.  Creep fracture is defined as the fracture which takes place due to excessive creeping of materials under steady loading. It occurs in metals like iron, copper and nickel at higher temperatures. The tendency of creep fracture increases with the increase in temperature and high rate of straining.
  • 11.
    D/B Brittle andDuctile Fracture  Brittle fracture is the one which has the movement of crack with a negligible plastic deformation adjacent to crack.  Rapid rate of crack propagation.  Failure is on account of direct stress.  Surface obtained at the fracture is dull and accompanied with hills and valleys.  It is characterized by separation of normal to tensile stress.  It occurs when material is in elastic condition.  The tendency of brittle fracture is increased by decreasing temperature, increasing strain rate and work hardening.  Ductile fracture is the one which is accompanied with large plastic deformation and it is result of intense localized plastic deformation adjacent to crack.  Slow rate of crack propagation  Failure is on account of shear stress developed at 45⁰.  Surface obtained at the fracture is shining and accompanied with the formation of slip planes.  It is characterized by the formation of cup and cone.  It occurs when the material is in plastic condition.  The tendency of ductile fracture is increased by dislocations and other defects in metals.
  • 12.
    Stress-Strain curve for ductilematerials  A ductile material is one having relatively large tensile strains up to the point of rupture like structural steel and aluminum .  The stress-strain diagram for mild steel is shown below.
  • 13.
    Proportional Limit (Hooke's Law) From the origin O to the point A called proportional limit, the stress-strain curve is a straight line.  This linear relation between elongation and the axial force causing was first noticed by Sir Robert Hooke in 1678 and is called Hooke's Law that within the proportional limit, the stress is directly proportional to strain or σ∝ε or σ=Eε  The constant of proportionality E is called the Modulus of Elasticity or Young's Modulus and is equal to the slope of the stress-strain diagram from O to A.
  • 14.
     The elasticlimit is the limit beyond which the material will no longer go back to its original shape when the load is removed, or it is the maximum stress that may be developed such that there is no permanent or residual deformation when the load is entirely removed.  The region in stress-strain diagram from O to B is called the elastic range.  The region from B to F is called the plastic range.  Yield point is the point at which the material will have an appreciable elongation or yielding without any increase in load.  The maximum ordinate in the stress-strain diagram is the ultimate strength or tensile strength.  Rupture strength is the strength of the material at rupture. This is also known as the breaking strength.  From point B to point E strain hardening will takes place. In this region, while specimen is elongating, its x-sectional area will decrease. Decrease in area is fairly uniform over entire gauge length  At ultimate stress, x-sectional area begins to decrease in a localized region. As a result, a constriction or “neck” tends to form in this region as specimen elongates further. Specimen finally breaks at fracture stress(point F).
  • 15.
     Modulus ofresilience is the work done on a unit volume of material as the force is gradually increased from O to A, in Nm/m3.  This may be calculated as the area under the stress- strain curve from the origin O to up to the elastic limit E (the shaded area in the figure).  The resilience of the material is its ability to absorb energy without creating a permanent distortion.  Modulus of toughness is the work done on a unit volume of material as the force is gradually increased from O to F, in Nm/m3.  This may be calculated as the area under the entire stress-strain curve (from O to F).  The toughness of a material is its ability to absorb energy without causing it to break.
  • 16.
     Working stressis defined as the actual stress of a material under a given loading.  The maximum safe stress that a material can carry is termed as the allowable stress.  The allowable stress should be limited to values not exceeding the proportional limit. However, since proportional limit is difficult to determine accurately, the allowable stress is taken as either the yield point or ultimate strength divided by a factor of safety.  The ratio of this strength (ultimate or yield strength) to allowable strength is called the factor of safety.
  • 17.
    True stress-strain diagram Instead of using original cross-sectional area and length, we can use the actual cross-sectional area and length at the instant the load is measured  Values of stress and strain thus calculated are called true stress and true strain, and a plot of their values is the true stress-strain diagram  In strain-hardening range, conventional σ- diagram shows specimen supporting decreasing load  While true σ- diagram shows material to be sustaining increasing stress  Although both diagrams are different, most engineering design is done within elastic range provided 1. Material is “stiff,” like most metals 2. Strain to elastic limit remains small 3. Error in using engineering values of σ and  is very small (0.1 %) compared to true values