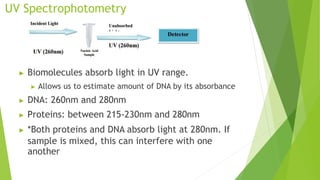
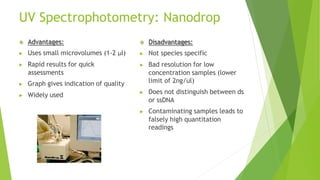
DNA ESTIMATION
Why?
▶ Assess quality DNA/RNA
▶ Determine amounts needed for downstream
applications (Sequencing, PCR, Cloning)
▶ Confirm experiment / extraction success
Methods
▶ UV Spectrophotometry
▶Nanodrop
▶ Ethidium Bromide Staining
▶ Gel Electrophoresis Analysis
▶ Fluorometric Quantification
▶ PicoGreen
▶Qubit
▶Hoechst 33258 dye
▶ Real time PCR
▶ Bioanalyzer
UV Spectrophotometry
▶ Biomolecules absorb light in UV range.
▶ Allows us to estimate amount of DNA by its absorbance
▶ DNA: 260nm and 280nm
▶ Proteins: between 215-230nm and 280nm
▶ *Both proteins and DNA absorb light at 280nm. If
sample is mixed, this can interfere with one
another
UV Spectrophotometry: Nanodrop
 Disadvantages:
▶ Not species specific
▶ Bad resolution for low
concentration samples (lower
limit of 2ng/ul)
▶ Does not distinguish between ds
or ssDNA
▶ Contaminating samples leads to
falsely high quantitation
readings
 Advantages:
▶ Uses small microvolumes (1-2 μl)
▶ Rapid results for quick
assessments
▶ Graph gives indication of quality
▶ Widely used
UV Spectrophotometry: Nanodrop
▶ Absorbance of solution at two
wavelengths ( 260nm and 280nm)
▶ Calculate ratio A260/A280
▶ Ratio of less than 1.8 signifies that sample
is contaminated with protein or phenol.
Indications poor extraction.
▶ *dependent on pH and ionic strength of
buffer
Pure RNA: 2.0
Pure DNA: 1.8
Prue Protein: 0.6
Nucleic Acid Purity determined by:
▶ Absorbance of solution at two wavelengths
( 260nm and 230nm)
▶ Calculate ratio A260/A230
▶ If ratio varies, may indicate presence of
residual phenol, magnetic beads,
carbohydrates.
Pure RNA/DNA: 2.2-1.8
UV Spectrophotometry: Nanodrop Negative values:
dirty pedestals or
incorrect blank
1
2
Ragged line:
Bad blank
Jagged line:
Broken read or low
volume
3
4
High 230nm:
Contaminates;
carbohydrates, phenols,
guanidine
isothiocyanate
Other Methods
▶ Ethidium Bromide Staining:
Binds to Nucleic Acid and gives
orange fluorescence.
▶ Gel Electrophoresis Analysis;
▶ Calculate band size using software from
imager. Compare fluorescence intensities
of ladder and sample to estimate DNA
concentration
▶ Create graph with linear trendline to
calculate mass wrt intensity numbers
 Advantages:
▶ Specific bands
▶ Not pure samples
 Disadvantages:
▶ Need lots of DNA
▶ Not very accurate
Other Methods
▶ Fluorometric Quantification; uses fluorescent dye
▶ PicoGreen; binds dsDNA
▶ Measure fluorescent intensity of PicoGreen dye with spec.
▶ DNA quantified by comparing sample to set of standards
▶ Qubit; binds DNA, RNA or protein depending on kit
▶ Similar Advantages and Disadvantages to PicoGreen
▶ Hoechst 33258 dye; specific to DNA
▶ Good for both large and small amounts of DNA
 Disadvantages:
 Need special equipment and reagents/kit
 Longer prep time
 Advantages:
 High throughput
 Increased sensitivity
 Less prone to contaminants
Other Methods
▶ Real time PCR
▶ Fluorescent dye binding to dsDNA as it accumulates during PCR process
▶ Targets specific region of DNA template
▶ Used for sequencing prep, to verify quality and quantity of DNA
libraries
▶ Bioanalyzer; automated electrophoresis
▶ Size, quantitation and purity assessments
▶ Small volume of sample needed
▶ Multiple platforms (RNA, DNA)
▶ Both low and high concentration samples
▶ Easy to use, but expensive
▶ Hybridization-Based Techniques; Southern or Northern Blotting
▶ “Probe sequence” based
▶ Higher resolution (down to actual nucleotide sequence)

281_DNA quantification and it's importance

  • 1.
  • 2.
    Why? ▶ Assess qualityDNA/RNA ▶ Determine amounts needed for downstream applications (Sequencing, PCR, Cloning) ▶ Confirm experiment / extraction success
  • 3.
    Methods ▶ UV Spectrophotometry ▶Nanodrop ▶Ethidium Bromide Staining ▶ Gel Electrophoresis Analysis ▶ Fluorometric Quantification ▶ PicoGreen ▶Qubit ▶Hoechst 33258 dye ▶ Real time PCR ▶ Bioanalyzer
  • 4.
    UV Spectrophotometry ▶ Biomoleculesabsorb light in UV range. ▶ Allows us to estimate amount of DNA by its absorbance ▶ DNA: 260nm and 280nm ▶ Proteins: between 215-230nm and 280nm ▶ *Both proteins and DNA absorb light at 280nm. If sample is mixed, this can interfere with one another
  • 5.
    UV Spectrophotometry: Nanodrop Disadvantages: ▶ Not species specific ▶ Bad resolution for low concentration samples (lower limit of 2ng/ul) ▶ Does not distinguish between ds or ssDNA ▶ Contaminating samples leads to falsely high quantitation readings  Advantages: ▶ Uses small microvolumes (1-2 μl) ▶ Rapid results for quick assessments ▶ Graph gives indication of quality ▶ Widely used
  • 6.
    UV Spectrophotometry: Nanodrop ▶Absorbance of solution at two wavelengths ( 260nm and 280nm) ▶ Calculate ratio A260/A280 ▶ Ratio of less than 1.8 signifies that sample is contaminated with protein or phenol. Indications poor extraction. ▶ *dependent on pH and ionic strength of buffer Pure RNA: 2.0 Pure DNA: 1.8 Prue Protein: 0.6 Nucleic Acid Purity determined by: ▶ Absorbance of solution at two wavelengths ( 260nm and 230nm) ▶ Calculate ratio A260/A230 ▶ If ratio varies, may indicate presence of residual phenol, magnetic beads, carbohydrates. Pure RNA/DNA: 2.2-1.8
  • 7.
    UV Spectrophotometry: NanodropNegative values: dirty pedestals or incorrect blank 1 2 Ragged line: Bad blank Jagged line: Broken read or low volume 3 4 High 230nm: Contaminates; carbohydrates, phenols, guanidine isothiocyanate
  • 8.
    Other Methods ▶ EthidiumBromide Staining: Binds to Nucleic Acid and gives orange fluorescence. ▶ Gel Electrophoresis Analysis; ▶ Calculate band size using software from imager. Compare fluorescence intensities of ladder and sample to estimate DNA concentration ▶ Create graph with linear trendline to calculate mass wrt intensity numbers  Advantages: ▶ Specific bands ▶ Not pure samples  Disadvantages: ▶ Need lots of DNA ▶ Not very accurate
  • 9.
    Other Methods ▶ FluorometricQuantification; uses fluorescent dye ▶ PicoGreen; binds dsDNA ▶ Measure fluorescent intensity of PicoGreen dye with spec. ▶ DNA quantified by comparing sample to set of standards ▶ Qubit; binds DNA, RNA or protein depending on kit ▶ Similar Advantages and Disadvantages to PicoGreen ▶ Hoechst 33258 dye; specific to DNA ▶ Good for both large and small amounts of DNA  Disadvantages:  Need special equipment and reagents/kit  Longer prep time  Advantages:  High throughput  Increased sensitivity  Less prone to contaminants
  • 10.
    Other Methods ▶ Realtime PCR ▶ Fluorescent dye binding to dsDNA as it accumulates during PCR process ▶ Targets specific region of DNA template ▶ Used for sequencing prep, to verify quality and quantity of DNA libraries ▶ Bioanalyzer; automated electrophoresis ▶ Size, quantitation and purity assessments ▶ Small volume of sample needed ▶ Multiple platforms (RNA, DNA) ▶ Both low and high concentration samples ▶ Easy to use, but expensive ▶ Hybridization-Based Techniques; Southern or Northern Blotting ▶ “Probe sequence” based ▶ Higher resolution (down to actual nucleotide sequence)