26 28
•
0 likes•102 views

1. Uttar Pradesh remains the most populated state in India with almost 200 million people, while Sikkim has the least population of only 607,000 people. 2. Some key factors that influence population distribution in India include ecological factors like climate, landforms, soils and resources, as well as cultural factors such as economic activities and demographic factors such as birth and death rates and migration trends. 3. Areas with fertile soils, abundant water resources, and proximity to rivers tend to have higher population densities, while mountainous, desert, or low rainfall areas are more sparsely populated.

Recommended
Recommended
More Related Content
What's hot
What's hot (20)
Viewers also liked
Viewers also liked (18)
Similar to 26 28
Similar to 26 28 (20)
More from INTERNATIONAL INDEXED,REFERRED,MULTILINGUAL,INTERDISCIPLINARY, MONTHLY RESEARCH JOURNAL
More from INTERNATIONAL INDEXED,REFERRED,MULTILINGUAL,INTERDISCIPLINARY, MONTHLY RESEARCH JOURNAL (20)
Recently uploaded
Recently uploaded (20)
26 28
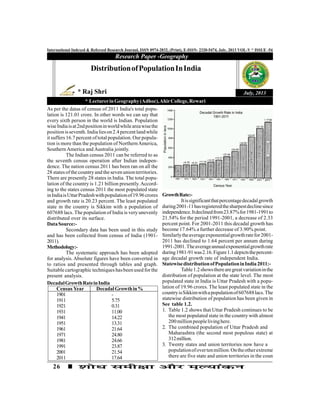
- 1. 26 International Indexed & Refereed Research Journal, ISSN 0974-2832, (Print), E-ISSN- 2320-5474, July, 2013 VOL-V * ISSUE -54 As per the datas of census of 2011 India's total popu- lation is 121.01 crore. In other words we can say that every sixth person in the world is Indian. Population wiseIndiaisat2ndpositioninworldwhileareawisethe positionisseventh. Indialieson2.4 percentlandwhile it suffers 16.7 percent of total population. Our popula- tion is more than the population of NorthernAmerica, Southern America and Australia jointly. The Indian census 2011 can be referred to as the seventh census operation after Indian indepen- dence. The nation census 2011 has been ran on all the 28 states ofthe country and the seven unionterritories. There are presently 28 states in India. The total popu- lation of the country is 1.21 billion presently.Accord- ing to the states census 2011 the most populated state inIndiaisUttarPradeshwithpopulationof19.96crores and growth rate is 20.23 percent. The least populated state in the country is Sikkim with a population of 607688 lacs. The population of India is very unevenly distributed over its surface. DataSource:- Secondary data has been used in this study and has been collected from census of India (1901- 2011). Methodology:- The systematic approach has been adopted for analysis. Absolute figures have been converted in to ratios and presented through tables and graph. Suitable cartographic techniques hasbeenused for the present analysis. Research Paper -Geography July, 2013 DistributionofPopulationInIndia * Raj Shri * LecturerinGeography(Adhoc),AhirCollege,Rewari GrowthRate:- Itissignificantthatpercentagedecadalgrowth during2001-11hasregisteredthesharpestdeclinesince independence.Itdeclinedfrom23.87%for1981-1991to 21.54% for the period 1991-2001, a decrease of 2.33 percent point. For 2001-2011 this decadal growth has become 17.64% a further decrease of 3.90% point. Similarlytheaverageexponentialgrowthratefor2001- 2011 has declined to 1.64 percent per annum during 1991-2001.Theaverageannualexponentialgrowthrate during1981-91was2.16.Figure1.1depictsthepercent- age decadal growth rate of independent India. StatewisedistributionofPopulationinIndia2011:- Table1.2showstherearegreatvariationinthe distribution of population at the state level. The most populated state in India is Uttar Pradesh with a popu- lation of 19.96 crores. The least populated state in the countryisSikkimwithapopulationof607688lacs.The statewise distribution of population has been given in See table 1.2. 1. Table 1.2 shows that Uttar Pradesh continues to be the most populated state in the country with almost 200millionpeoplelivinghere. 2. The combined population of Uttar Pradesh and Maharashtra (the second most populous state) at 312million. 3. Twenty states and union territories now have a populationofovertenmillion.Ontheotherextreme there are five state and union territories in the coun DecadalGrowthRateinIndia Census Year DecadalGrowthin% 1901 - 1911 5.75 1921 0.31 1931 11.00 1941 14.22 1951 13.31 1961 21.64 1971 24.80 1981 24.66 1991 23.87 2001 21.54 2011 17.64
- 2. 27SHODH, SAMIKSHA AUR MULYANKAN International Indexed & Refereed Research Journal, ISSN 0974-2832, (Print), E-ISSN- 2320-5474, July, 2013 VOL-V * ISSUE -54 try that are yet to reach the one million mark. 4. While Uttar Pradesh (19.9 Million), Maharahstra (11.24Million),Bihar(10.38Million),WestBengal (91.3Million)andAndhraPradesh(84.7 Million) have all held on to the top five states in term of their rankingin 2011 as compared to 2001. 5. MadhyaPradesh(72.6Million)whichhasmovedon to take the sixth position from its seventh position pushingTamilNadu(72.1 million)nowtheseventh spot. 6. Area wise Rajasthan and Madhya Pradesh are two big states in our country. Area in these states is 10.4%and9.37%ofourcountrywhilepopulationis 5.6% and 6% only. 7. U.P.ison7.26%oftotalareawhileitsuffers16.49% of our total population. 8. InBiharareaisjust2.86%whilepopulationis8.58%. 9. Eleven states and six U.T. have more population than their area. 10.The other side hilly area Jammu and Kashmir, Arunachal Pradesh and Uttrakhand suffers very lowpopulation with 1.04%, 0.11%and 0.84% re Table 1.2 State/U.T. Population Growth Rate Uttar Pradesh 199,812,341 20.23 Maharashtra 112,374,333 15.99 Bihar 104,699,452 23.42 West Bengal 91,276,115 13.84 Andra Pradesh 84,580,777 10.98 Madhya Pradesh 72,626,809 20.35 Tamil Nadu 72,147,030 15.61 Rajasthan 68,548,437 21.31 Karnataka 61,095,297 15.60 Guajrat 60,439,692 19.28 Orissa 41,974,218 14.05 Kerala 33,406,061 4.91 Jharkhand 32,988,134 22.42 Assam 31,205,576 17.07 Punjab 27,743,338 13.89 Chattisgarh 25,545,198 22.21 Haryana 25,351,462 19.90 Delhi 16,787,941 21.21 Jammu & Kashmir 12,541,302 23.64 Uttrakhand 10,086,292 18.81 Himachal Pradesh 6,864,602 12.94 Tripura 3,673,917 14.84 Meghalaya 2,966,889 27.95 Manipur 2,570,390 12.05 Nagaland 1,978,502 0.58 Goa 1,458,545 8.23 Arunachal Pradesh 1,383,727 26.03 Puducherry 1,247,953 28.08 Mizoram 1,097,206 23.48 Chandigarh 1,055,450 17.19 Sikkim 6,10,577 12.89 Andaman and Nicobar Island 380,581 6.86 Dadra and Nagar Haveli 343,709 55.88 Daman and Diu 243,247 53.76 Lakshadweep 64,473 6.30 Total 1,210,193,422 17.64 spectively. However these states have a vast Geogrpahicalarea. 11.Sikkim has the least population (only 6.07 lakh) FactorsaffectingDistributionofPopulation:- The factors which determine the pattern of populationdistributionareascomplexandvaried.These factors may be grouped under three classes:- (a) Ecological Factors - Climate, landforms, soils other physicalresources and space relationship. (b) Cultural Factors - Including the attitudes and aimsofthepeople,theireconomicactivitiesand techniques etc. (c) Demographic Factors - including the different birth and death rates of the various areas and the current of migration. (d) Ecological Factors -There isgeneral agreement the ecological conditions such as the nature and degreeoffertilityofthesoil,therelationdoeffect the population distribution. There is wide differ ence of opinion regarding the way in which the ecological element operate in shading the distri bution of population.
- 3. 28 International Indexed & Refereed Research Journal, ISSN 0974-2832, (Print), E-ISSN- 2320-5474, July, 2013 VOL-V * ISSUE -54 1. Tiratha Ranjit (2002) 'Geography of India', Rawat Publications, Jaipur. 2. Singh R.L. (ed.), India: Regional Geography, Varanasi, 1971. 3. Muthian, S. et. al. (ed.) A Social and Economic Atlas of India, New Delhi, 1987. 4. Chanda Publication R.C. (2002), Geography of Population, Kalyani Publications, Ludhiana. 5. Husain Majid (2008) Geography of India, Jamia Millia University, New Delhi. 6. Census of India, 2001. R E F E R E N C E TheinfluenceofClimate:- Climate is the most important factor underly- ing the marked contrasts in the density of population in different parts of the world. Climate also influences manindirectly. Temperature:- Among the ecological factor, influencing the distribution of population. A climate having suitable temperature has an invigorating influence upon the efficiencyofmanbothmentaland physical.Thedistri- bution of population and quality of population of the temperate regions of the world has much co-relation with the prevailing temperature. Rainfall:- The average rainfall in India with relation to population distribution. The relation between the amount of rainfall and population in general is univer- sal. Excessive and lowrainfall may discourage human settlement. TheinfluenceofLandforms:- Landforms also affects the distribution of population. Mountains, deserts is also found low dis- tribution of population and plain landforms are also likely to play a significant role in the distribution of population. The influence ofSoils:- Thefertilityofsoilsinfluencethedistribution of population wherever the fertile soil exists the den- sity of population remains high. Minerals:- In areas where the minerals occur in great quality, industries grow the attract the labours form other areas and consequently the distribution of popu- lation becomes very high. Rivers:- In areas where the rivers deposit fertile soil every year, the agricultural density of population is high, because the "Fertility of the most productive section of the river calley. CulturalFactors:- Among the cultural factors which have been emphasized as having an important bearing an the distribution of population are the types of economic activitiesinwhichthepeopleareengaged.Thosefactors affecting the distribution of population include the methods of agriculture and techniques of irrigation and transport facilities and their formor social organi- zation. DemographicFactors:- Demographic factors,including thebirth and death rates of the various areas and the currents of migration changes in the distribution of population. Conclusion:- The population ofIndia is very unevenly dis- tributedoveritssurface.Accordingto thecensus2011, the most populated state in India is Uttar Pradesh with populationof19.9croreswhiletotalareaofUttarPradesh is 7.26%. The least populated state in the country is Sikkim with a population of 6.07 lakh. Area wise Rajasthan and Madhya Pradesh are two big states. Area in these states is 10.4% and 9.37% while popula- tion is 5.6% and 6% only. The Indo-Gangetic Brahmaputra Plains and the Eastern and Western Coastal plains are densely populated areas. The distri- bution ofpopulationinfluenced byEcological factors, cultural factors and demographic factors.