Download to read offline

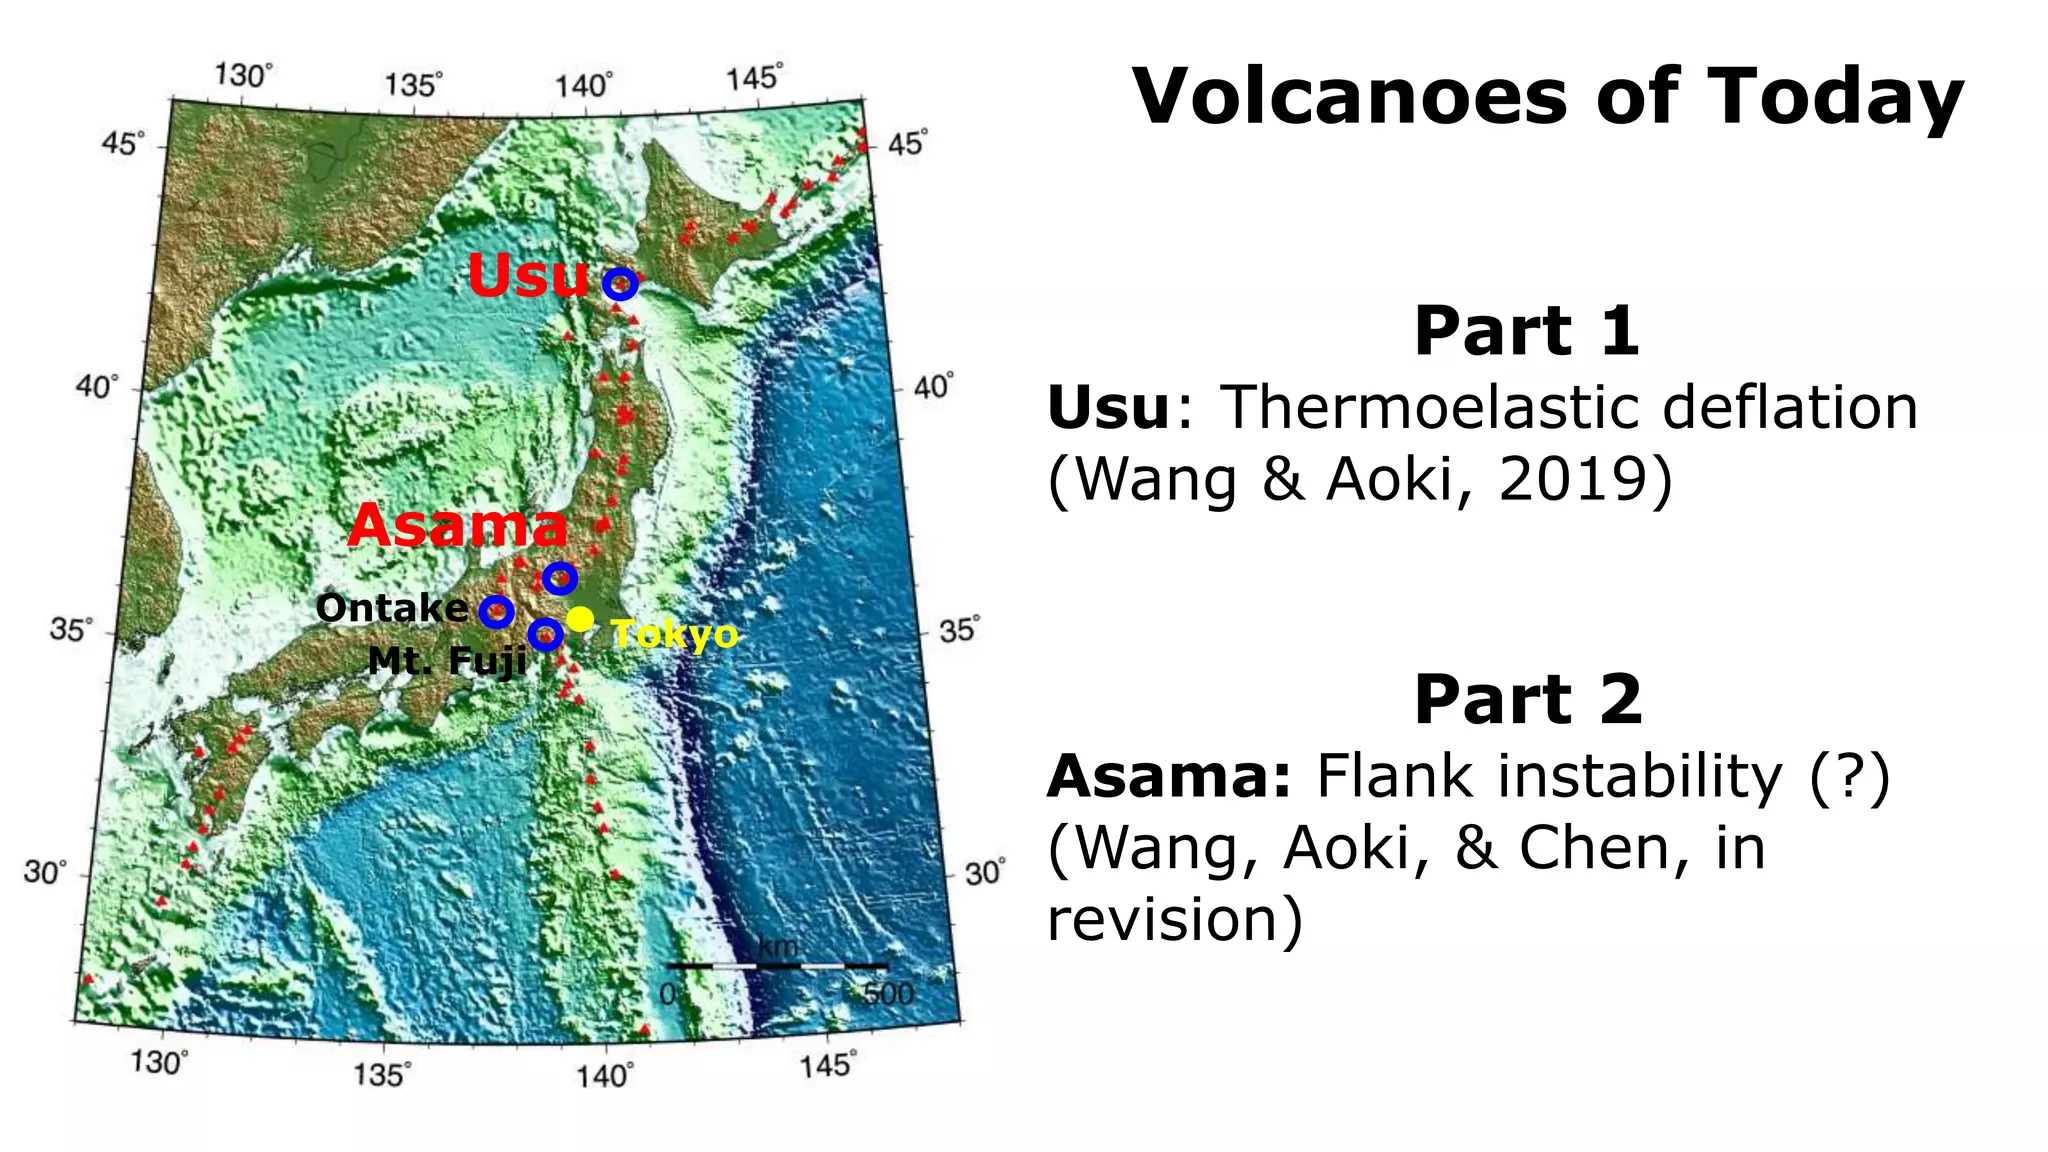


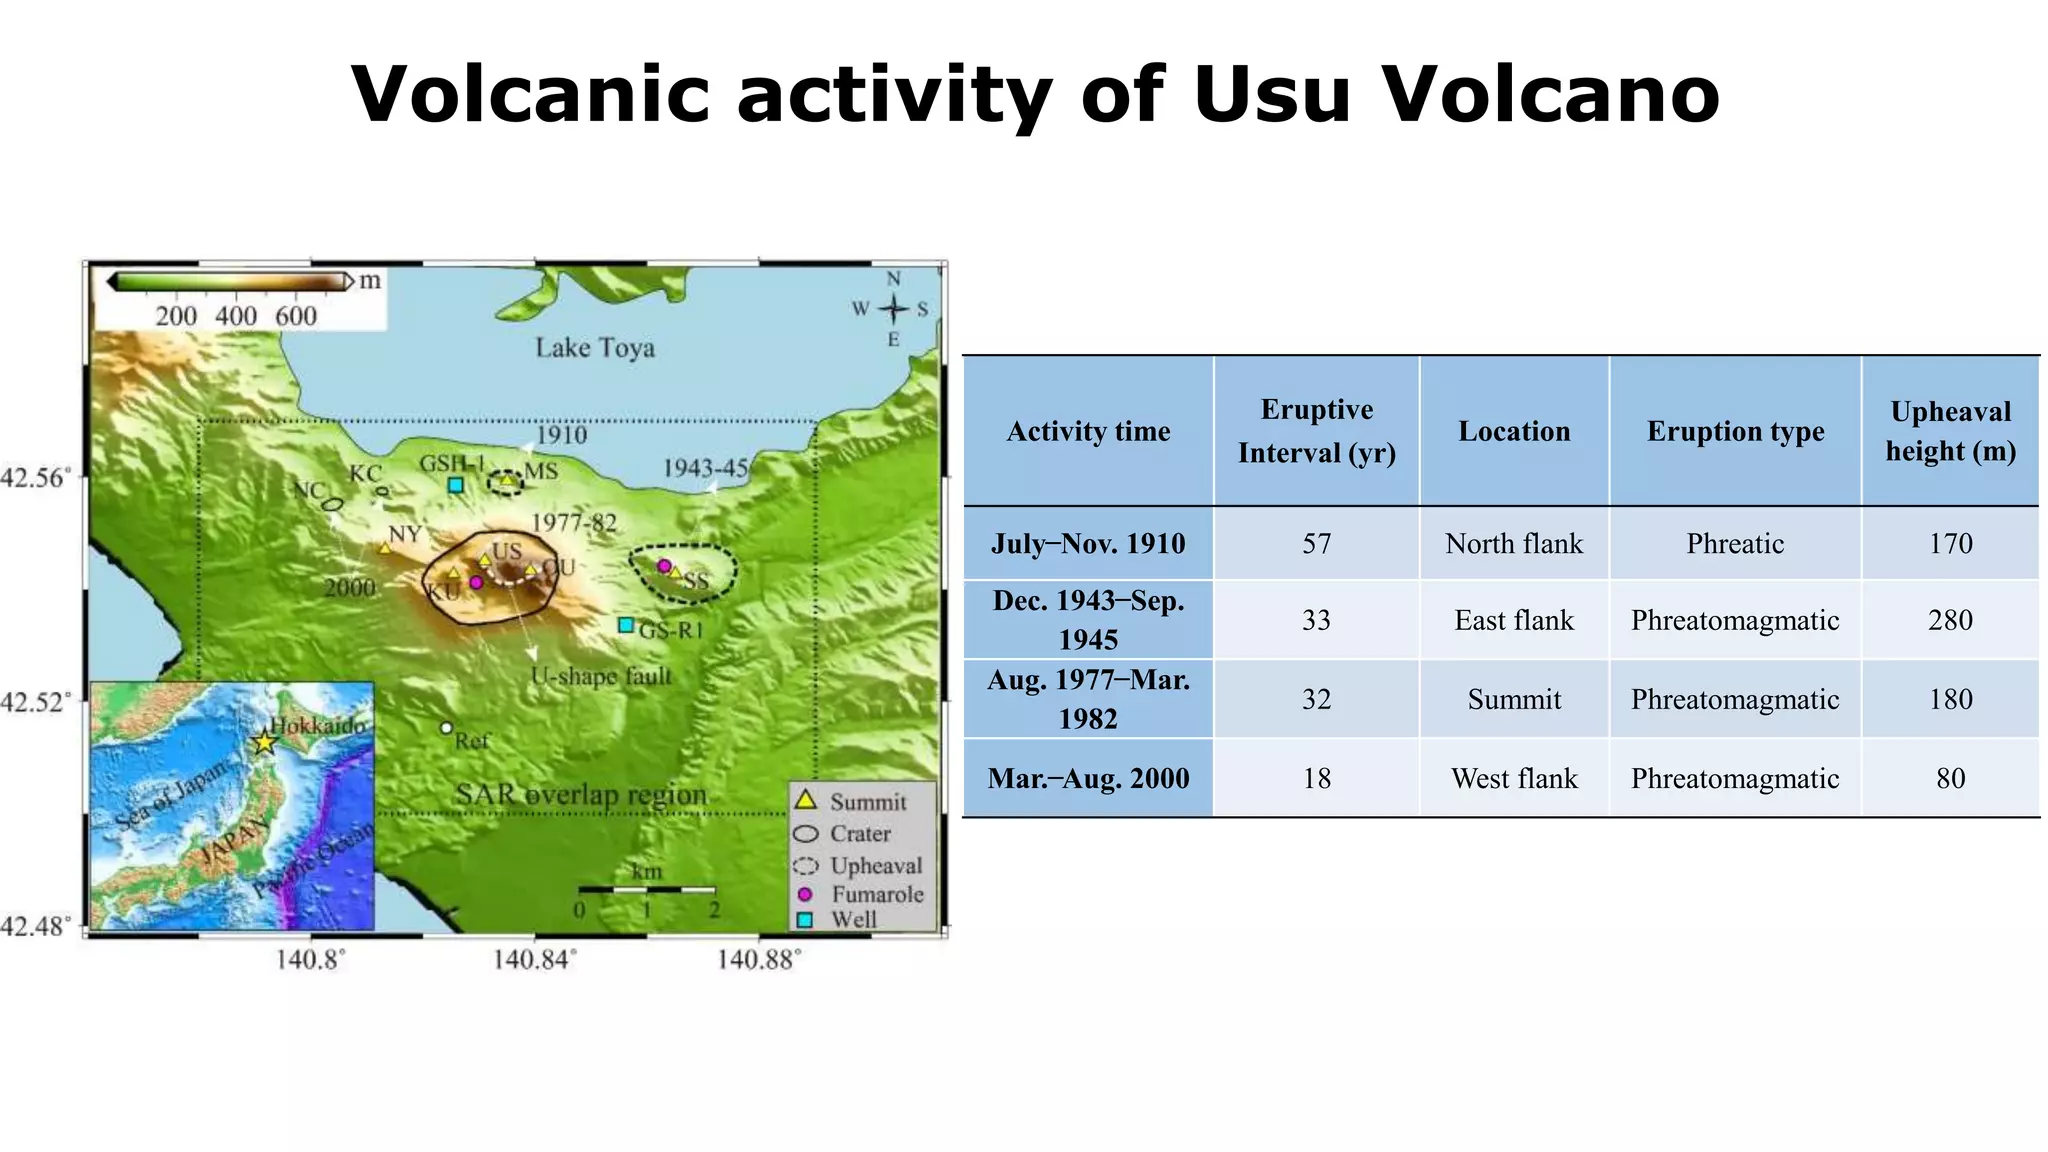
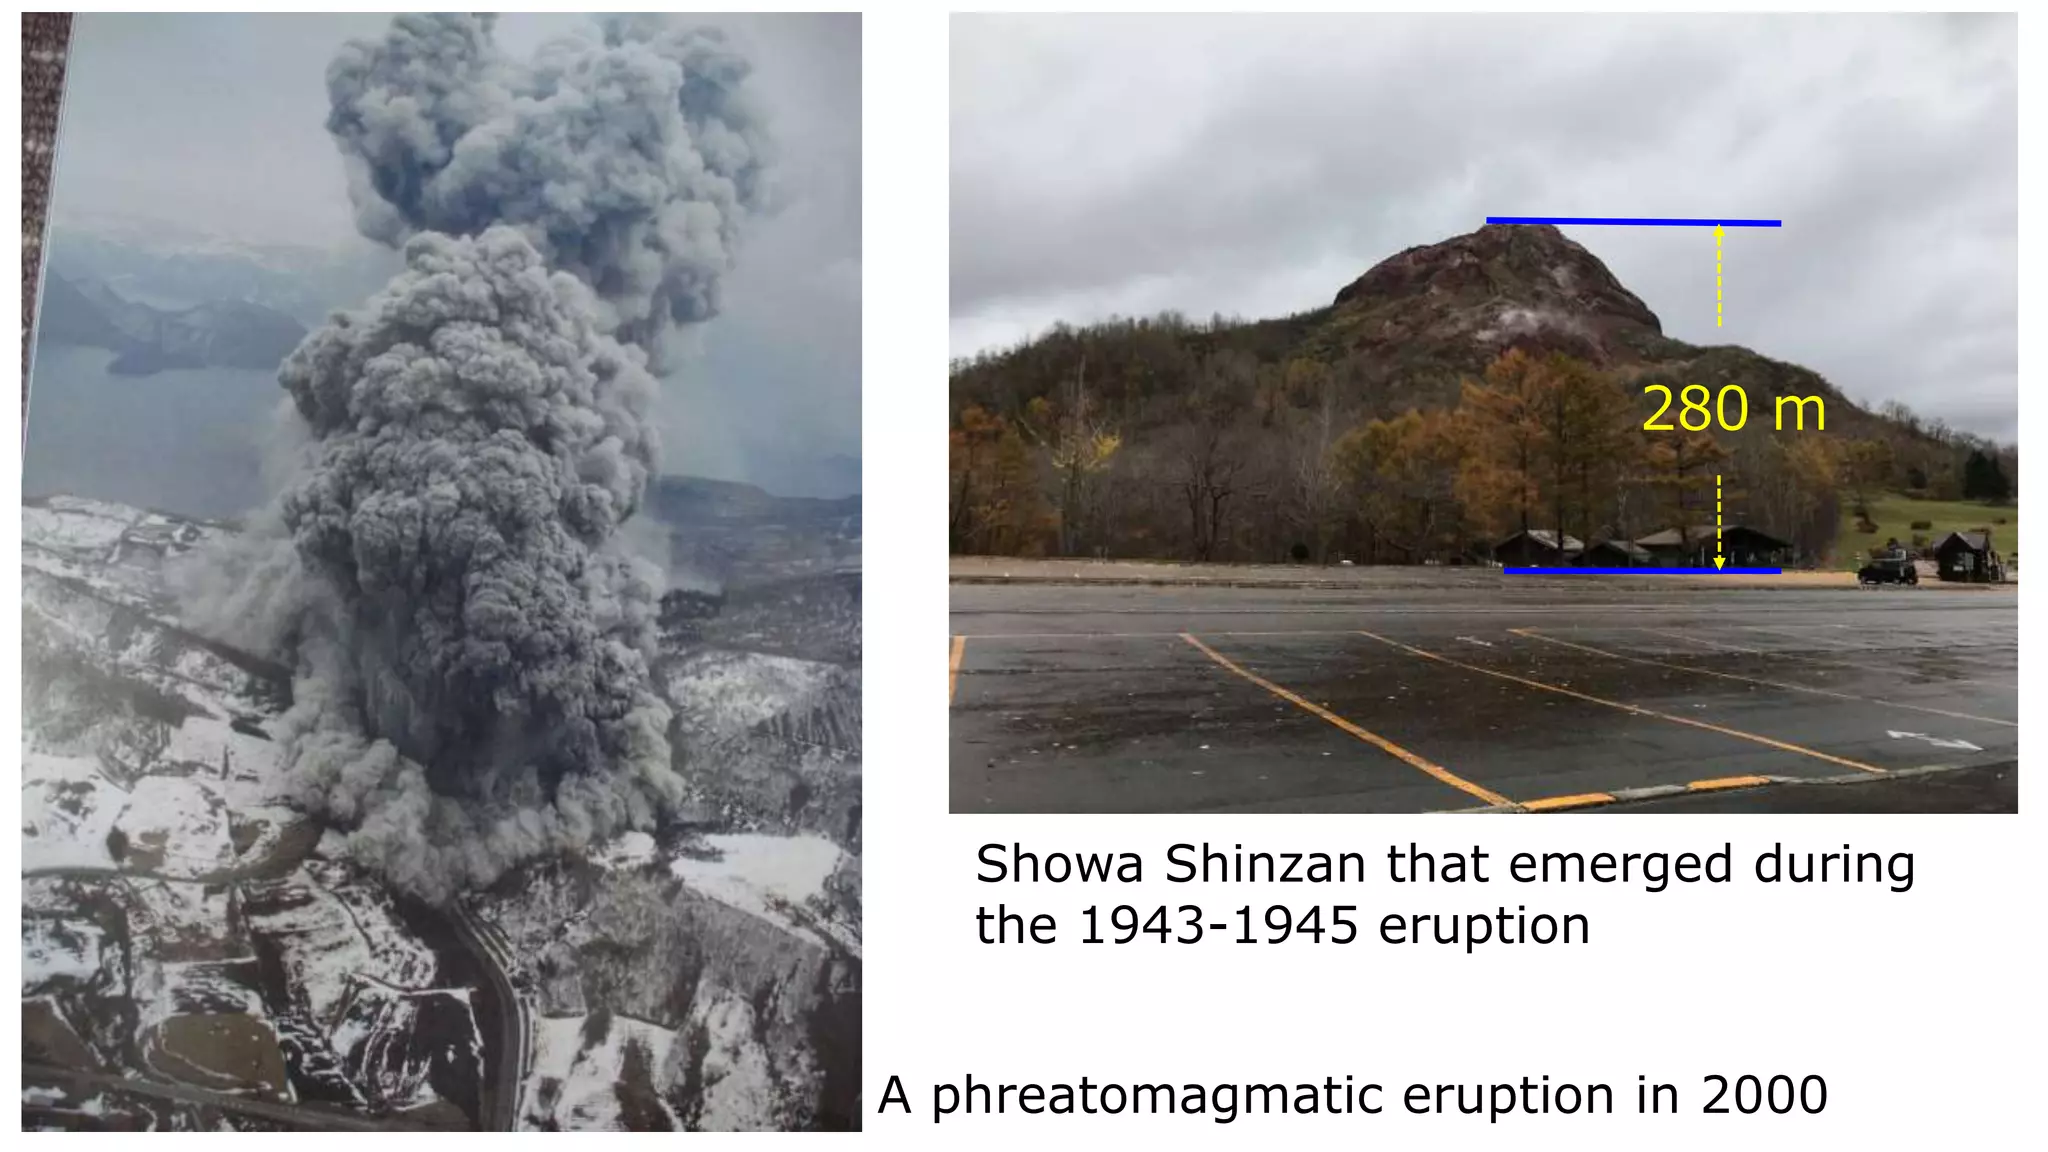

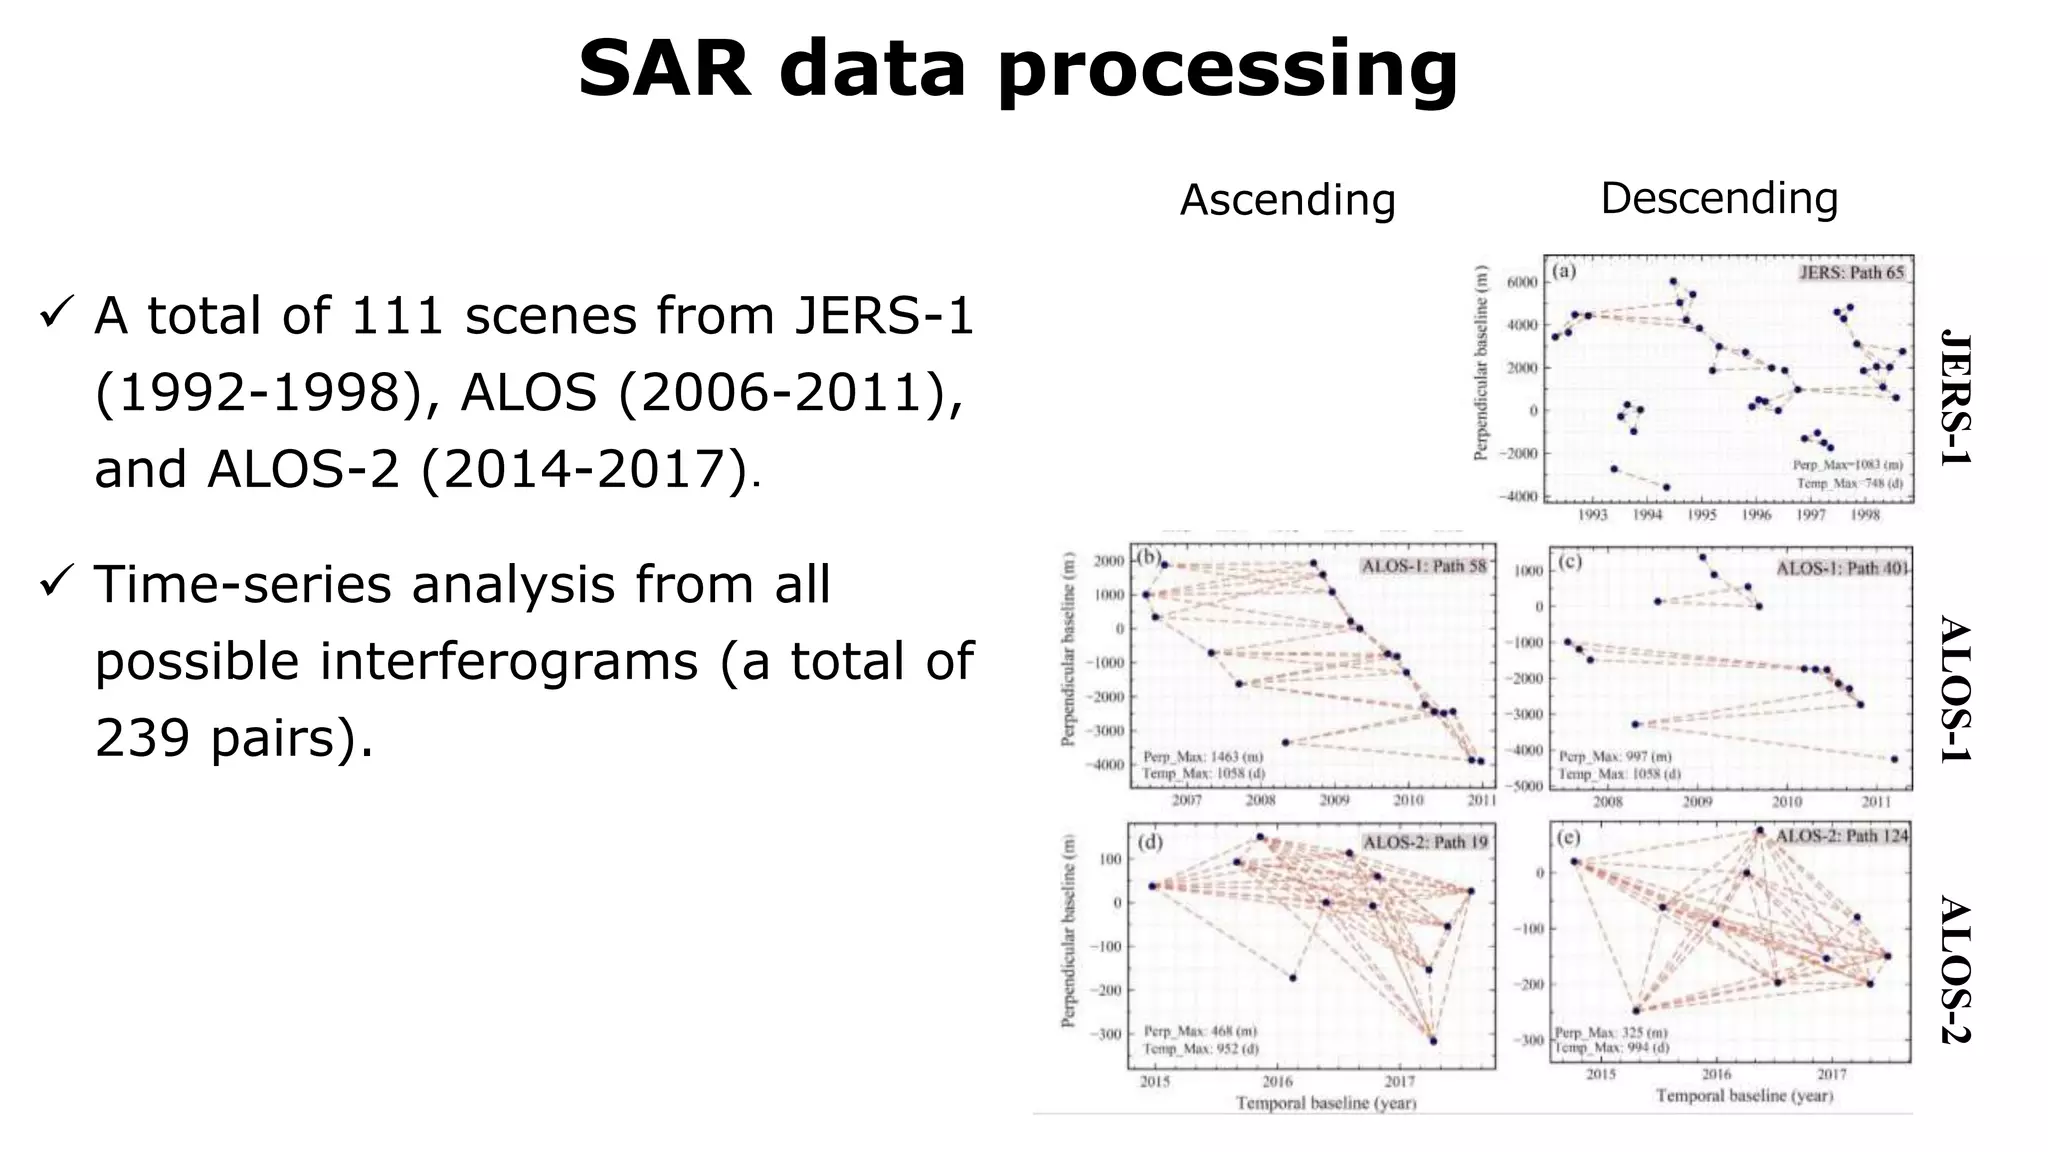
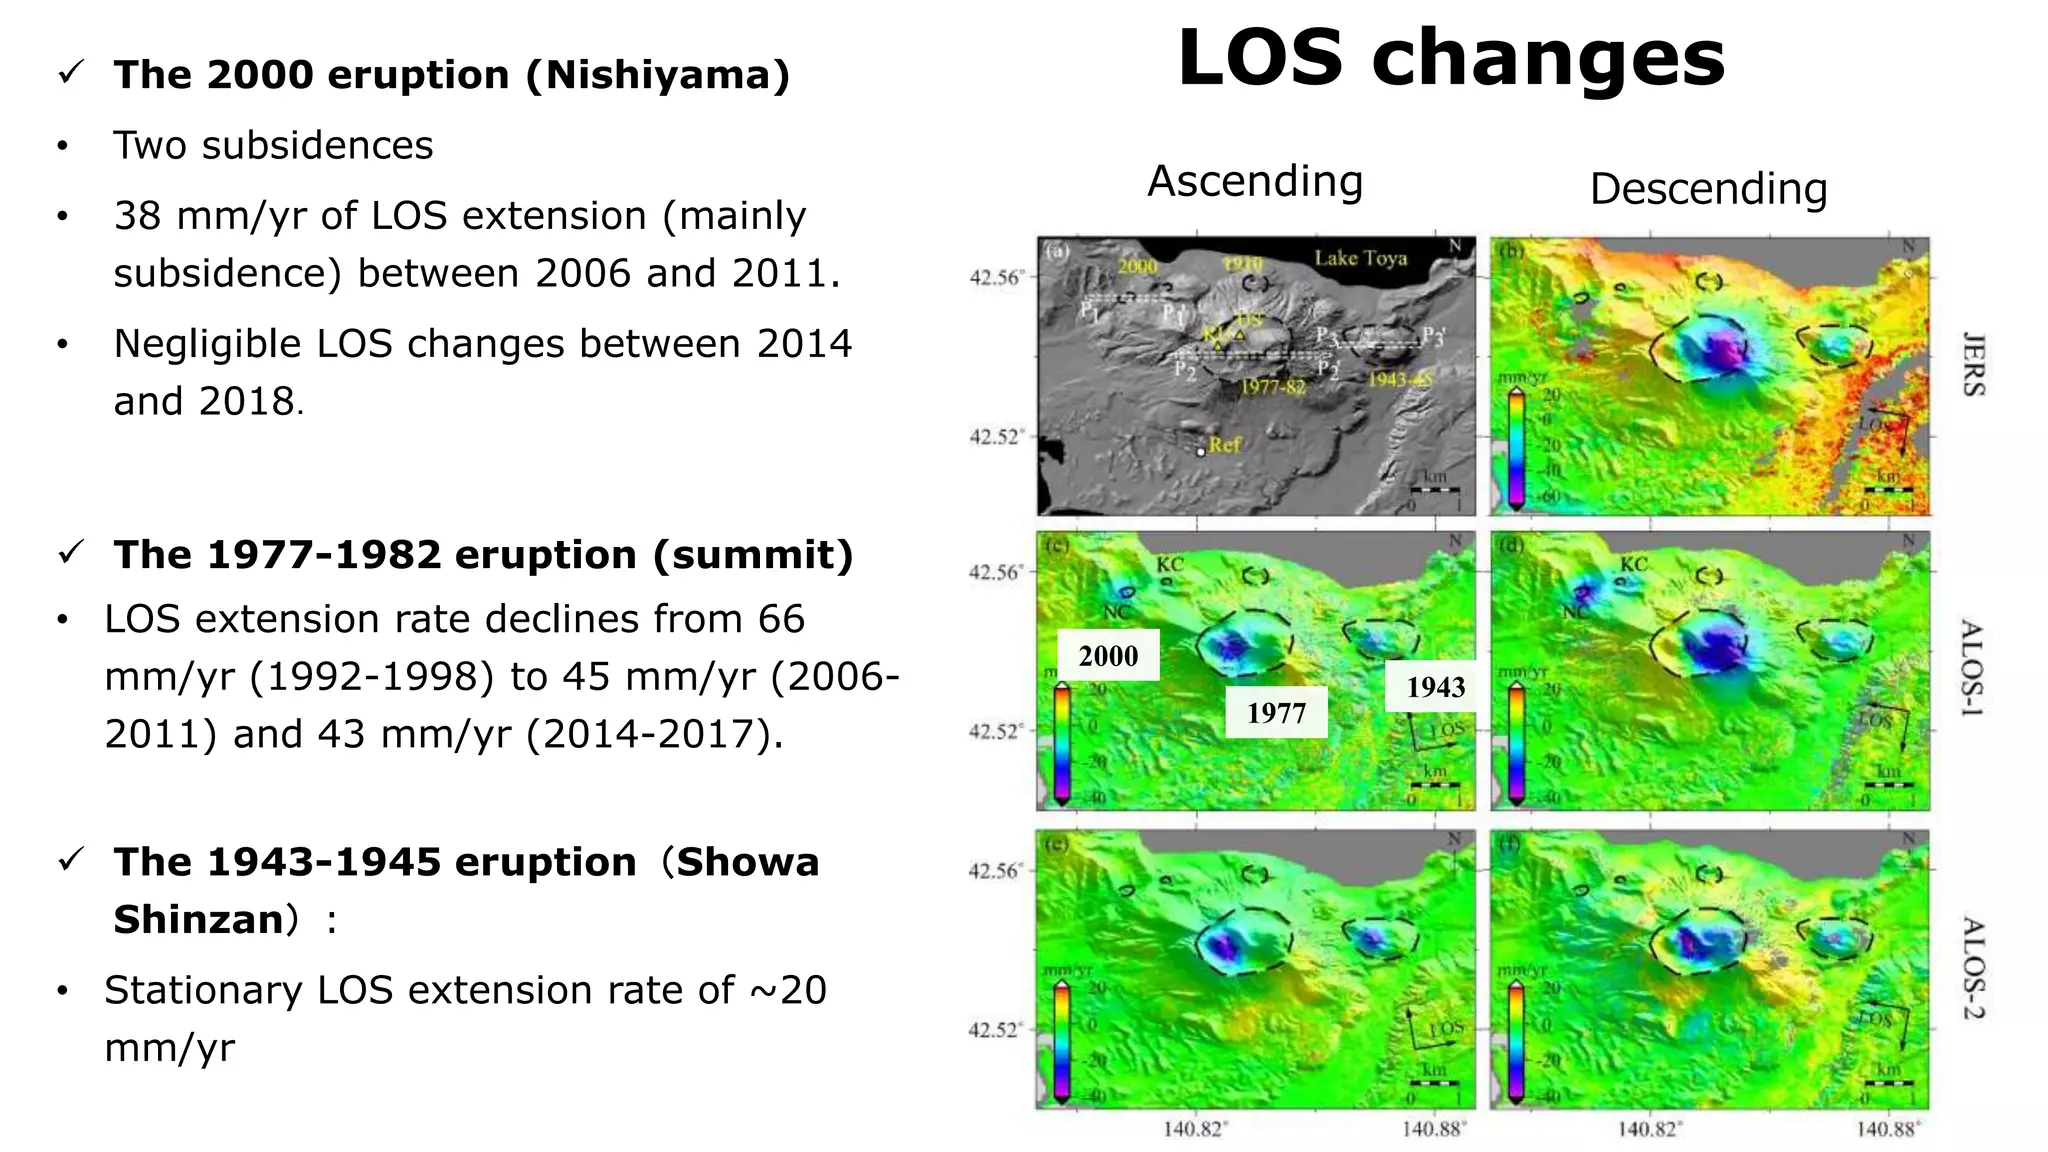

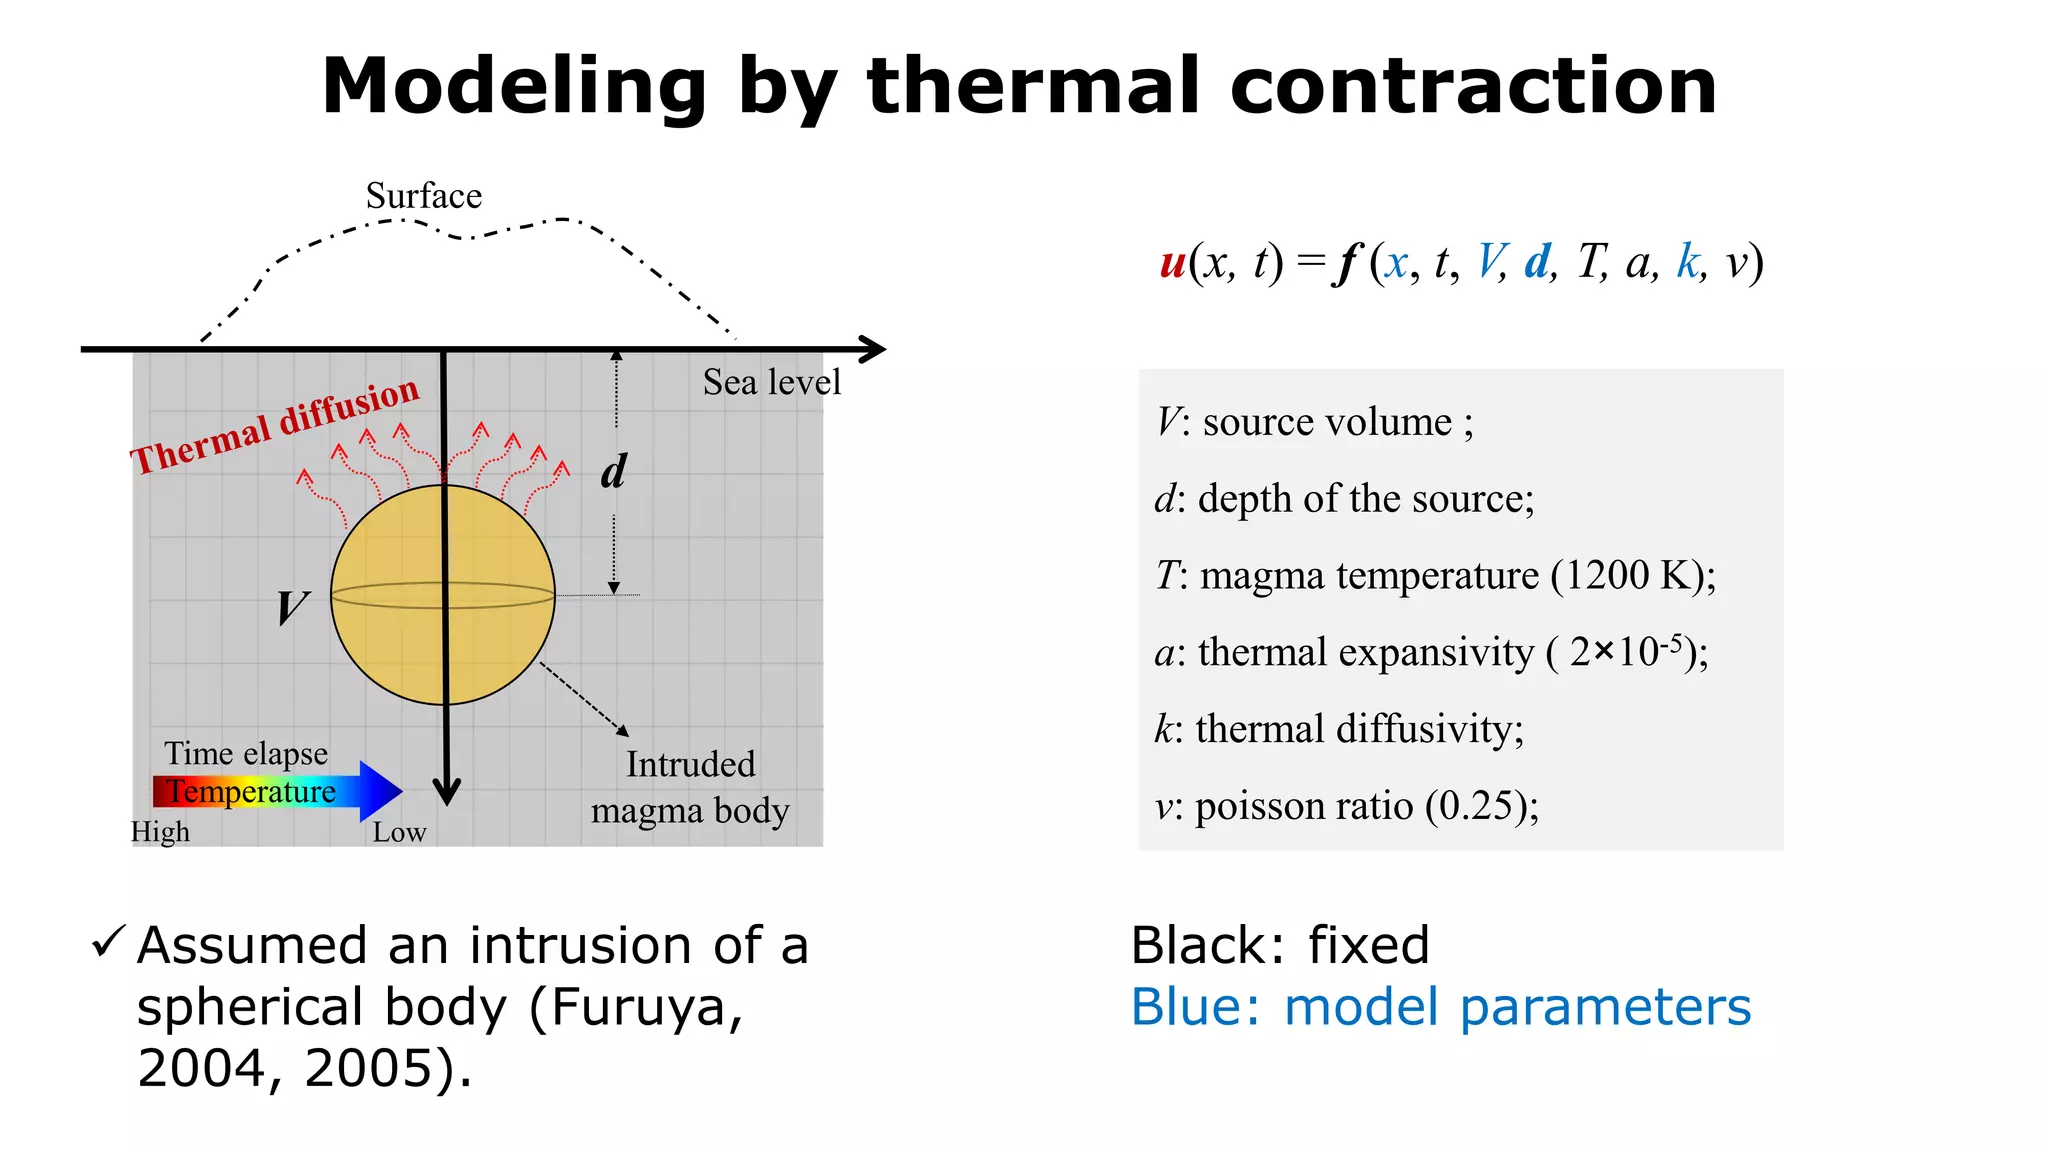

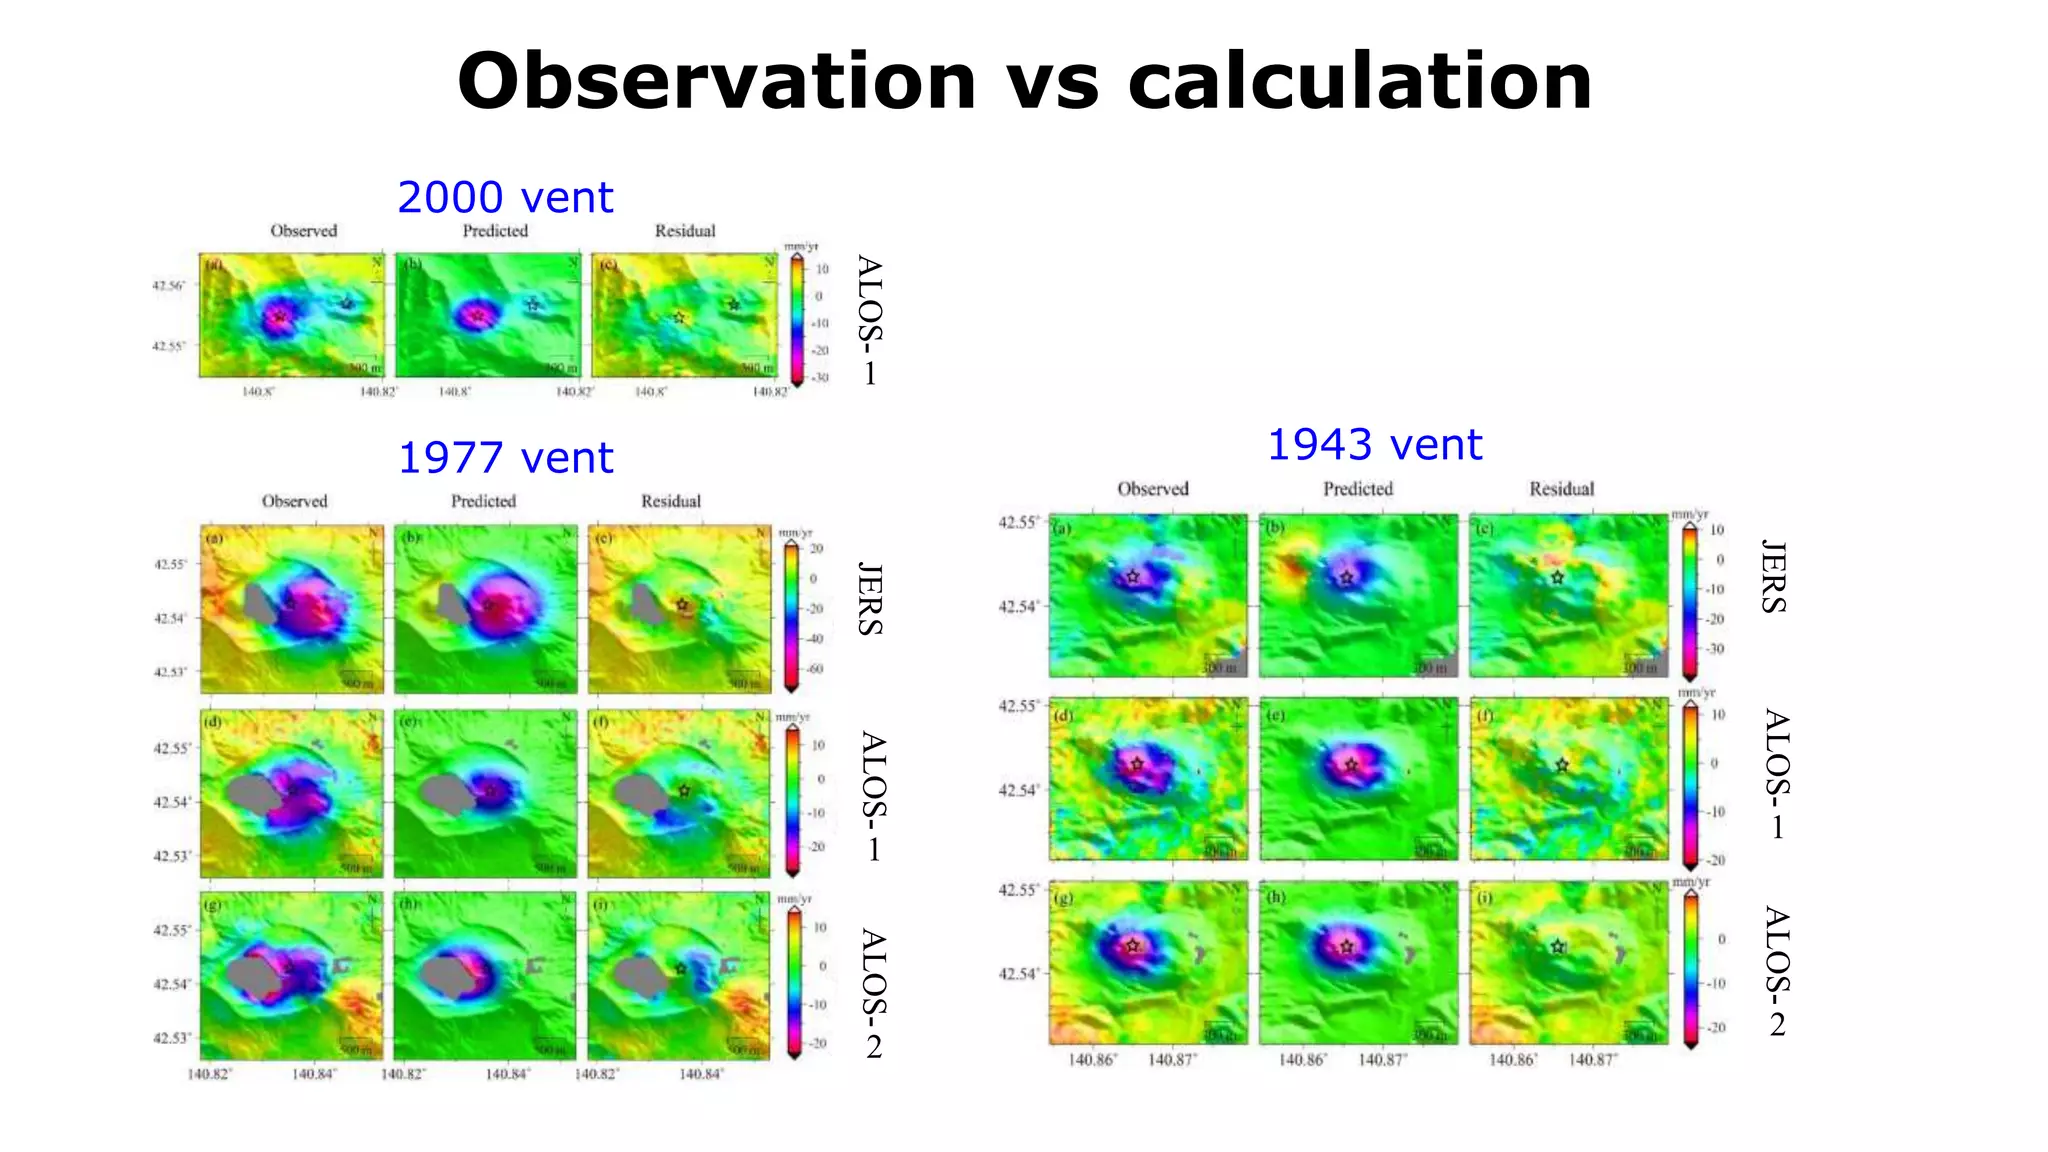
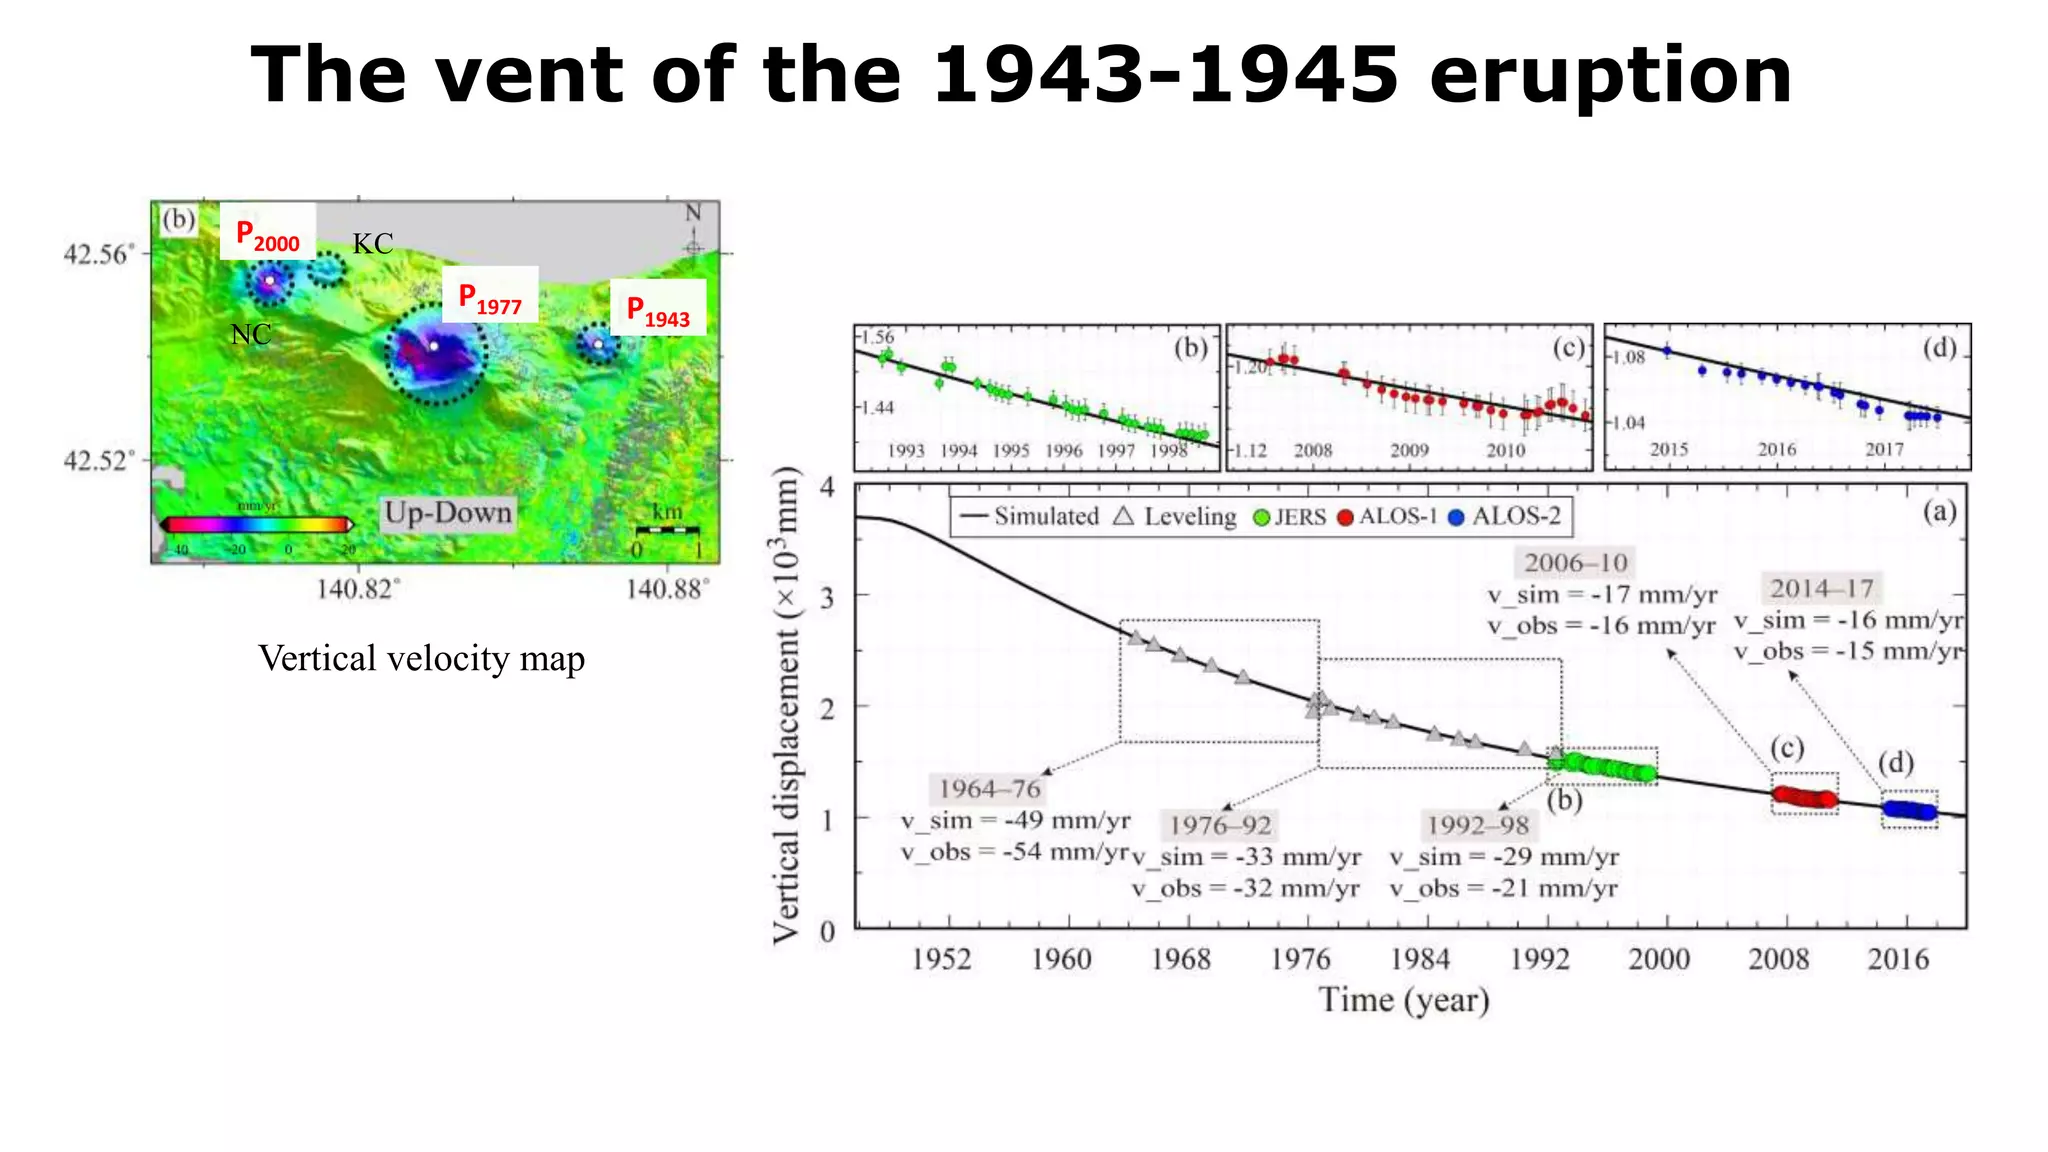
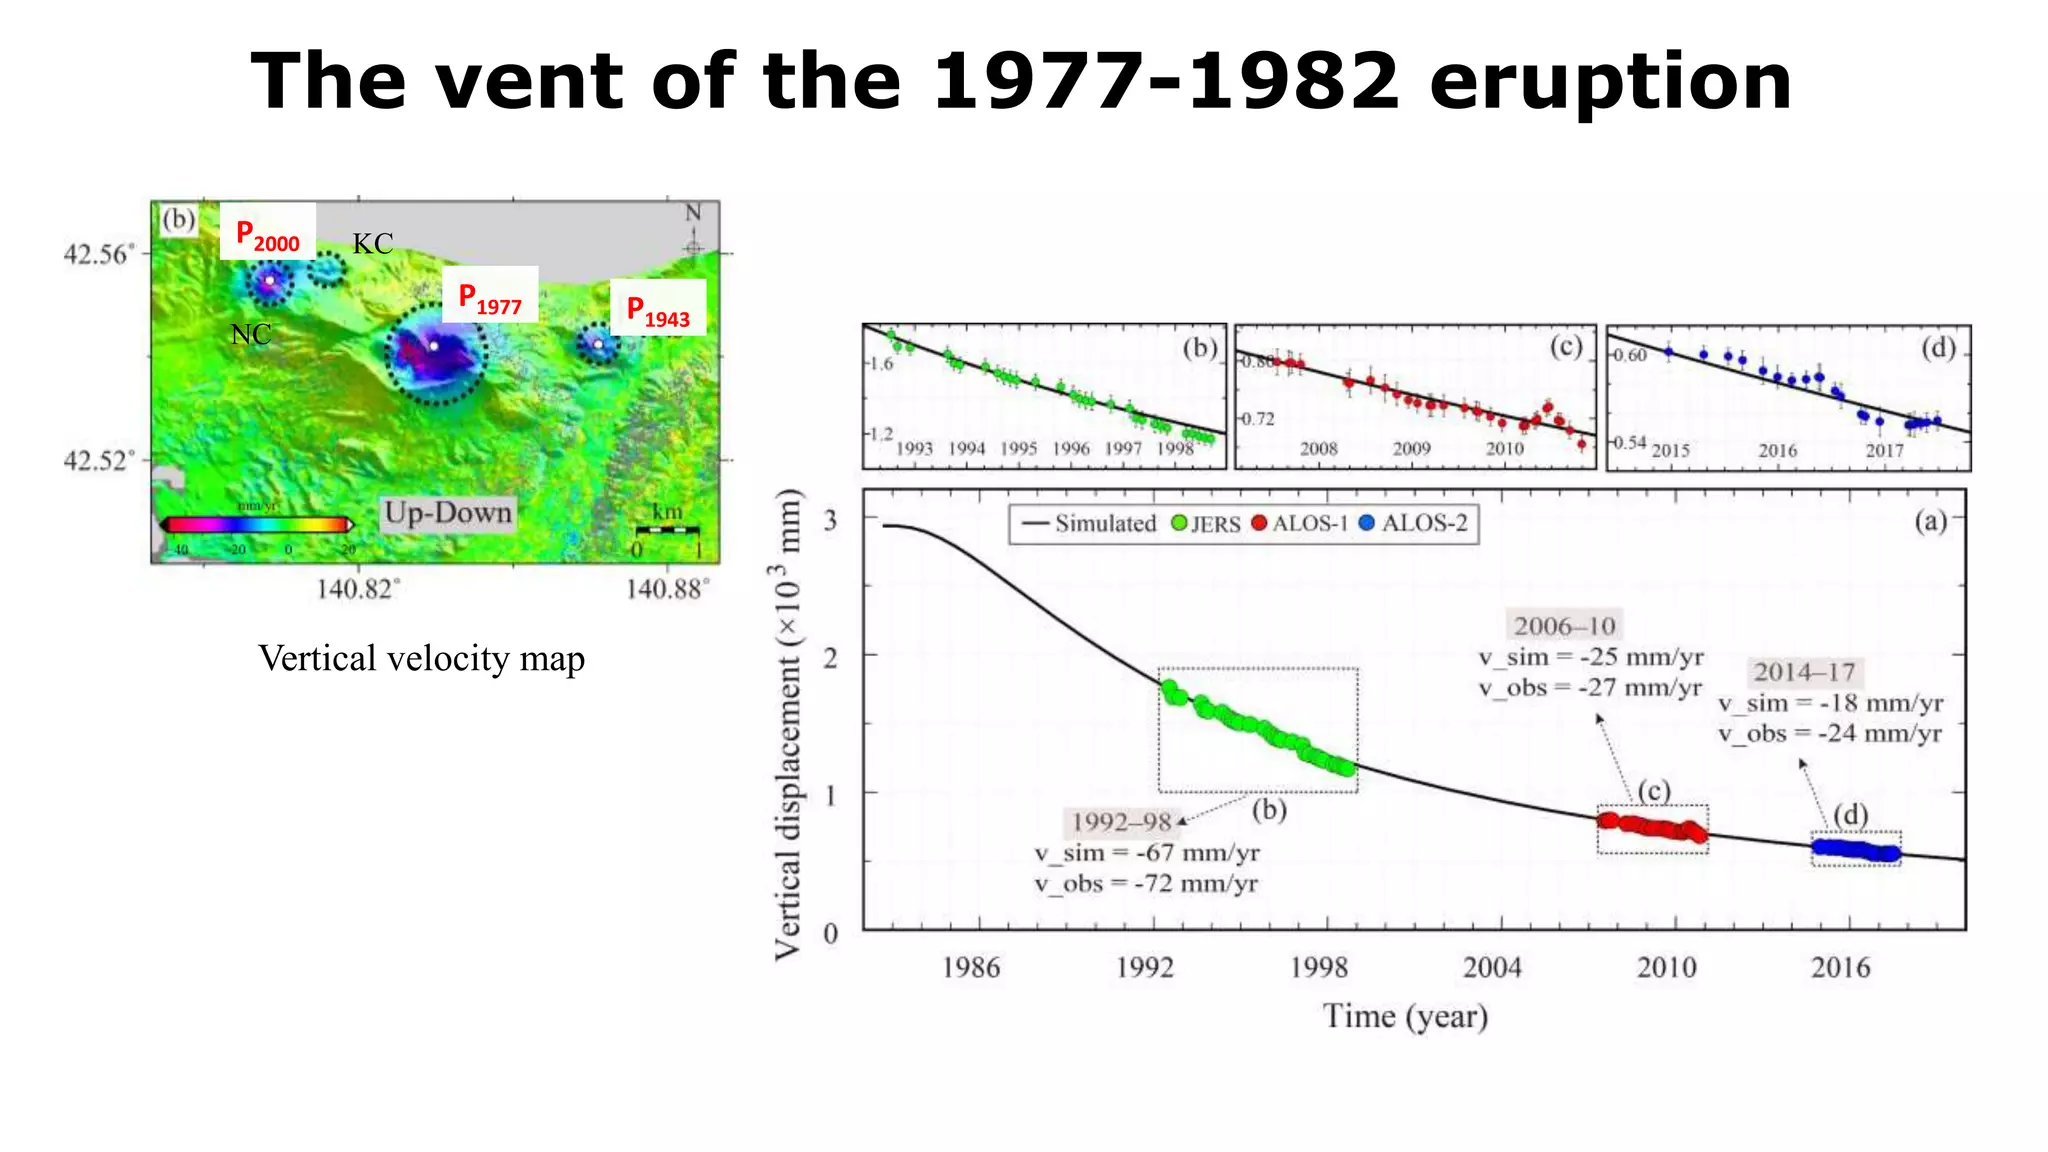
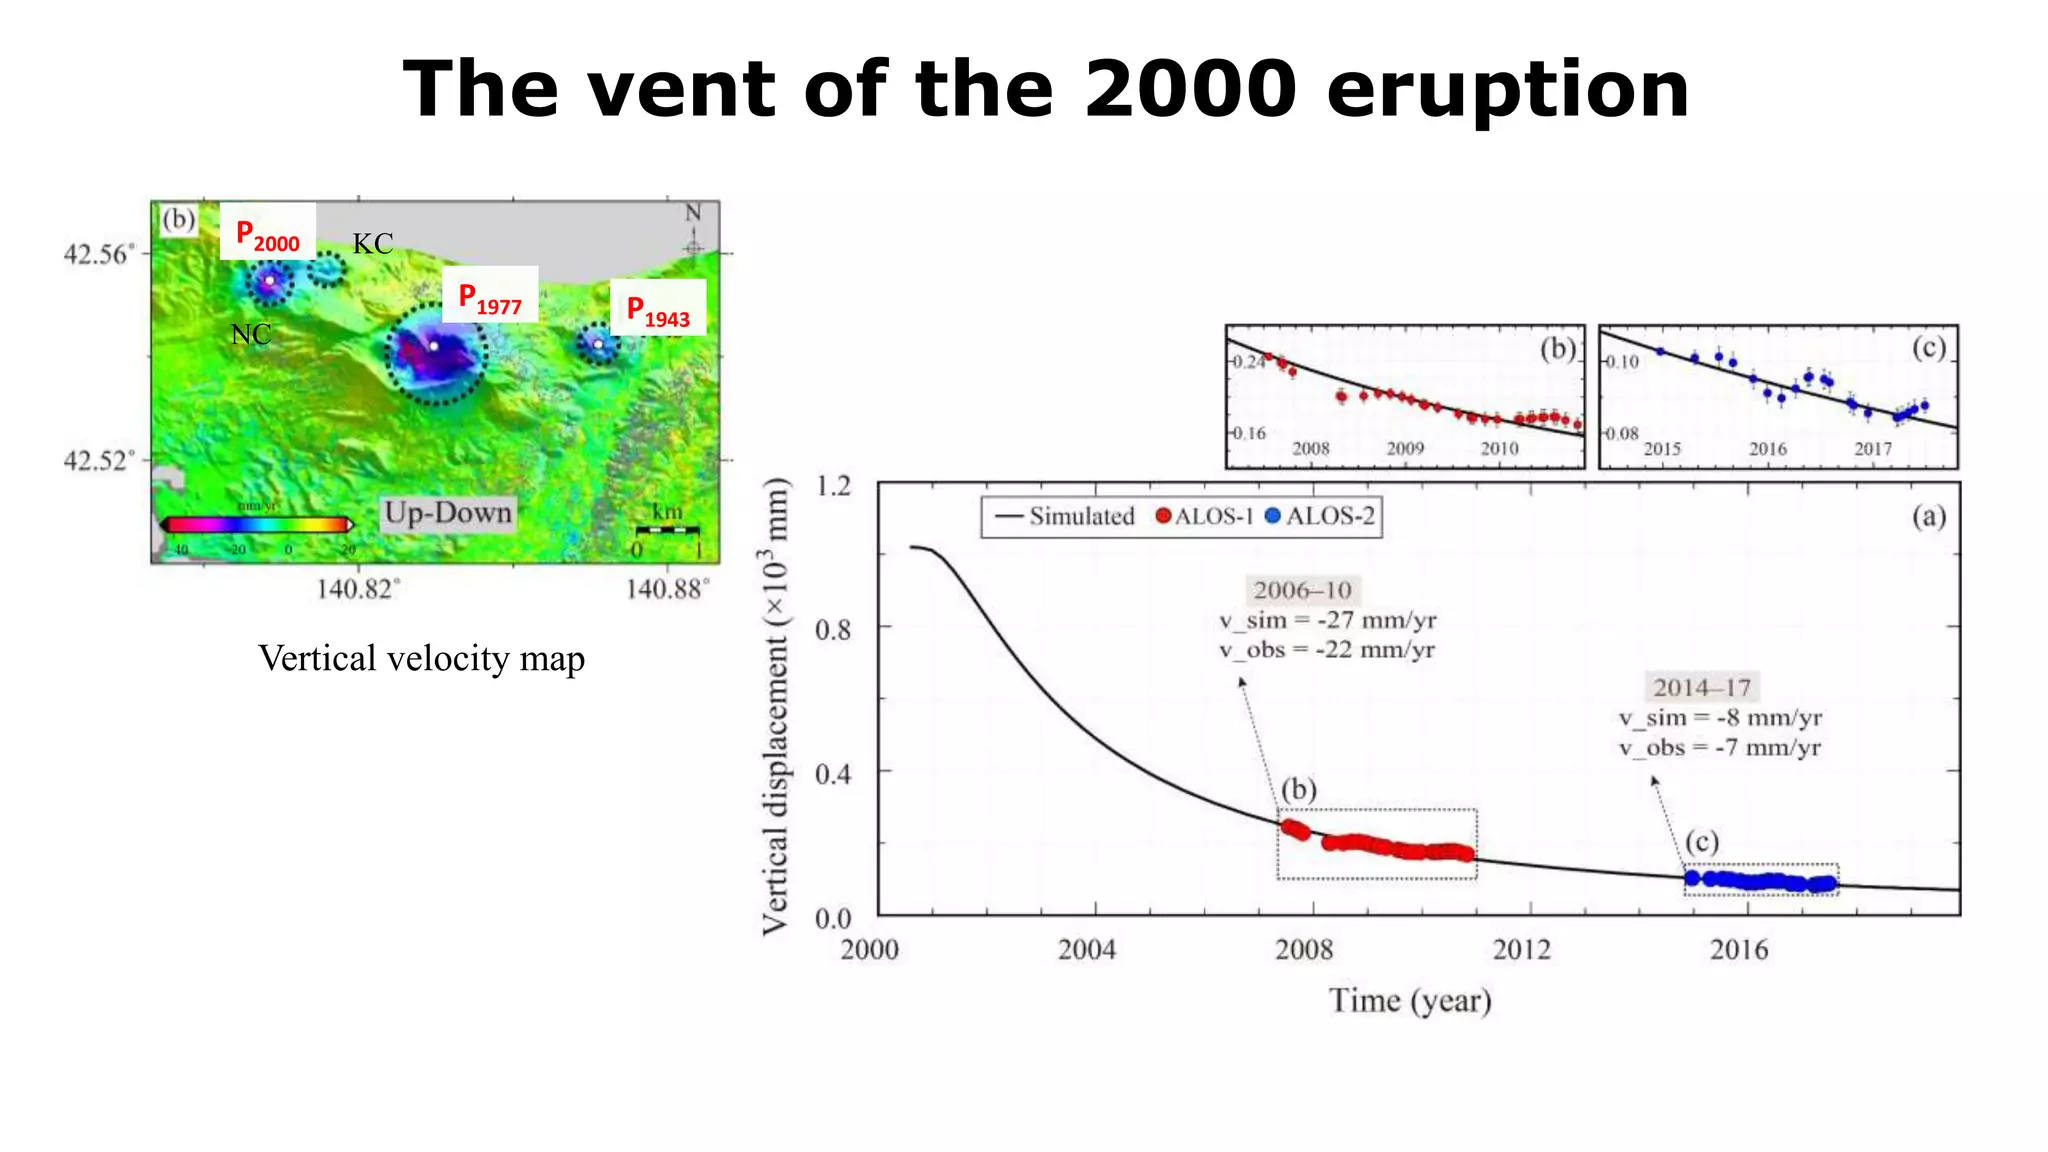


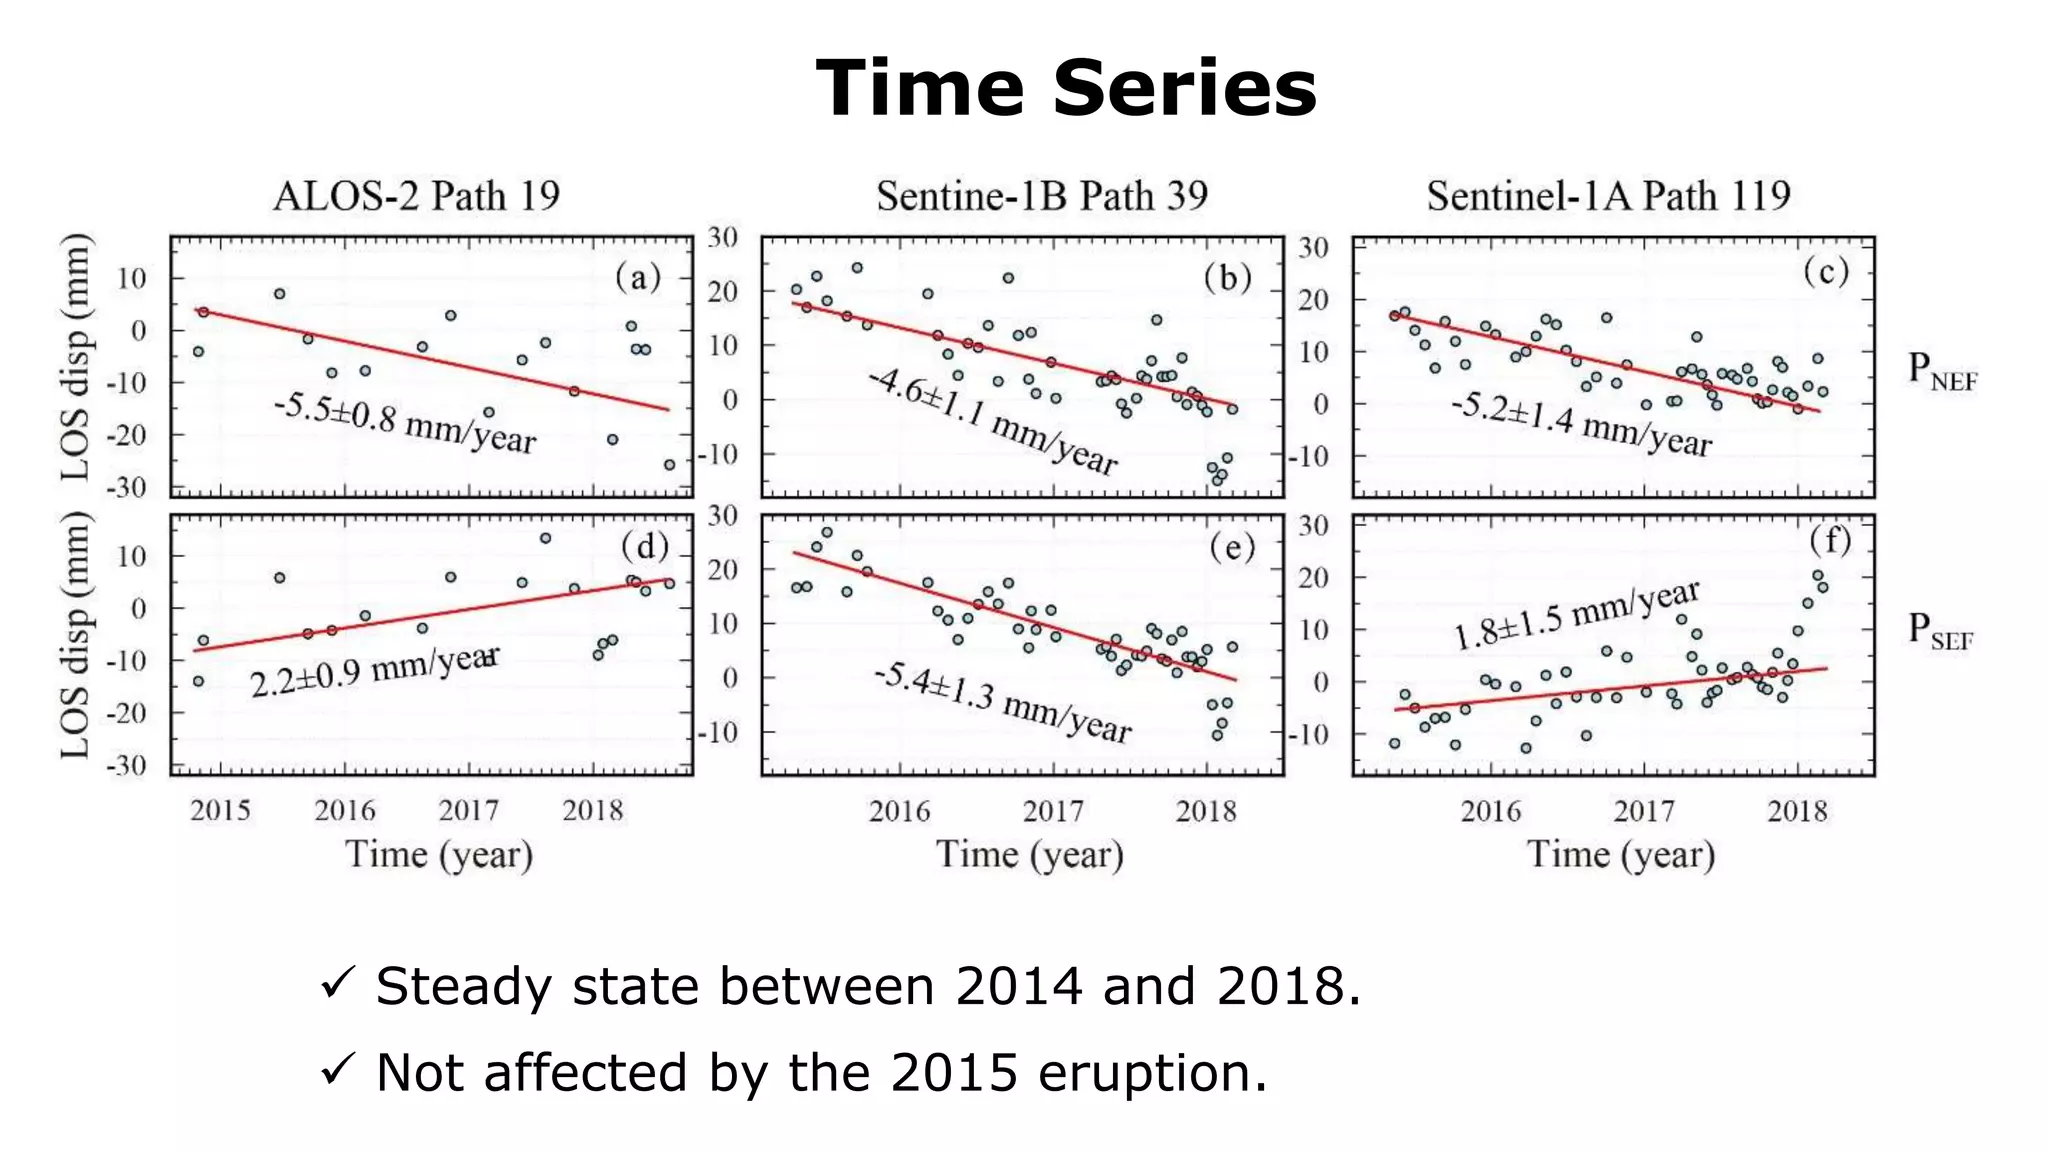
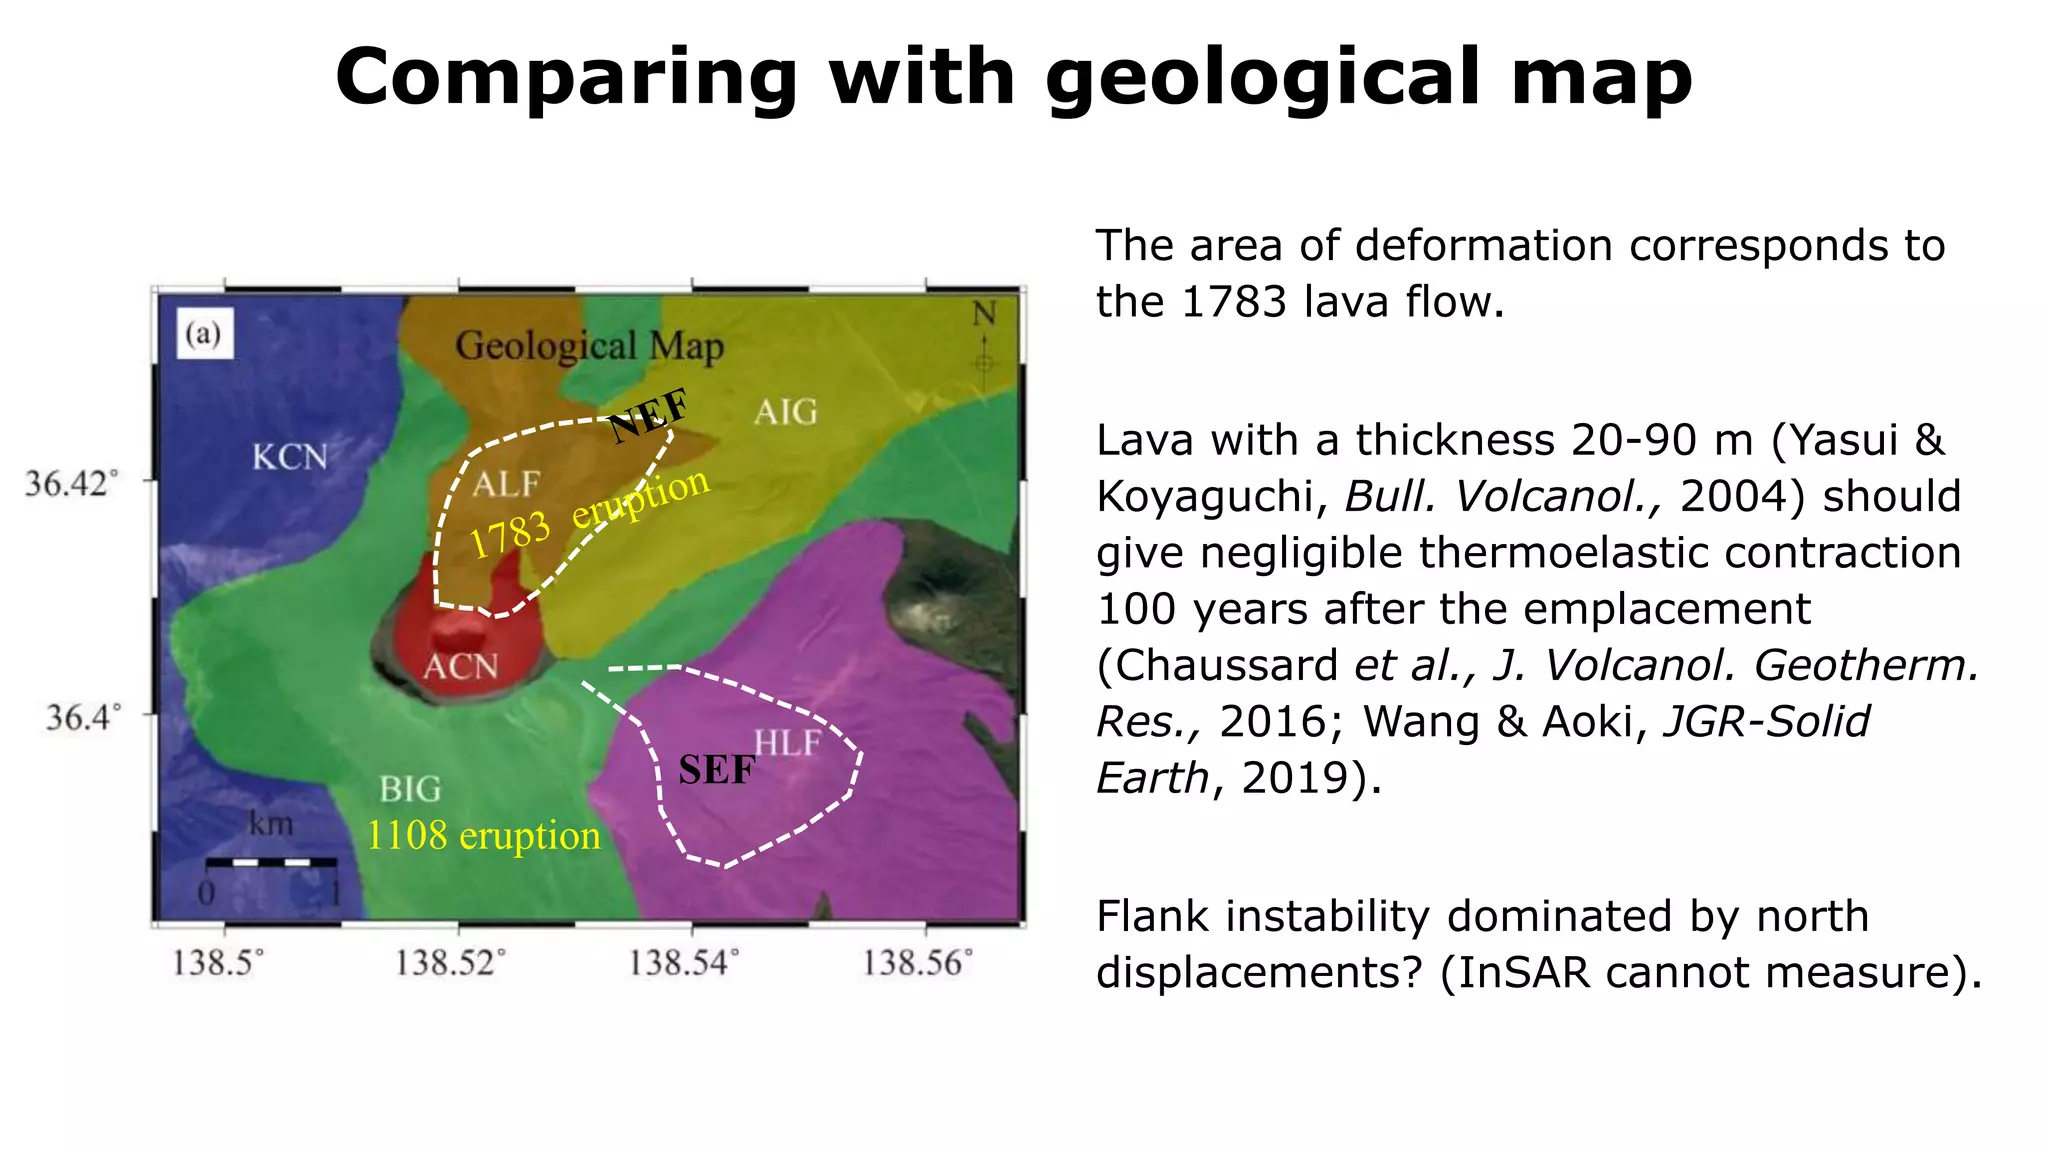


Small-scale deformation of active volcanoes was measured using synthetic aperture radar (SAR). SAR can detect deformation with high spatial resolution. At Usu volcano, deformation around past eruption sites was observed and explained by thermal contraction of intruded lava domes. Thermal modeling suggested hydrothermal circulation may enhance cooling. At Asama volcano, subsidence in the northeast flank and eastward motion in the southeast flank were observed between 2014-2018, possibly due to flank instability in the southeast. SAR provides insights into volcanic processes through measuring subtle surface deformation.


