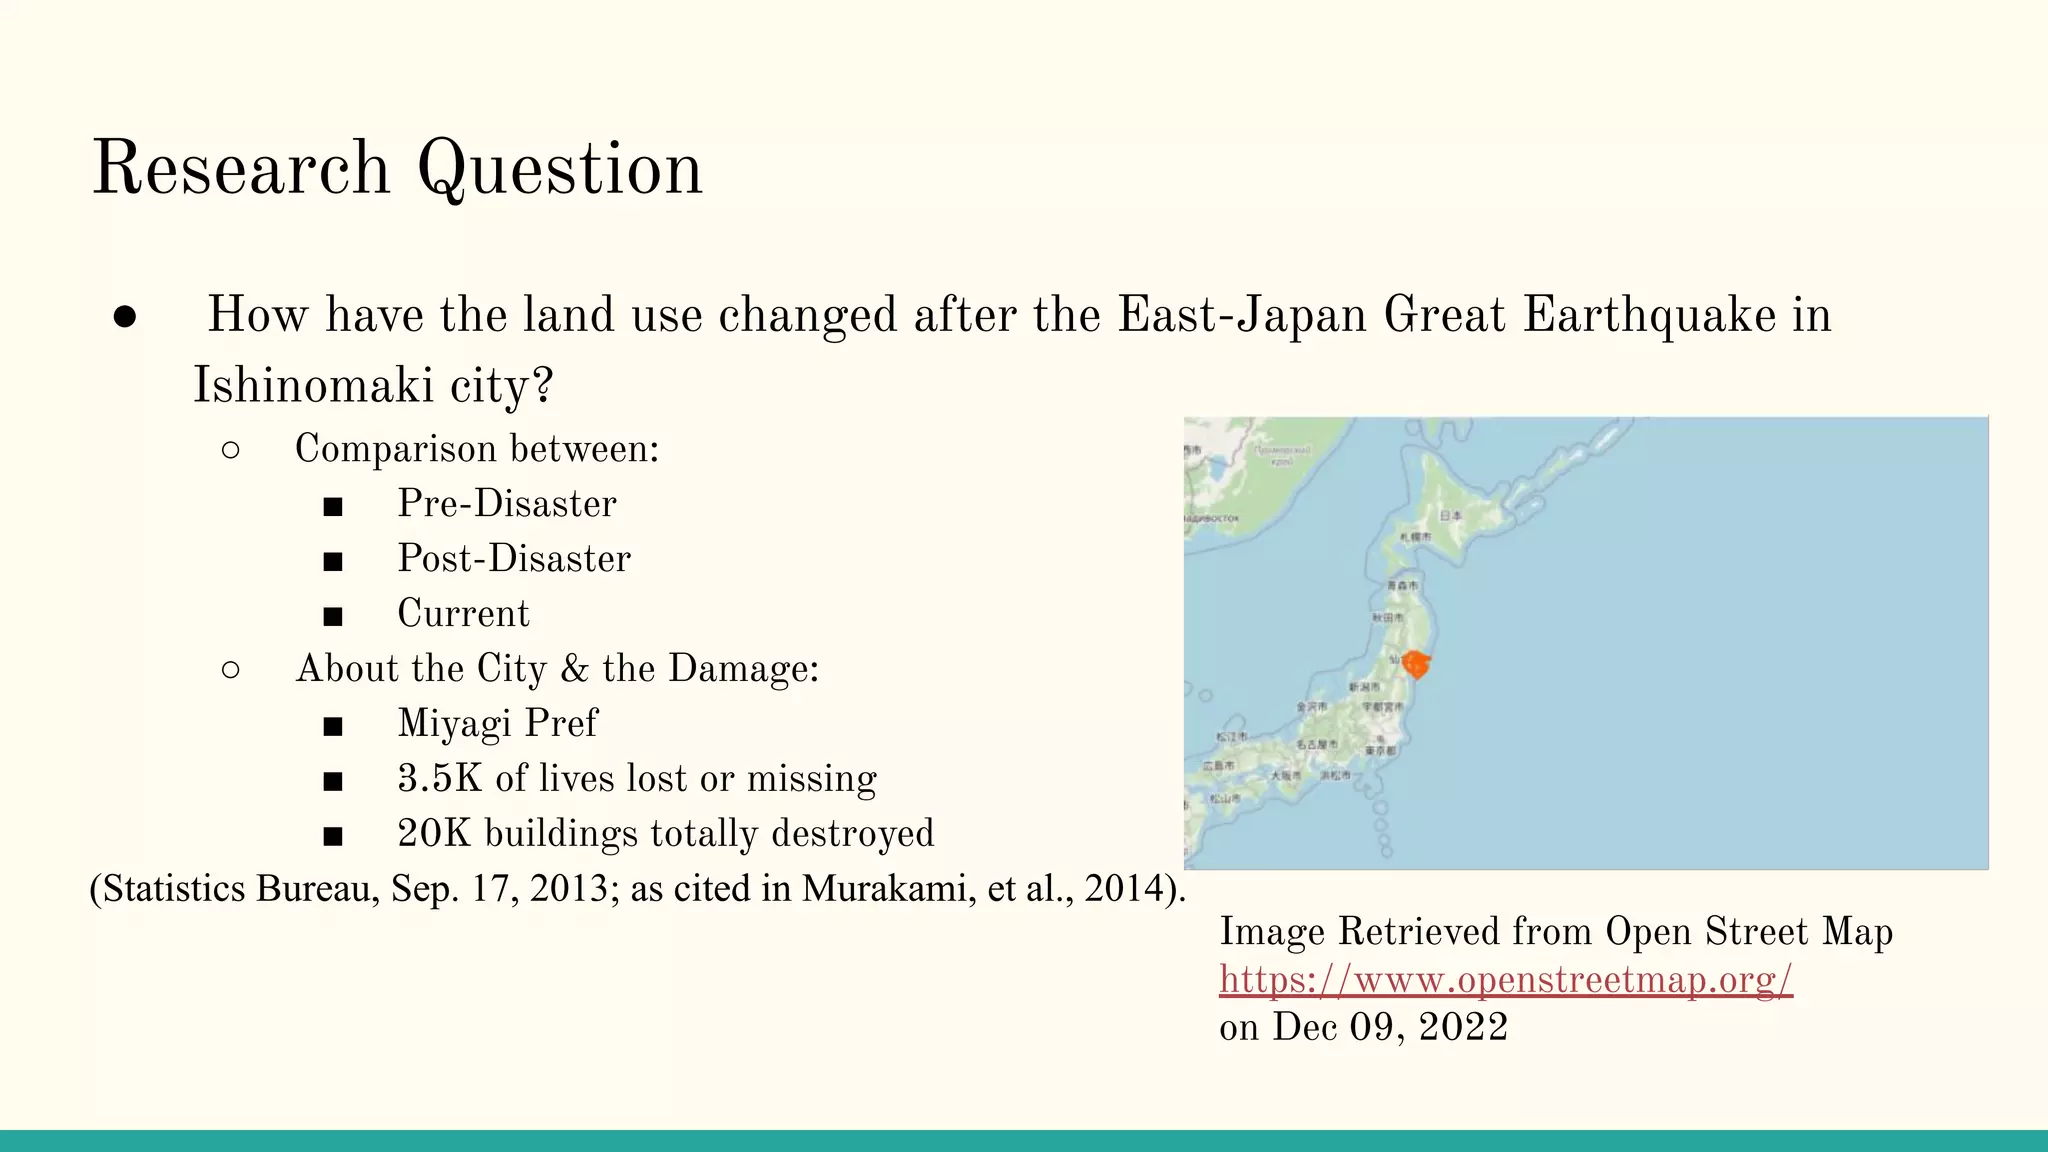
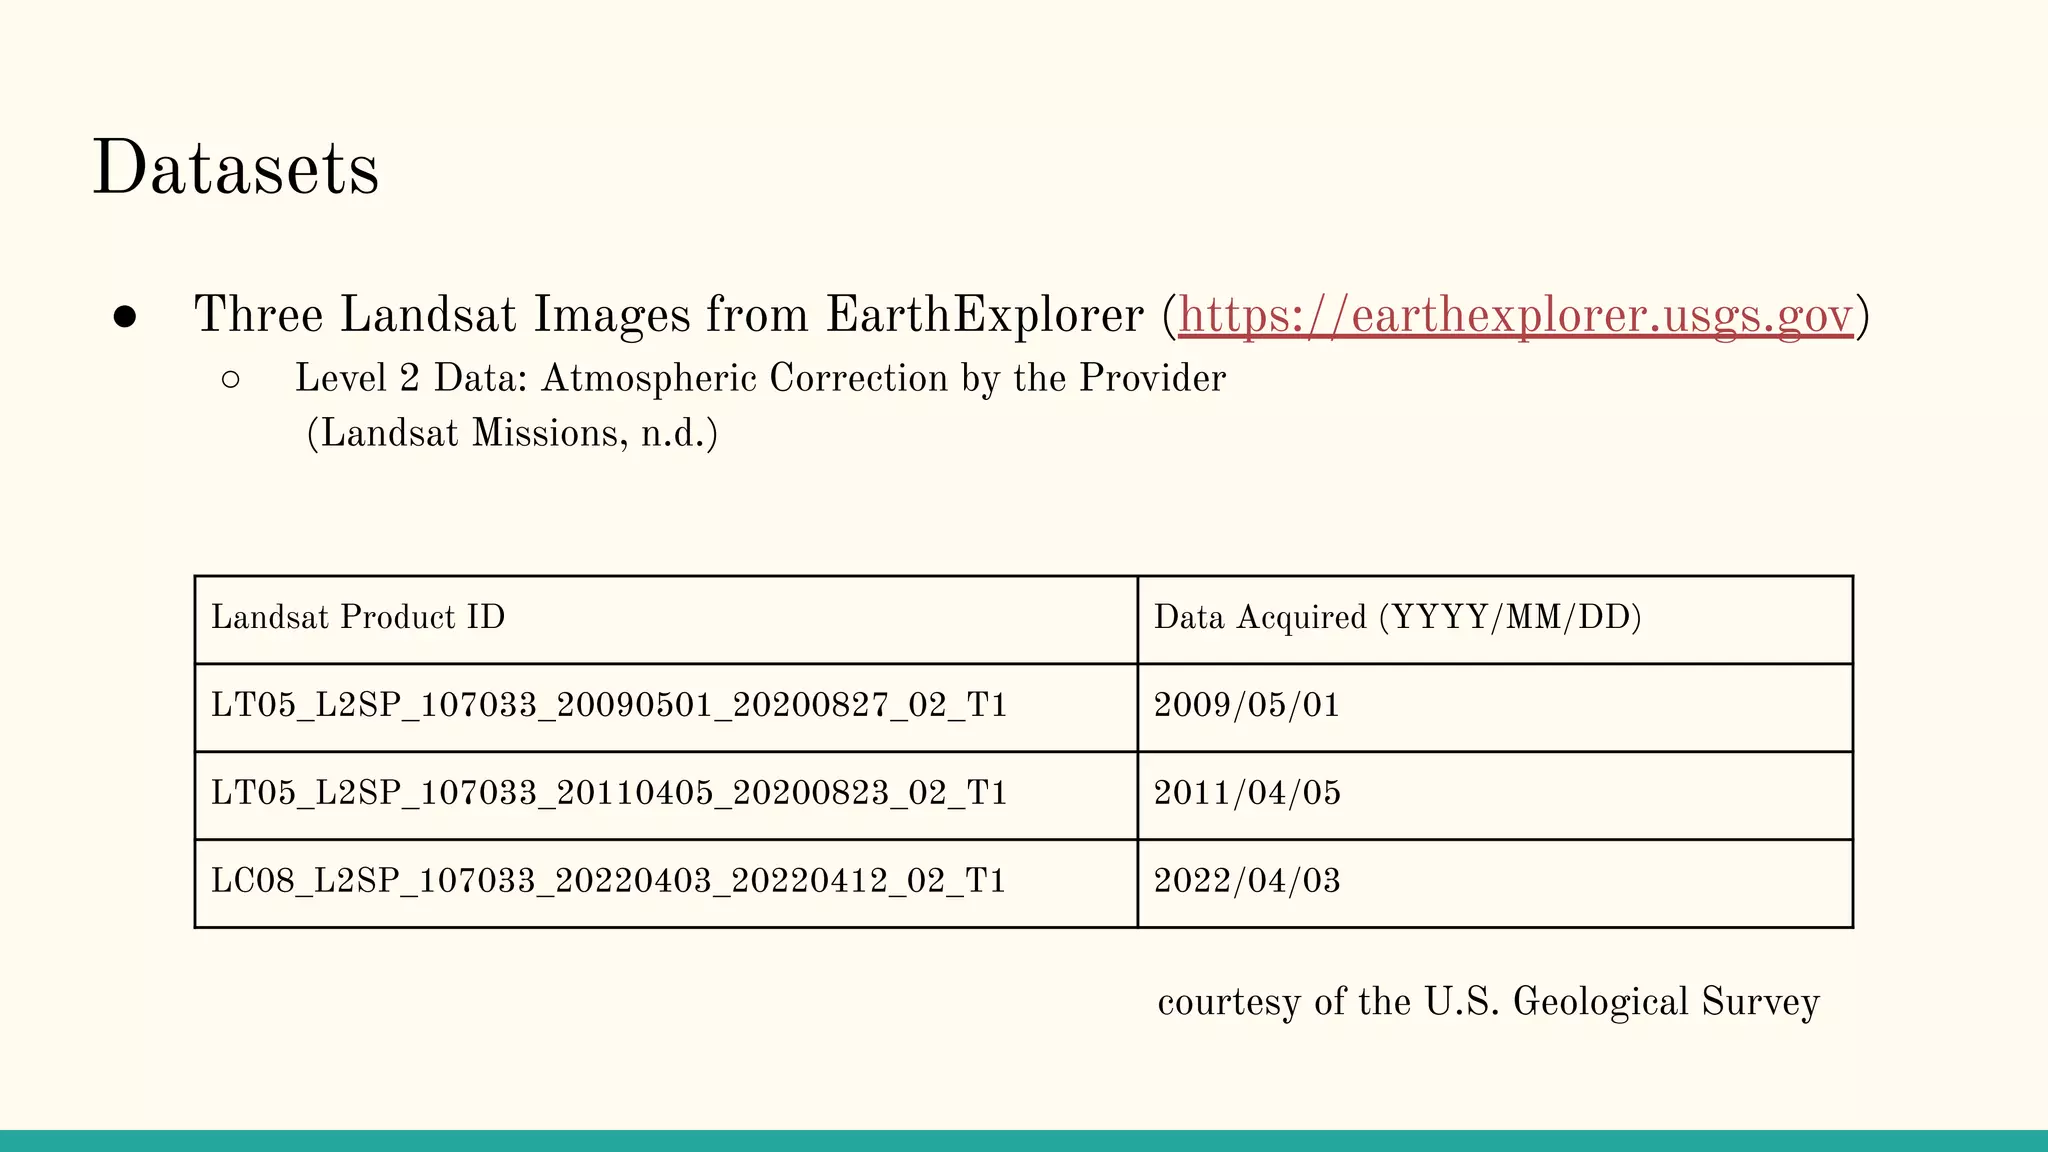
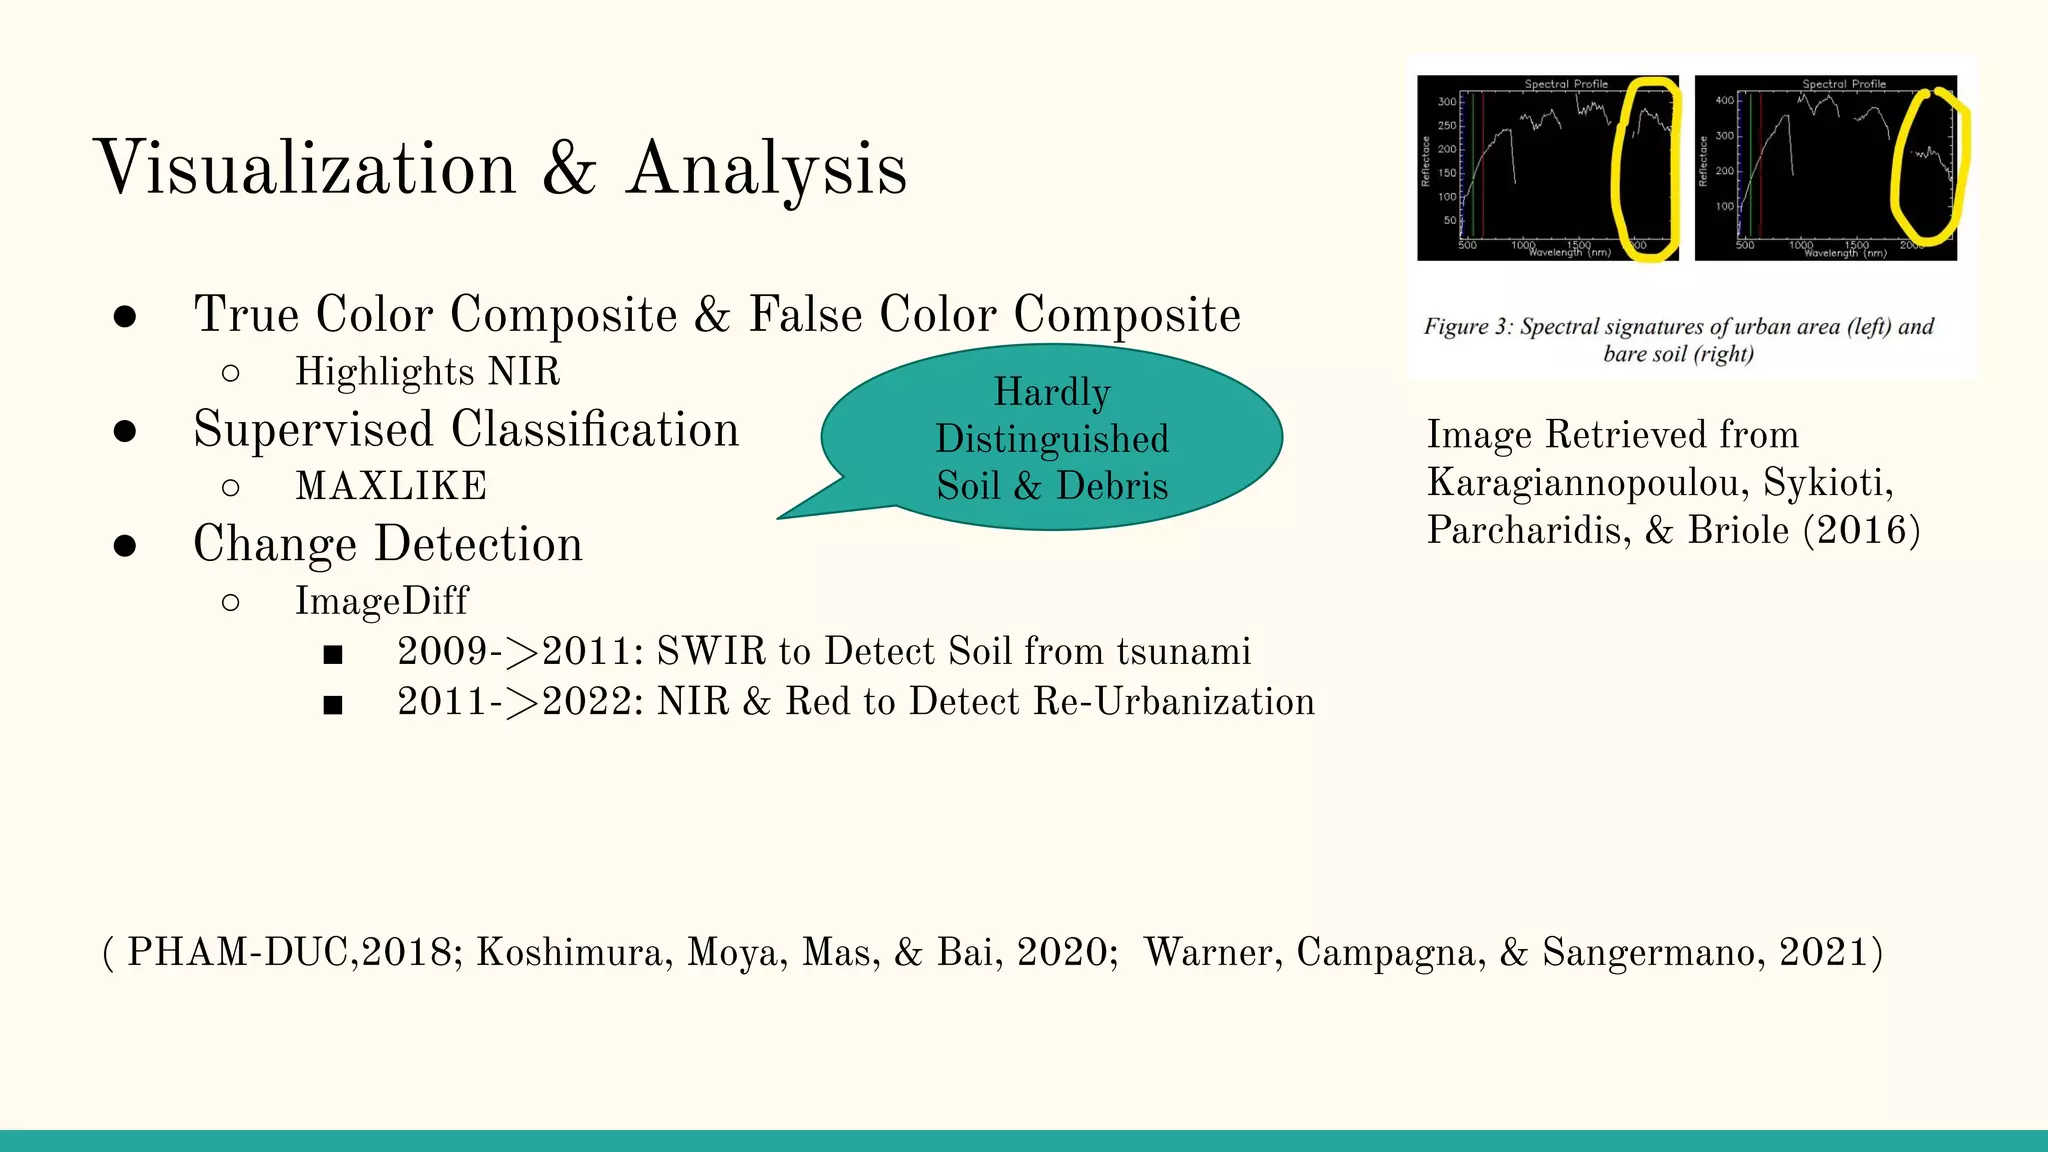
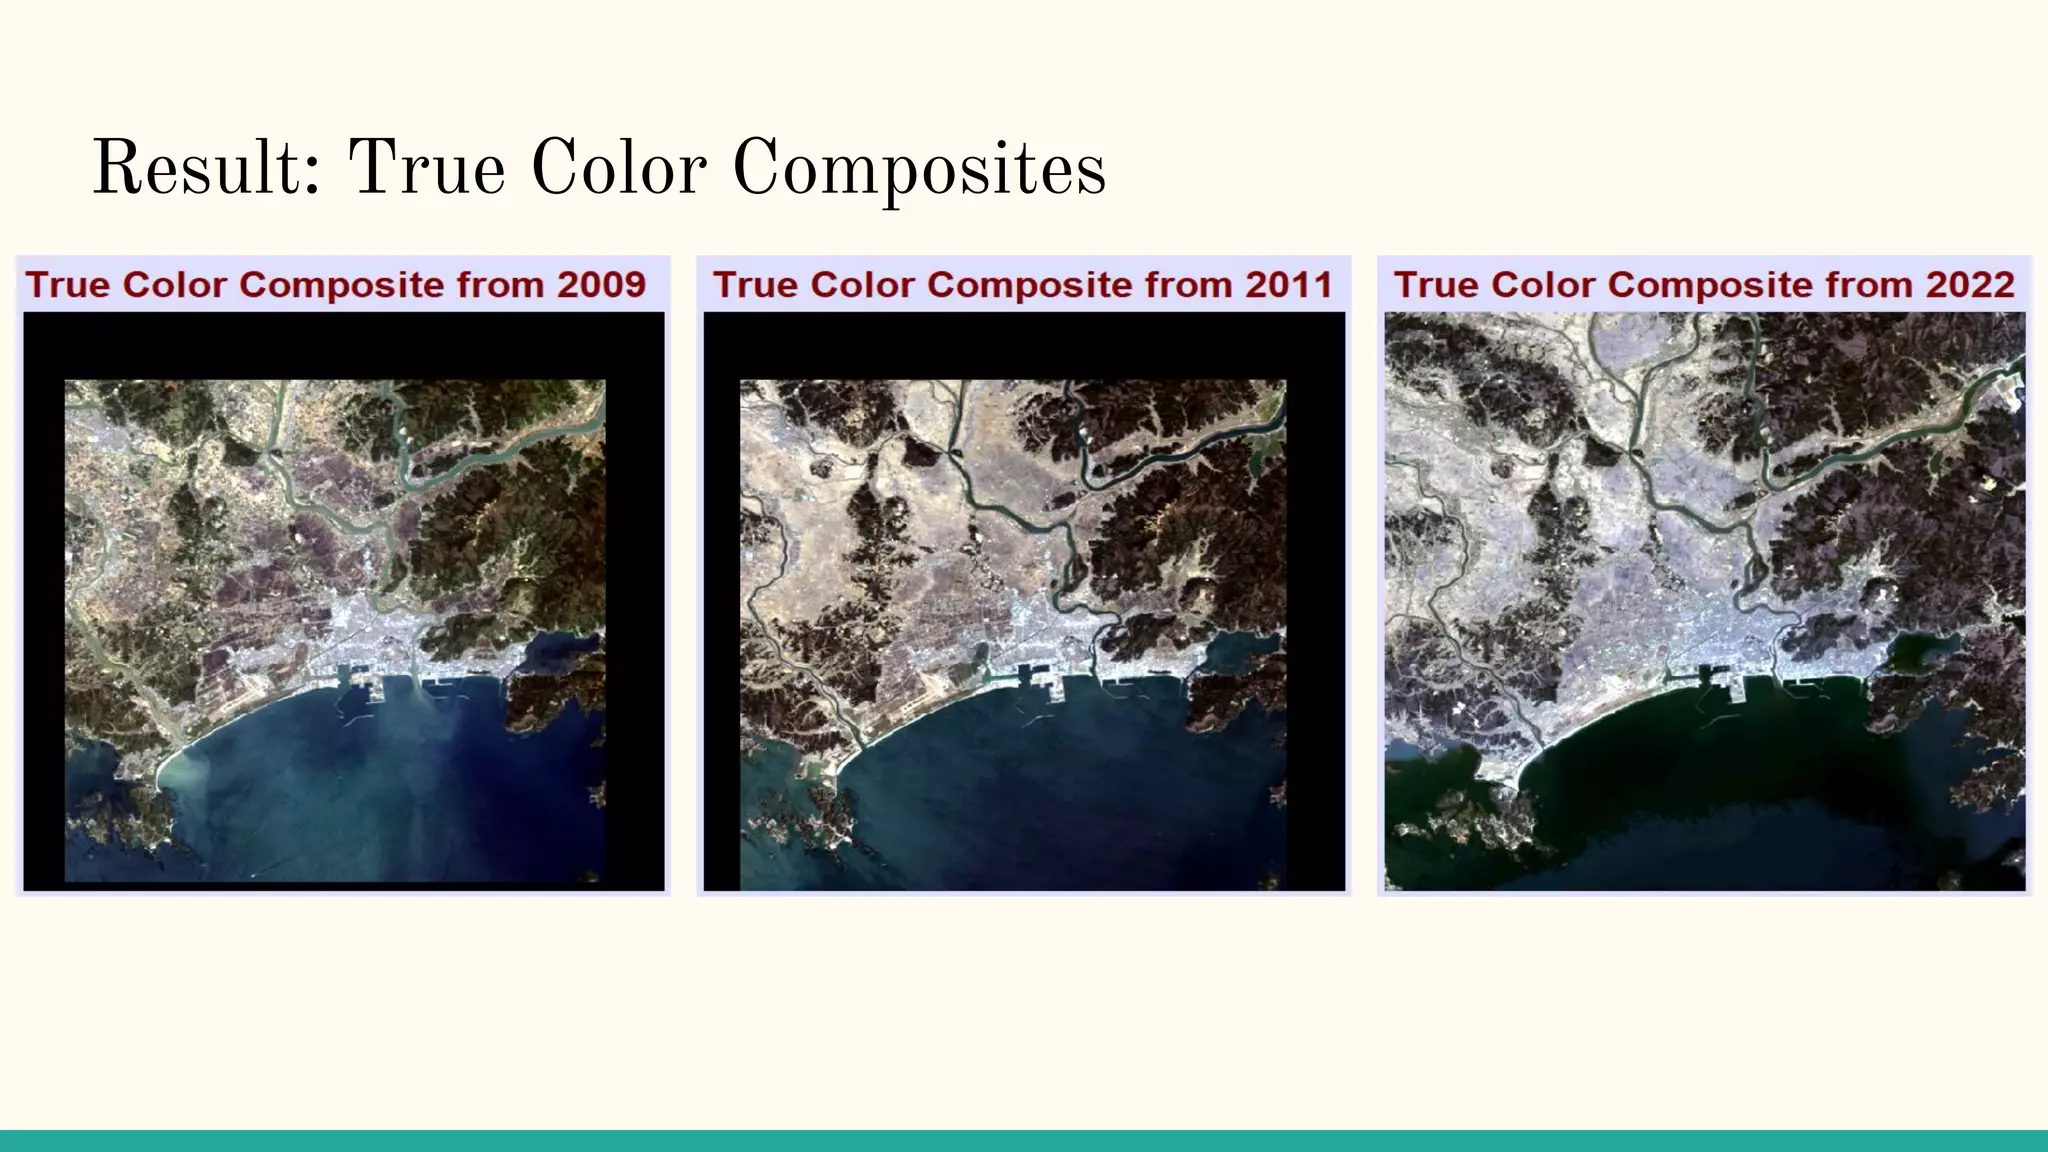
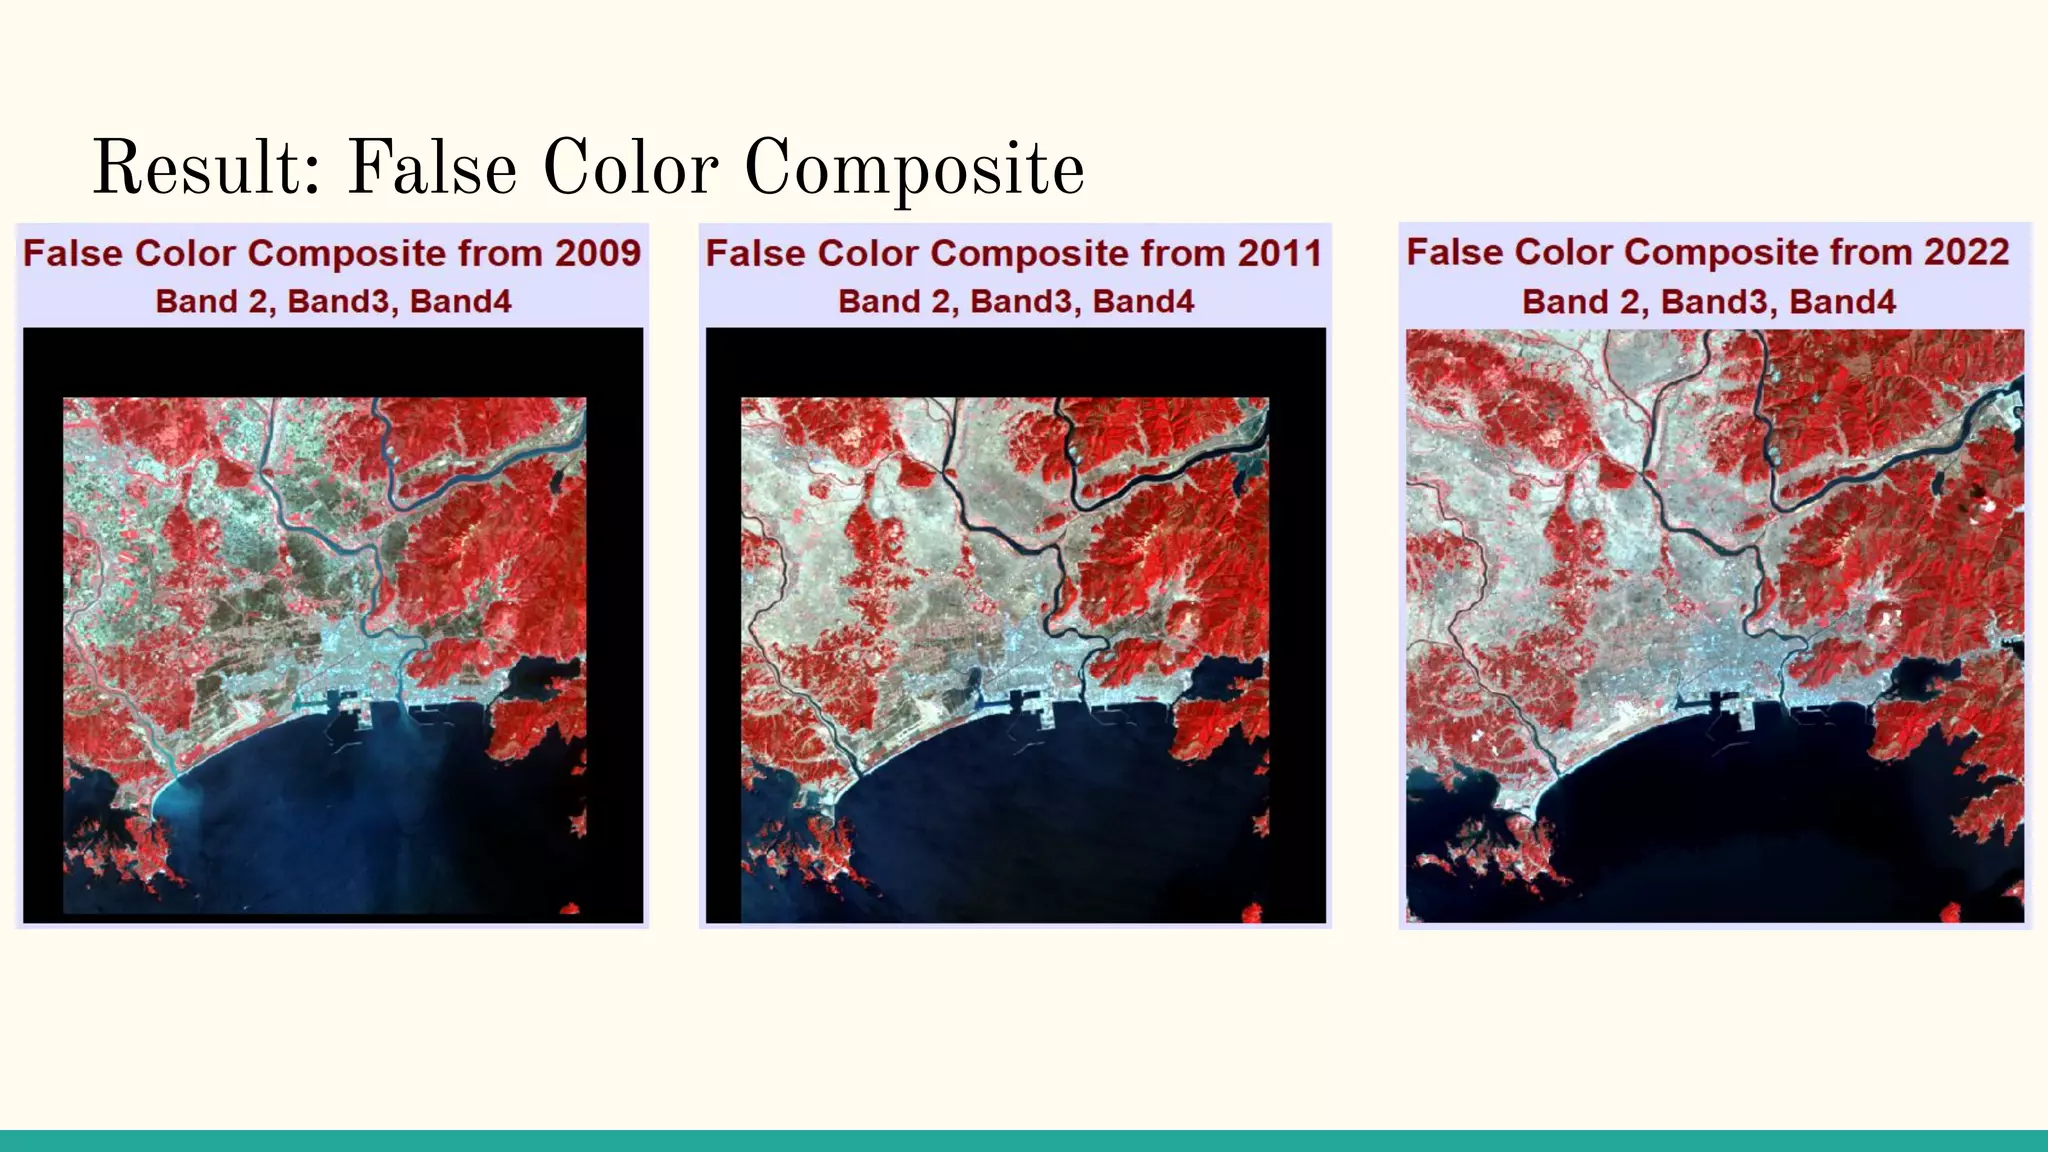
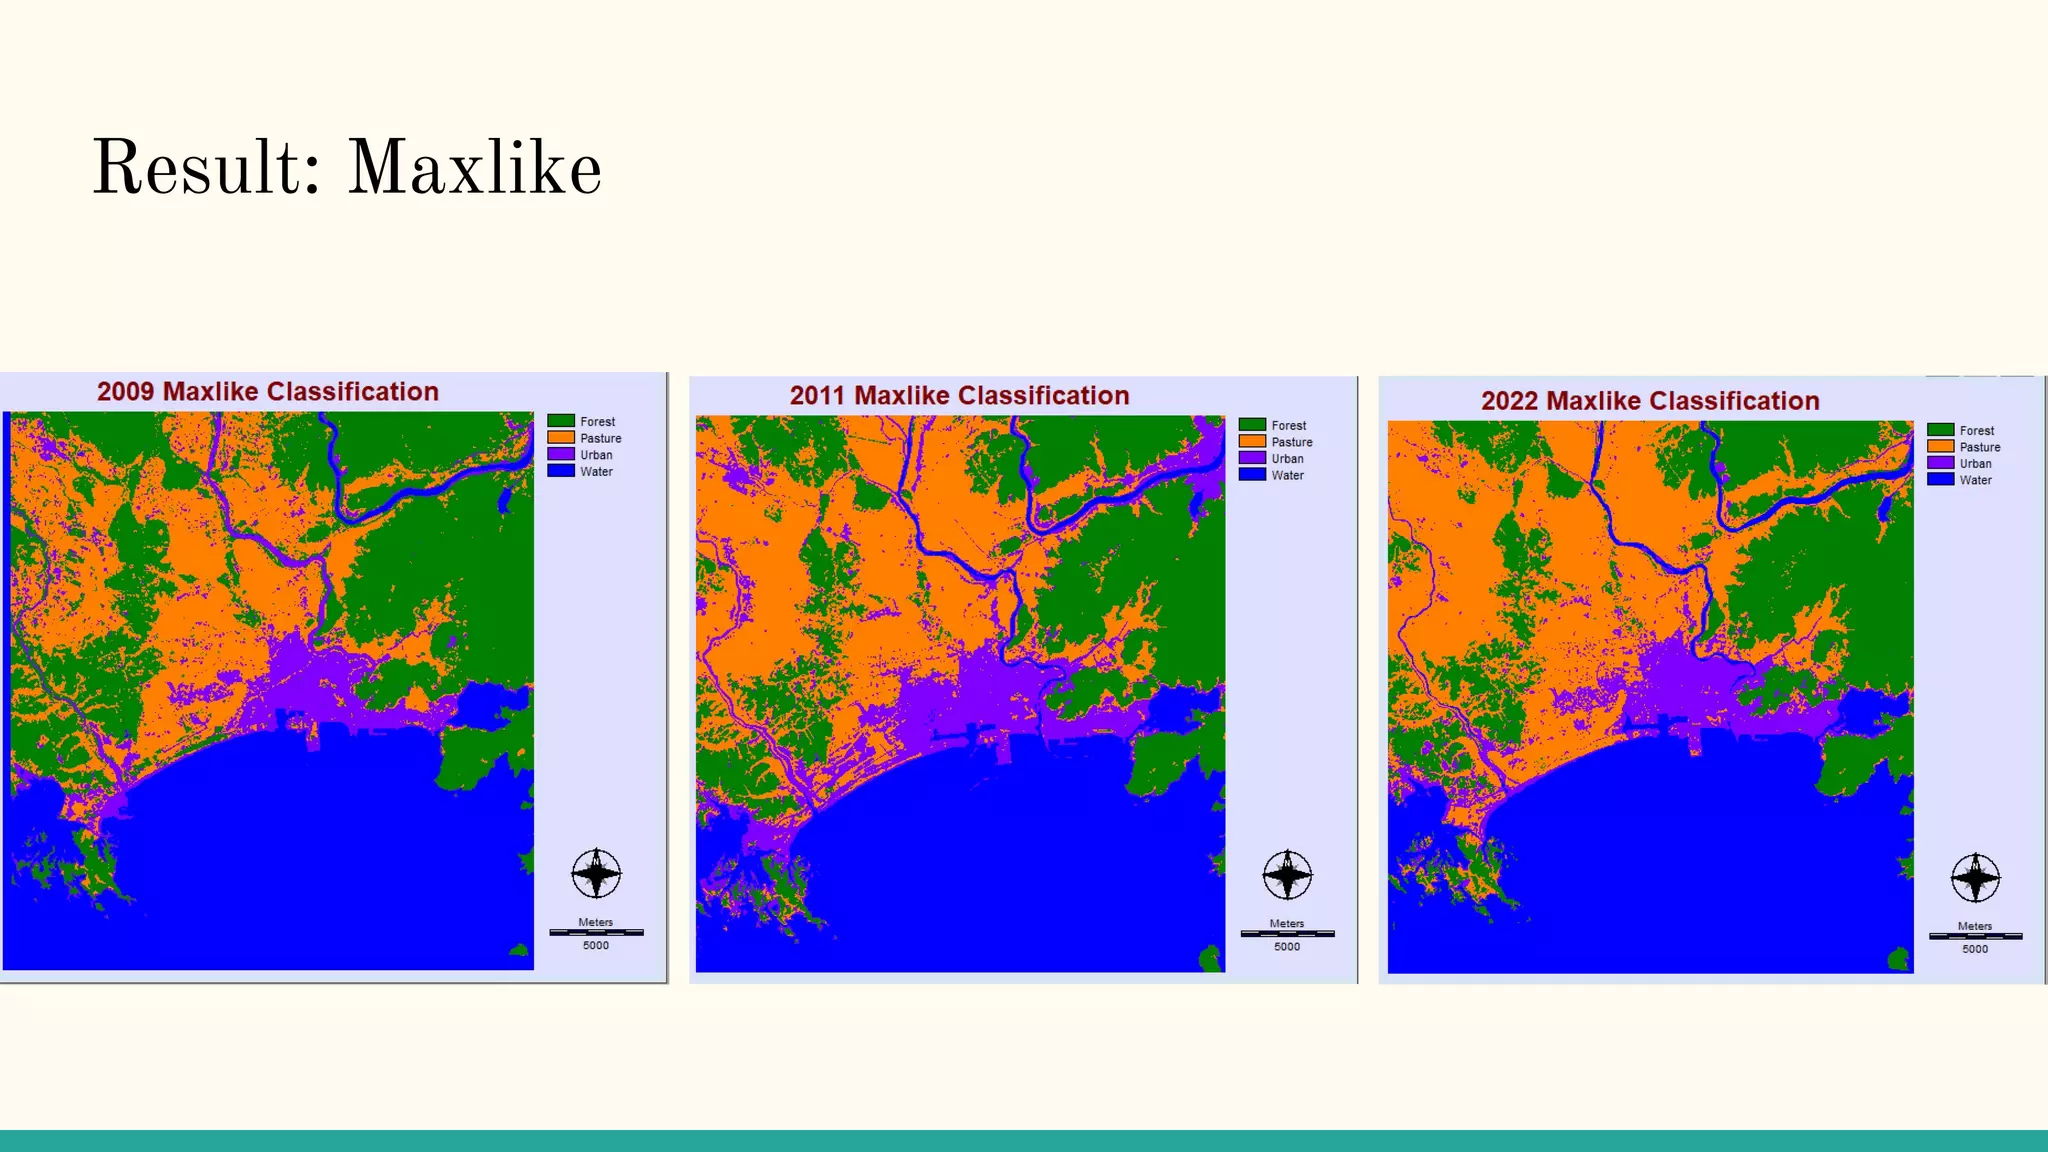
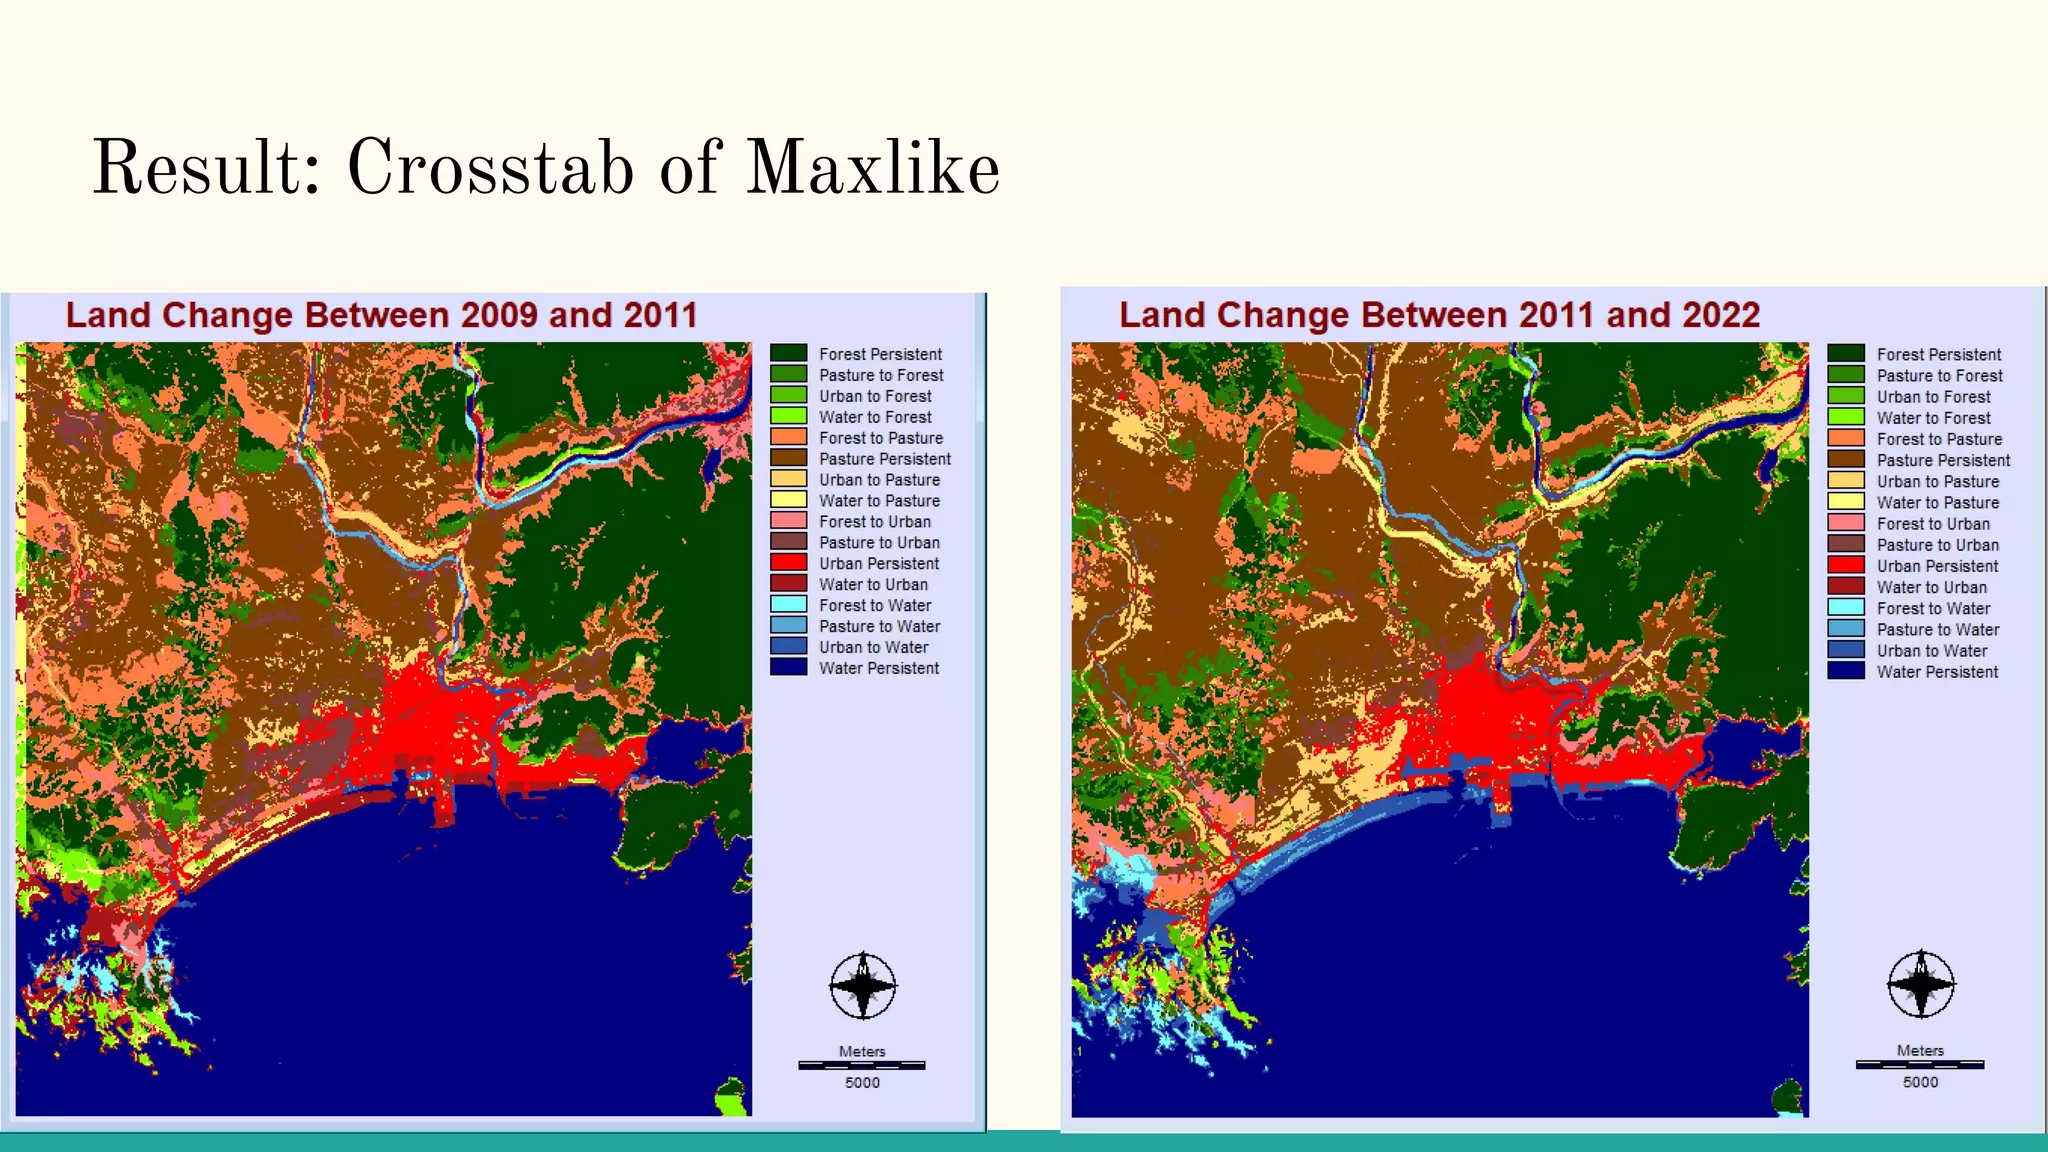
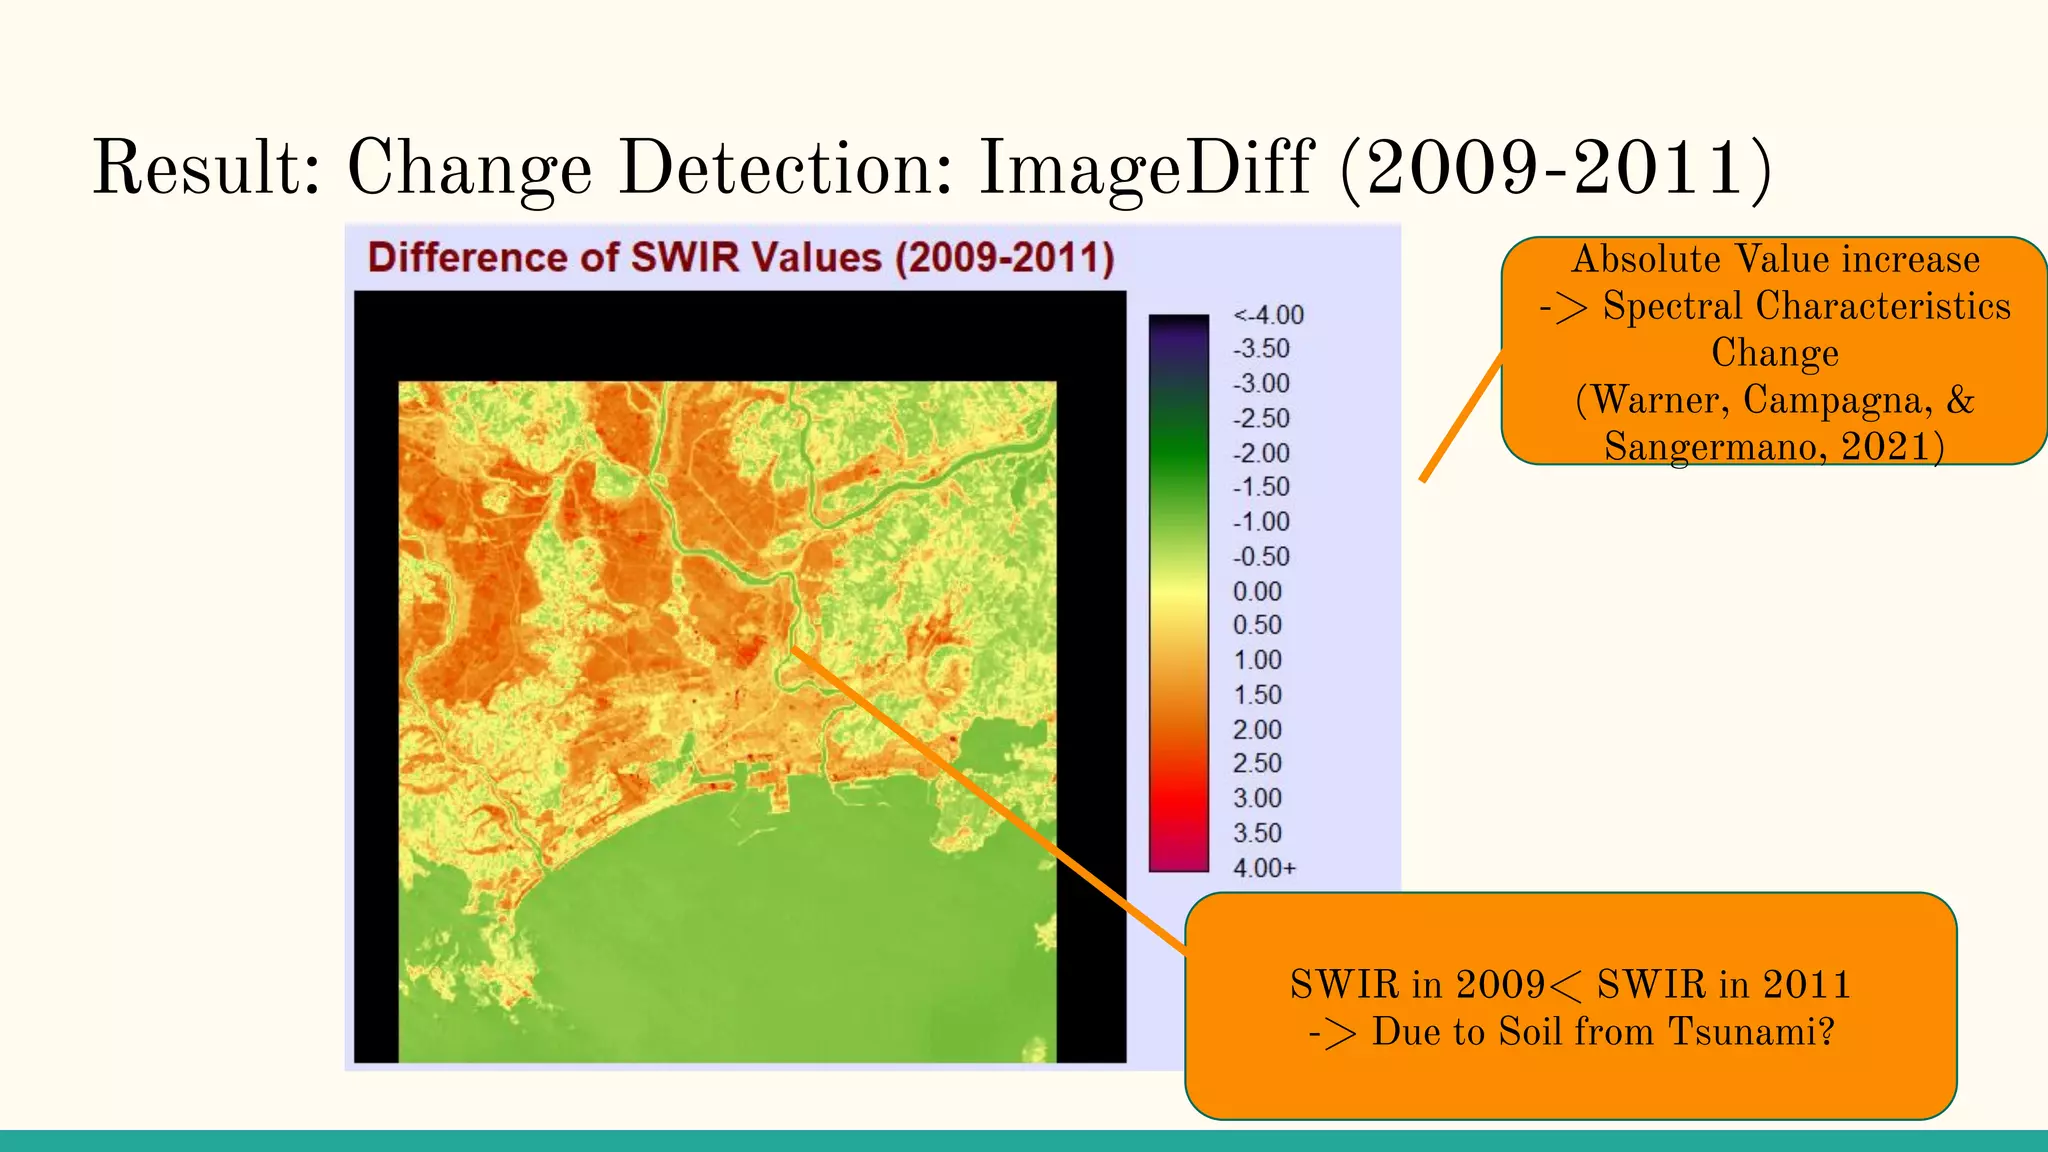
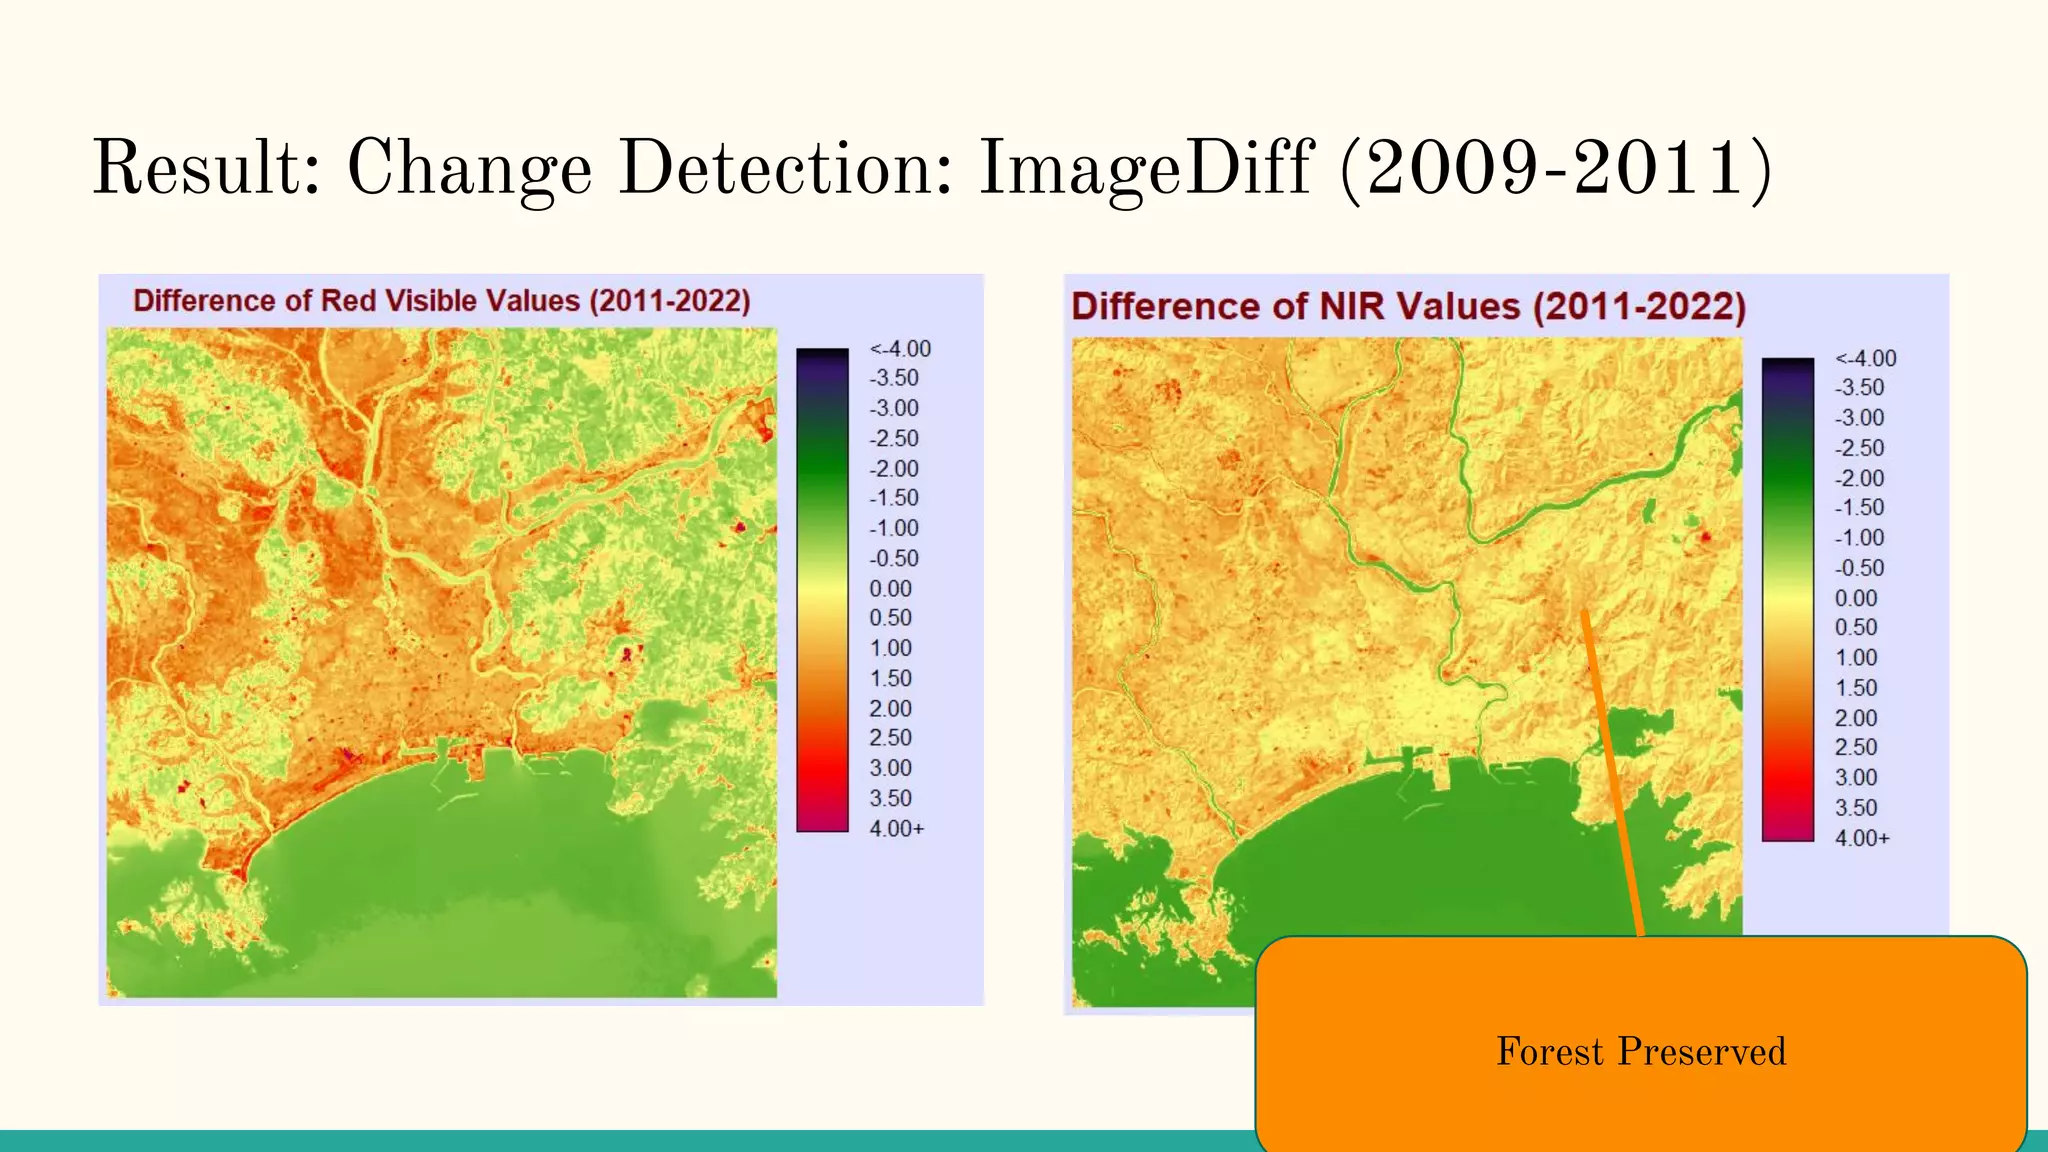
Tsunami Damage and Recovery in
Ishinomaki city using Landsat Data
Jade Newman, Naoya Morishita
Table of Contents
● Backgrounds
● Research Question
● Data&Methods
● Result
● Discussion
● Reference
Backgrounds: About East Japan Great Earthquake
● Time: Mar 11, 2011
● Place: East Japan, especially Northeast Region
● Magnitude: 9.0
● Life Loss or Missing: 20K+
● Completely Destroyed Buildings: 120K +
● Major Secondary Disasters: Tsunami, Nuclear Accident
(Reconstruction Agency, n.d.)
Image Retrieved from Reconstruction Agency “Great East Japan Earthquake”
https://www.reconstruction.go.jp/english/topics/GEJE/index.html on Dec 13, 2022
Literature-1&2
● The Earth Observatory, 2012
○ “Wreckage and Recovery in Ishinomaki, Japan,”
○ Comparison FCCs
○ Water Retret in 1yr
● The Earth Observatory, 2021
○ “Ten Years After the Tsunami”
○ Comparison FCCs
○ Reconstruction e.g. Seawall
Image Retrieved from The Earth
Observatory “Ten Years After the
Tsunami”
https://earthobservatory.nasa.gov/ima
ges/148036/ten-years-after-the-tsuna
mi on Dec 13, 2022
Image Retrieved from The Earth Observatory “Wreckage and Recovery in
Ishinomaki, Japan”
https://earthobservatory.nasa.gov/images/148036/ten-years-after-the-tsuna
mi on Dec 13, 2022
Literature-3&4
● Koshimura, Moya, Mas, & Bai, 2020
○ “Tsunami Damage Detection with Remote Sensing: A Review”
○ Use of NDVI, NDWI, NDSI, and Supervised Classification
○ GIS & RS Contribution to Disaster Management & Evaluation
● Ishihara & Tadono, 2017
○ “Land cover changes induced by the great east Japan earthquake in 2011,”
○ Supervised Classification using Landsat Images & ALOS AVNIR-2 Images
○ Changes from Farmland to Grassland
Research Question
● How have the land use changed after the East-Japan Great Earthquake in
Ishinomaki city?
○ Comparison between:
■ Pre-Disaster
■ Post-Disaster
■ Current
○ About the City & the Damage:
■ Miyagi Pref
■ 3.5K of lives lost or missing
■ 20K buildings totally destroyed
(Statistics Bureau, Sep. 17, 2013; as cited in Murakami, et al., 2014).
Image Retrieved from Open Street Map
https://www.openstreetmap.org/
on Dec 09, 2022
Datasets
● Three Landsat Images from EarthExplorer (https://earthexplorer.usgs.gov)
○ Level 2 Data: Atmospheric Correction by the Provider
(Landsat Missions, n.d.)
Landsat Product ID Data Acquired (YYYY/MM/DD)
LT05_L2SP_107033_20090501_20200827_02_T1 2009/05/01
LT05_L2SP_107033_20110405_20200823_02_T1 2011/04/05
LC08_L2SP_107033_20220403_20220412_02_T1 2022/04/03
courtesy of the U.S. Geological Survey
Pre-Processing
● Not Necessarily Need for Atmospheric Correction
● Geometric Correction
○ Resample (GCPs)
● Noise Reduction
○ Mean Filter
○ Adaptive Box Filter
(Warner, Campagna, & Sangermano, 2021)
Visualization & Analysis
● True Color Composite & False Color Composite
○ Highlights NIR
● Supervised Classification
○ MAXLIKE
● Change Detection
○ ImageDiff
■ 2009->2011: SWIR to Detect Soil from tsunami
■ 2011->2022: NIR & Red to Detect Re-Urbanization
( PHAM-DUC,2018; Koshimura, Moya, Mas, & Bai, 2020; Warner, Campagna, & Sangermano, 2021)
Hardly
Distinguished
Soil & Debris
Image Retrieved from
Karagiannopoulou, Sykioti,
Parcharidis, & Briole (2016)
Supervised Classification
1. Decide Information Classes
○ Forest, Paddyfield & Pasture, Urban, Water
2. Making Training Sites
3. Generate Signature Files
4. Analyze Characteristics of Signature Files
○ Histo-> Confirming Unimordality
○ Scatter Plot, Line Graph -> Confirming Separatability
5. Run Modules in Terrset
○ “MAXLIKE”
○ Assign Groups of Spectral to Information Classes (UnSupervised Classification)
6. “Crosstab” to detect Landuse Change
(Warner, Campagna, & Sangermano, 2021)
Change Detection
1. Radiometric Correction & Geometric Correction
○ Done
2. Image Nomalization
○ Digitize Unchanged Areas
○ Vector to Raster Conversion
○ Regress
○ Image Calculator
3. ImageDiff Module
○ How significant the Spectral Characteristics Change is?
4. PCA& Scholor
5. (CVA)
(Warner, Campagna, & Sangermano, 2021)
Result: True Color Composites
Result: False Color Composite
Result: Maxlike
Result: Crosstab of Maxlike
Result: Change Detection: ImageDiff (2009-2011)
Absolute Value increase
-> Spectral Characteristics
Change
(Warner, Campagna, &
Sangermano, 2021)
SWIR in 2009< SWIR in 2011
-> Due to Soil from Tsunami?
Result: Change Detection: ImageDiff (2009-2011)
Forest Preserved
Discussion & Conclusion
❖ Land-use largely same (including Forest), but Urban to Pasture occured
❖ More SWIR along Water sites in 2011
➢ Soil conveyed due to tsunami runup?
❖ More Red in Devastated Area in 2022
➢ Re- Urbanization?
Other Methods? Further Studies?
❖ Tsunami Analysis handles Aquatic Object-> Weather also Considered
➢ No English Database Available
➢ No Old Record Available
❖ Comparison with other Classification
➢ MLP
❖ More Detailed Time-series
➢ 1yr Interval
❖ Larger study
➢ Look into how the whole Tohoku region has changed from the 2011 tsunami
References
EOS Data Analytics, Inc. (n.d.). Normalized Difference Water Index. Retrieved 12 09, 2022, from Website of EOS Data Analytics:
https://eos.com/make-an-analysis/ndwi/
Ishihara, M., & Tadono, T. (2017). Land cover changes induced by the great east Japan earthquake in 2011. Scientific Reports, 7(1), 1-7.
Karagiannopoulou, K., Sykioti, O., Parcharidis, I., & Briole, P. (2016). Lava flow mapping and change detection in the Mt. Etna Volcano between 2009-2012 using
Hyperion Hyperspectral imagery. Plague: ESA Living Planet Symposium 2016.
Koshimura, S., Moya, L., Mas, E., & Bai, Y. (2020). Tsunami Damage Detection with Remote Sensing: A Review. Geosciences, 10(5), 177.
Landsat Missions. (n.d.). Landsat 5. Retrieved 12 09, 2022, from Website of the USGS: https://www.usgs.gov/landsat-missions/landsat-5
Landsat Missions. (n.d.). Landsat Collection 2 Surface Reflectance. Retrieved 12 09, 2022, from Website of USGS:
https://www.usgs.gov/landsat-missions/landsat-collection-2-surface-reflectance
Loyd, C. (n.d.). LANDSAT 8 BANDS. Retrieved 12 09, 2022, from Website of Landsat Science: https://landsat.gsfc.nasa.gov/satellites/landsat-8/landsat-8-bands/
Murakami, H., Yanagihara, S., Goto, Y., Mikami, T., Sato, S., & Wakihama, T. (2014). Study on casualty and tsunami evacuation behavior in Ishinomaki City:
Questionnaire survey for the 2011 Great East Japan Earthquake. Anchorage, Alaska: Tenth U.S. National Conference on Earthquake Engineering.
PHAM-DUC, B. (2018). SATELLITE REMOTE SENSING OF THE VARIABILITY OF THE CONTINENTAL HYDROLOGY CYCLE IN THE LOWER
MEKONG BASIN OVER THE LAST TWO DECADES . Paris: Sorbonne University.
Reconstruction Agency. (n.d.). Great East Japan Earthquake. Retrieved 12 04, 2022, from Website of Reconstruction Agency:
https://www.reconstruction.go.jp/english/topics/GEJE/
Reconstruction Promotion Council. (2020). Reconstruction Efforts from FY 2021. Tokyo: Reconstruction Agency.
The Earth Observatory. (2012, 03 13). Wreckage and Recovery in Ishinomaki, Japan. Retrieved 12 04, 2022, from Website of NASA Earth Observatory:
https://earthobservatory.nasa.gov/images/77352/wreckage-and-recovery-in-ishinomaki-japan
The Earth Observatory. (2021, 03 11). Ten Years After the Tsunami. Retrieved from Website of NASA Earth Observatory:
https://earthobservatory.nasa.gov/images/148036/ten-years-after-the-tsunami
Warner, T., Campagna, D. J., & Sangermano, F. (2021). Remote Sensing with TerrSet 2020 / IDRISI: A Beginner's Guide. Hong Kong: Geocarto International Centre
Ltd.

intro2rs_final_presentation.pdf

  • 1.
    Tsunami Damage andRecovery in Ishinomaki city using Landsat Data Jade Newman, Naoya Morishita
  • 2.
    Table of Contents ●Backgrounds ● Research Question ● Data&Methods ● Result ● Discussion ● Reference
  • 3.
    Backgrounds: About EastJapan Great Earthquake ● Time: Mar 11, 2011 ● Place: East Japan, especially Northeast Region ● Magnitude: 9.0 ● Life Loss or Missing: 20K+ ● Completely Destroyed Buildings: 120K + ● Major Secondary Disasters: Tsunami, Nuclear Accident (Reconstruction Agency, n.d.) Image Retrieved from Reconstruction Agency “Great East Japan Earthquake” https://www.reconstruction.go.jp/english/topics/GEJE/index.html on Dec 13, 2022
  • 4.
    Literature-1&2 ● The EarthObservatory, 2012 ○ “Wreckage and Recovery in Ishinomaki, Japan,” ○ Comparison FCCs ○ Water Retret in 1yr ● The Earth Observatory, 2021 ○ “Ten Years After the Tsunami” ○ Comparison FCCs ○ Reconstruction e.g. Seawall Image Retrieved from The Earth Observatory “Ten Years After the Tsunami” https://earthobservatory.nasa.gov/ima ges/148036/ten-years-after-the-tsuna mi on Dec 13, 2022 Image Retrieved from The Earth Observatory “Wreckage and Recovery in Ishinomaki, Japan” https://earthobservatory.nasa.gov/images/148036/ten-years-after-the-tsuna mi on Dec 13, 2022
  • 5.
    Literature-3&4 ● Koshimura, Moya,Mas, & Bai, 2020 ○ “Tsunami Damage Detection with Remote Sensing: A Review” ○ Use of NDVI, NDWI, NDSI, and Supervised Classification ○ GIS & RS Contribution to Disaster Management & Evaluation ● Ishihara & Tadono, 2017 ○ “Land cover changes induced by the great east Japan earthquake in 2011,” ○ Supervised Classification using Landsat Images & ALOS AVNIR-2 Images ○ Changes from Farmland to Grassland
  • 6.
    Research Question ● Howhave the land use changed after the East-Japan Great Earthquake in Ishinomaki city? ○ Comparison between: ■ Pre-Disaster ■ Post-Disaster ■ Current ○ About the City & the Damage: ■ Miyagi Pref ■ 3.5K of lives lost or missing ■ 20K buildings totally destroyed (Statistics Bureau, Sep. 17, 2013; as cited in Murakami, et al., 2014). Image Retrieved from Open Street Map https://www.openstreetmap.org/ on Dec 09, 2022
  • 7.
    Datasets ● Three LandsatImages from EarthExplorer (https://earthexplorer.usgs.gov) ○ Level 2 Data: Atmospheric Correction by the Provider (Landsat Missions, n.d.) Landsat Product ID Data Acquired (YYYY/MM/DD) LT05_L2SP_107033_20090501_20200827_02_T1 2009/05/01 LT05_L2SP_107033_20110405_20200823_02_T1 2011/04/05 LC08_L2SP_107033_20220403_20220412_02_T1 2022/04/03 courtesy of the U.S. Geological Survey
  • 8.
    Pre-Processing ● Not NecessarilyNeed for Atmospheric Correction ● Geometric Correction ○ Resample (GCPs) ● Noise Reduction ○ Mean Filter ○ Adaptive Box Filter (Warner, Campagna, & Sangermano, 2021)
  • 9.
    Visualization & Analysis ●True Color Composite & False Color Composite ○ Highlights NIR ● Supervised Classification ○ MAXLIKE ● Change Detection ○ ImageDiff ■ 2009->2011: SWIR to Detect Soil from tsunami ■ 2011->2022: NIR & Red to Detect Re-Urbanization ( PHAM-DUC,2018; Koshimura, Moya, Mas, & Bai, 2020; Warner, Campagna, & Sangermano, 2021) Hardly Distinguished Soil & Debris Image Retrieved from Karagiannopoulou, Sykioti, Parcharidis, & Briole (2016)
  • 10.
    Supervised Classification 1. DecideInformation Classes ○ Forest, Paddyfield & Pasture, Urban, Water 2. Making Training Sites 3. Generate Signature Files 4. Analyze Characteristics of Signature Files ○ Histo-> Confirming Unimordality ○ Scatter Plot, Line Graph -> Confirming Separatability 5. Run Modules in Terrset ○ “MAXLIKE” ○ Assign Groups of Spectral to Information Classes (UnSupervised Classification) 6. “Crosstab” to detect Landuse Change (Warner, Campagna, & Sangermano, 2021)
  • 11.
    Change Detection 1. RadiometricCorrection & Geometric Correction ○ Done 2. Image Nomalization ○ Digitize Unchanged Areas ○ Vector to Raster Conversion ○ Regress ○ Image Calculator 3. ImageDiff Module ○ How significant the Spectral Characteristics Change is? 4. PCA& Scholor 5. (CVA) (Warner, Campagna, & Sangermano, 2021)
  • 12.
  • 13.
  • 14.
  • 15.
  • 16.
    Result: Change Detection:ImageDiff (2009-2011) Absolute Value increase -> Spectral Characteristics Change (Warner, Campagna, & Sangermano, 2021) SWIR in 2009< SWIR in 2011 -> Due to Soil from Tsunami?
  • 17.
    Result: Change Detection:ImageDiff (2009-2011) Forest Preserved
  • 18.
    Discussion & Conclusion ❖Land-use largely same (including Forest), but Urban to Pasture occured ❖ More SWIR along Water sites in 2011 ➢ Soil conveyed due to tsunami runup? ❖ More Red in Devastated Area in 2022 ➢ Re- Urbanization?
  • 19.
    Other Methods? FurtherStudies? ❖ Tsunami Analysis handles Aquatic Object-> Weather also Considered ➢ No English Database Available ➢ No Old Record Available ❖ Comparison with other Classification ➢ MLP ❖ More Detailed Time-series ➢ 1yr Interval ❖ Larger study ➢ Look into how the whole Tohoku region has changed from the 2011 tsunami
  • 20.
    References EOS Data Analytics,Inc. (n.d.). Normalized Difference Water Index. Retrieved 12 09, 2022, from Website of EOS Data Analytics: https://eos.com/make-an-analysis/ndwi/ Ishihara, M., & Tadono, T. (2017). Land cover changes induced by the great east Japan earthquake in 2011. Scientific Reports, 7(1), 1-7. Karagiannopoulou, K., Sykioti, O., Parcharidis, I., & Briole, P. (2016). Lava flow mapping and change detection in the Mt. Etna Volcano between 2009-2012 using Hyperion Hyperspectral imagery. Plague: ESA Living Planet Symposium 2016. Koshimura, S., Moya, L., Mas, E., & Bai, Y. (2020). Tsunami Damage Detection with Remote Sensing: A Review. Geosciences, 10(5), 177. Landsat Missions. (n.d.). Landsat 5. Retrieved 12 09, 2022, from Website of the USGS: https://www.usgs.gov/landsat-missions/landsat-5 Landsat Missions. (n.d.). Landsat Collection 2 Surface Reflectance. Retrieved 12 09, 2022, from Website of USGS: https://www.usgs.gov/landsat-missions/landsat-collection-2-surface-reflectance Loyd, C. (n.d.). LANDSAT 8 BANDS. Retrieved 12 09, 2022, from Website of Landsat Science: https://landsat.gsfc.nasa.gov/satellites/landsat-8/landsat-8-bands/ Murakami, H., Yanagihara, S., Goto, Y., Mikami, T., Sato, S., & Wakihama, T. (2014). Study on casualty and tsunami evacuation behavior in Ishinomaki City: Questionnaire survey for the 2011 Great East Japan Earthquake. Anchorage, Alaska: Tenth U.S. National Conference on Earthquake Engineering. PHAM-DUC, B. (2018). SATELLITE REMOTE SENSING OF THE VARIABILITY OF THE CONTINENTAL HYDROLOGY CYCLE IN THE LOWER MEKONG BASIN OVER THE LAST TWO DECADES . Paris: Sorbonne University. Reconstruction Agency. (n.d.). Great East Japan Earthquake. Retrieved 12 04, 2022, from Website of Reconstruction Agency: https://www.reconstruction.go.jp/english/topics/GEJE/ Reconstruction Promotion Council. (2020). Reconstruction Efforts from FY 2021. Tokyo: Reconstruction Agency. The Earth Observatory. (2012, 03 13). Wreckage and Recovery in Ishinomaki, Japan. Retrieved 12 04, 2022, from Website of NASA Earth Observatory: https://earthobservatory.nasa.gov/images/77352/wreckage-and-recovery-in-ishinomaki-japan The Earth Observatory. (2021, 03 11). Ten Years After the Tsunami. Retrieved from Website of NASA Earth Observatory: https://earthobservatory.nasa.gov/images/148036/ten-years-after-the-tsunami Warner, T., Campagna, D. J., & Sangermano, F. (2021). Remote Sensing with TerrSet 2020 / IDRISI: A Beginner's Guide. Hong Kong: Geocarto International Centre Ltd.