The U.S. Bicycle Route System 
Best Practices & Case Studies 
September 2014 
Kevin Luecke 
Toole Design Group 
Ginny Sullivan 
Adventure Cycling Association
Overview 
•Adventure Cycling 
•USBRS Vision 
•Evidence of Success 
•Why it’$ Important 
•AASHTO Process 
•Why a study 
•Survey Results 
•Case Studies 
•Best Practices 
•What’s next
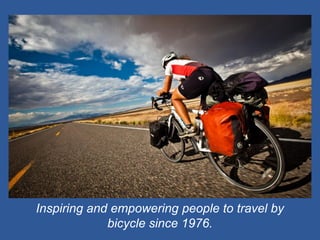
Inspiring and empowering people to travel by bicycle since 1976.
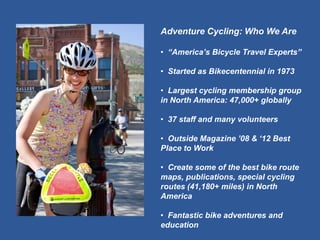
Adventure Cycling: Who We Are 
• “America’s Bicycle Travel Experts” 
• Started as Bikecentennial in 1973 
• Largest cycling membership group in North America: 47,000+ globally 
• 37 staff and many volunteers 
• Outside Magazine ’08 & ‘12 Best Place to Work 
• Create some of the best bike route maps, publications, special cycling routes (41,180+ miles) in North America 
• Fantastic bike adventures and education
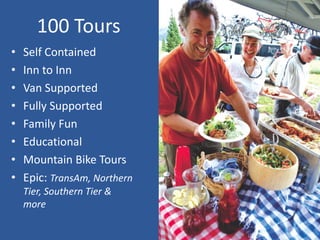
100 Tours 
•Self Contained 
•Inn to Inn 
•Van Supported 
•Fully Supported 
•Family Fun 
•Educational 
•Mountain Bike Tours 
•Epic: TransAm, Northern Tier, Southern Tier & more
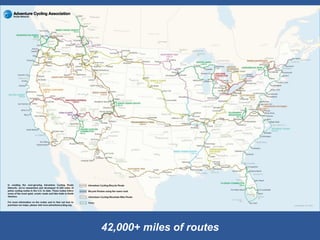
42,000+ miles of routes
** A Nation of Networks ** 
** Connected and convenient interstate 
bike travel from city center to countryside **
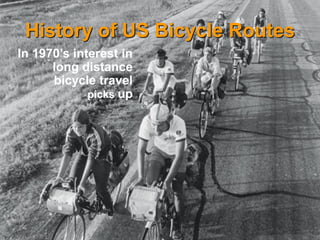
History of US Bicycle Routes 
In 1970’s interest in long distance bicycle travel picks up
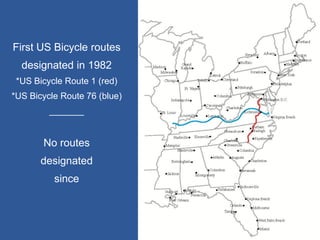
First US Bicycle routes 
designated in 1982 
*US Bicycle Route 1 (red) 
*US Bicycle Route 76 (blue) 
_______ 
No routes 
designated 
since
Began Project late 2003 
Staff Support 2005 
** AASHTO Approval 2008 **
The Vision 
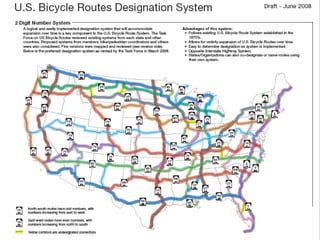
To encourage the development of a coordinated system of US bicycle routes across the country. 
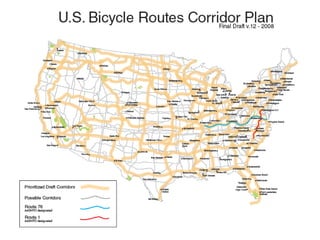
The Task Force is charged with developing a recommended national systems-level or corridor- level plan for use in designating potential future US bicycle routes.
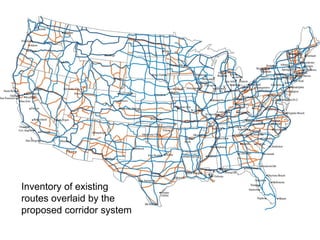
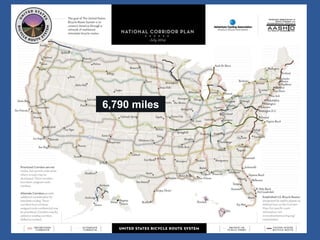
Inventory of existing routes overlaid by the proposed corridor system
6,790 miles
https://www.youtube.com/watch?v=MEHOj-Nc60Q
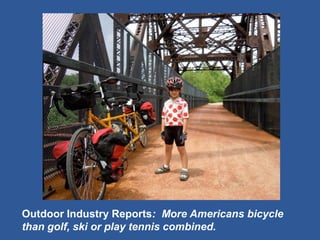
Outdoor Industry Reports: More Americans bicycle than golf, ski or play tennis combined.
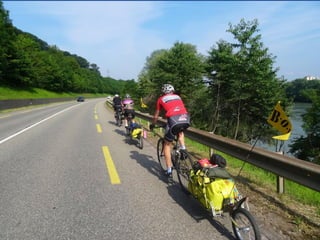
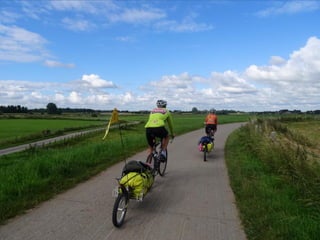
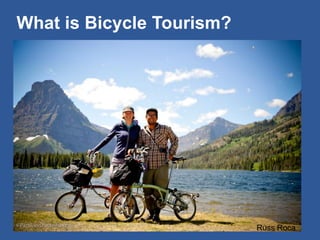
What is Bicycle Tourism? 
Russ Roca
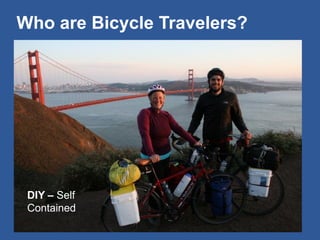
Who are Bicycle Travelers? 
DIY – Self Contained
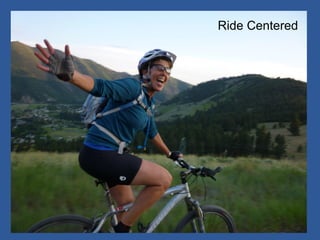
Ride Centered
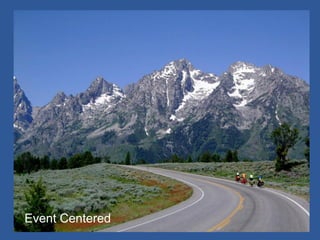
Event Centered
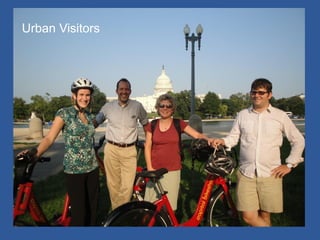
Urban Visitors
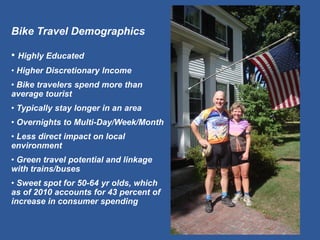
Bike Travel Demographics 
• Highly Educated 
• Higher Discretionary Income 
• Bike travelers spend more than average tourist 
• Typically stay longer in an area 
• Overnights to Multi-Day/Week/Month 
• Less direct impact on local environment 
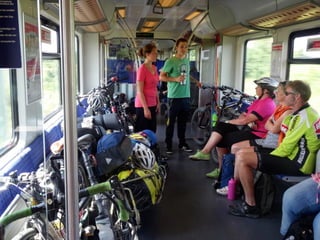
• Green travel potential and linkage with trains/buses 
• Sweet spot for 50-64 yr olds, which as of 2010 accounts for 43 percent of increase in consumer spending
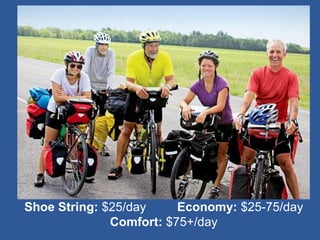
Shoe String: $25/day Economy: $25-75/day 
Comfort: $75+/day
Bike travel and tourism are booming Evidence? 
• Economics 
• Communities 
• Route Networks and Facilities 
• Pubic Relations Investment
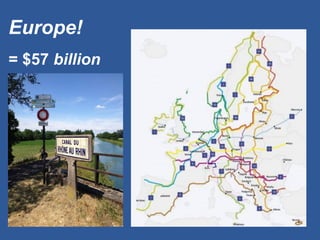
Europe! = $57 billion
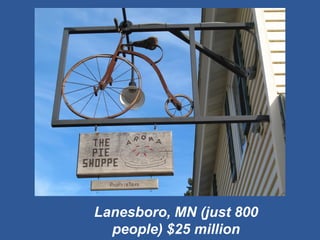
Lanesboro, MN (just 800 people) $25 million
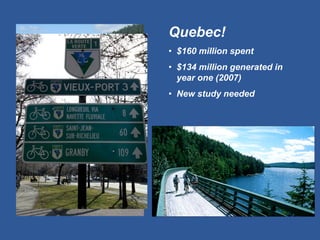
Quebec! 
•$160 million spent 
•$134 million generated in year one (2007) 
•New study needed
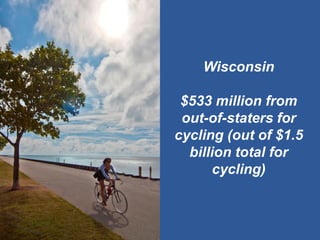
Wisconsin 
$533 million from out-of-staters for cycling (out of $1.5 billion total for cycling)
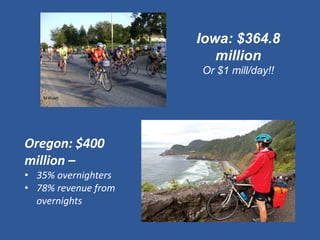
Iowa: $364.8 million 
Or $1 mill/day!! 
M Wyatt 
Oregon: $400 million – 
•35% overnighters 
•78% revenue from overnights
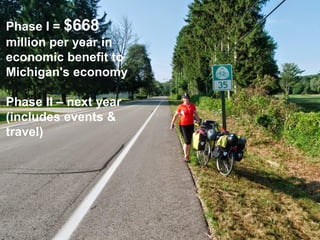
Phase I = $668 million per year in economic benefit to Michigan's economy. 
Phase II – next year (includes events & travel)
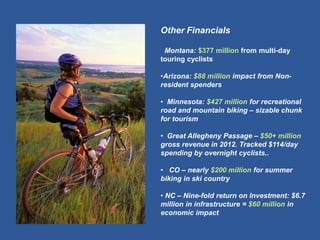
Other Financials Montana: $377 million from multi-day touring cyclists 
•Arizona: $88 million impact from Non- resident spenders 
• Minnesota: $427 million for recreational road and mountain biking – sizable chunk for tourism 
• Great Allegheny Passage – $50+ million gross revenue in 2012. Tracked $114/day spending by overnight cyclists.. 
• CO – nearly $200 million for summer biking in ski country 
• NC – Nine-fold return on Investment: $6.7 million in infrastructure = $60 million in economic impact
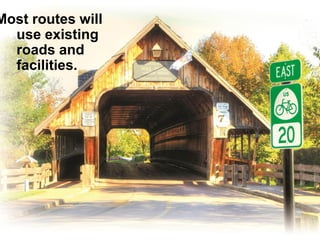
Most routes will use existing roads and facilities.
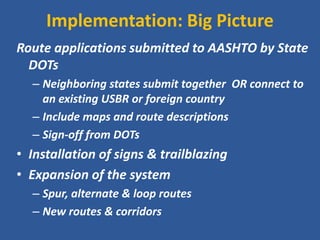
Implementation: Big Picture 
Route applications submitted to AASHTO by State DOTs 
–Neighboring states submit together OR connect to an existing USBR or foreign country 
–Include maps and route descriptions 
–Sign-off from DOTs 
•Installation of signs & trailblazing 
•Expansion of the system 
–Spur, alternate & loop routes 
–New routes & corridors
Implementation: State by State 
•State & local agencies determine best approach 
–Route Identification 
–Road Assessments 
–Coordination with transportation divisions, counties, townships and MPOs 
–Also aligning routes with neighboring states 
•Who Does the Work? 
-Volunteers, bicycle and/or trail advocates 
-Agency staff
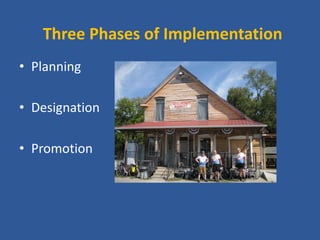
Three Phases of Implementation 
•Planning 
•Designation 
•Promotion
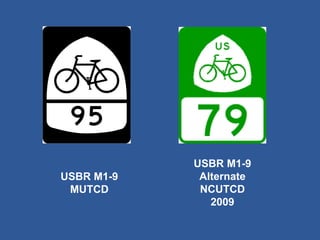
USBR M1-9 MUTCD 
USBR M1-9 Alternate NCUTCD 2009
•AASHTO & Task Force Liaison 
•Corridor Plan Map 
•Meeting Coordination 
•Training & Mapping 
•USBRS Blog & Social Media 
•News & Updates 
•Forums for discussion 
•Tracking benefits 
•Contacts & Stakeholders 
•Future Map Clearinghouse
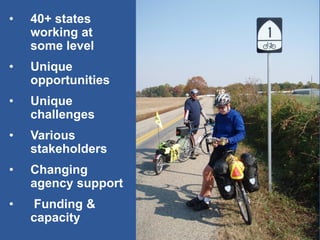
•40+ states working at some level 
•Unique opportunities 
•Unique challenges 
•Various stakeholders 
•Changing agency support 
• Funding & capacity
State Surveys & Case Studies