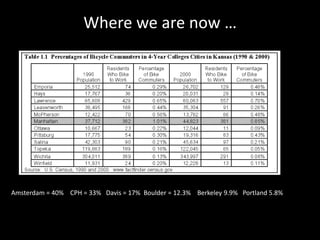
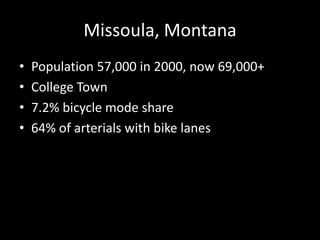
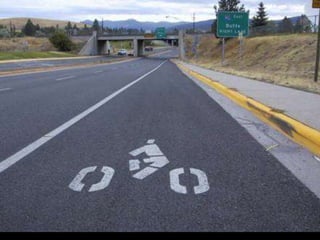
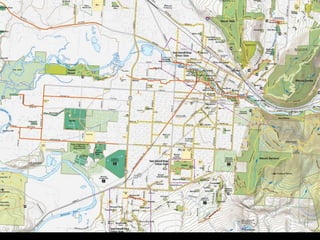
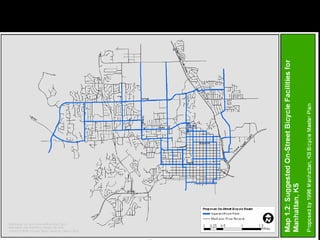
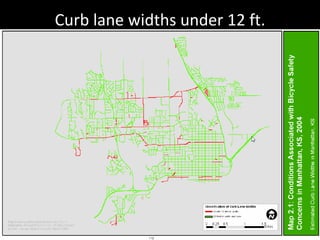
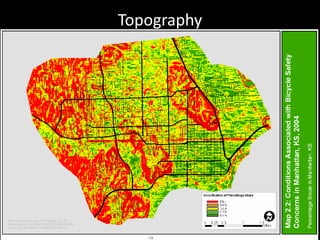
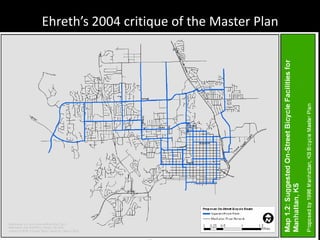
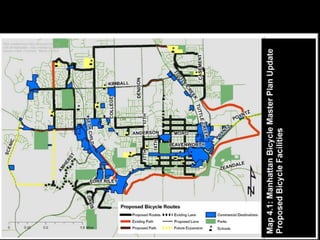
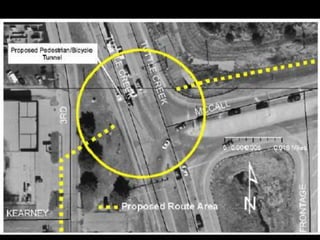
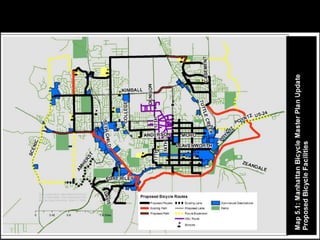
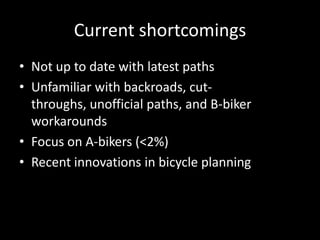
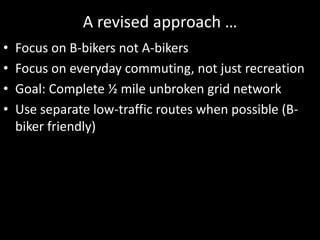
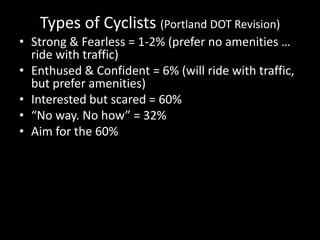
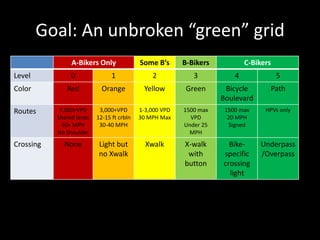
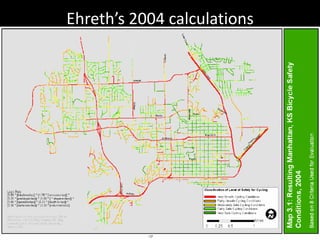
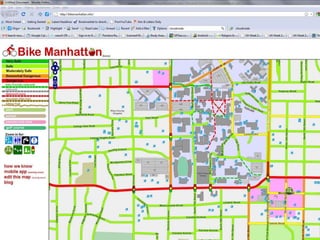
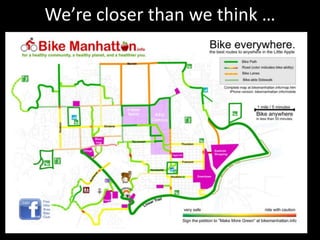
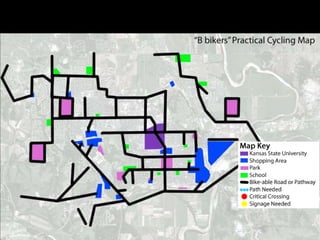
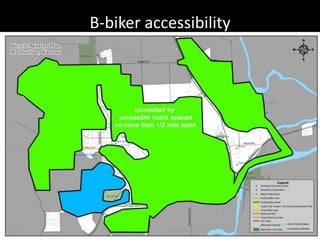
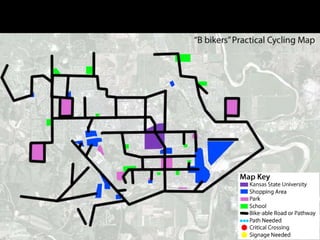
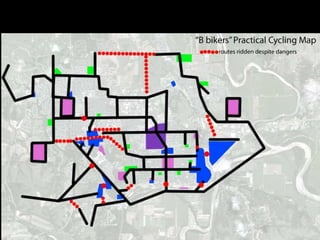
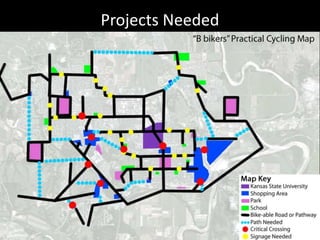
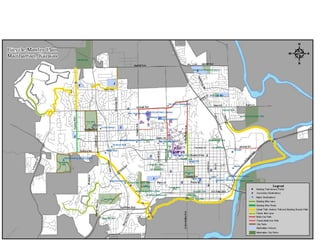
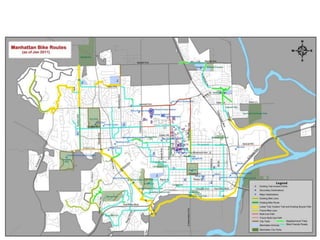
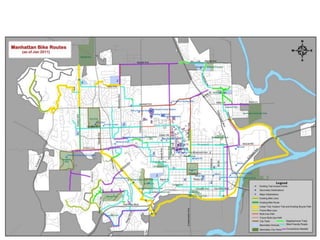
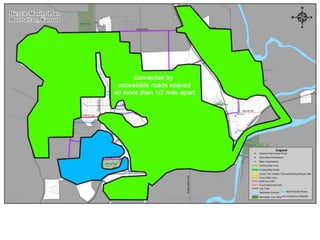
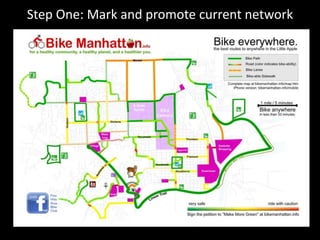
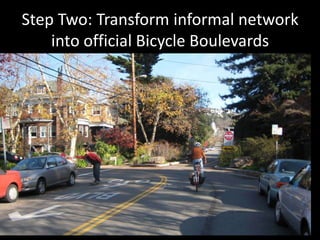
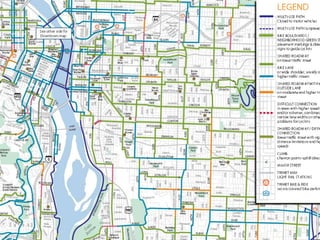
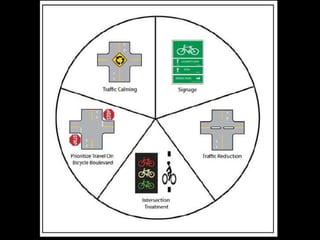
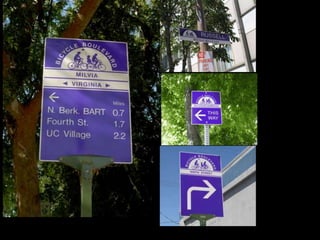
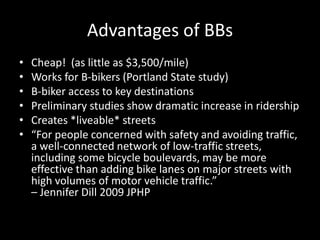
Where we are now …Amsterdam = 40%    CPH = 33%   Davis = 17%  Boulder = 12.3%    Berkeley 9.9%   Portland 5.8%
Missoula, MontanaPopulation 57,000 in 2000, now 69,000+College Town7.2% bicycle mode share64% of arterials with bike lanes
“The Missoula Model”Retrofit streets to max of 3 lanesReplace traffic signals with single lane roundabouts emphasizing bike/walkConnect all bike lanes, sidewalks, and trailsOne street per neighborhood = “green street”Max 25 mph speed in city limitsDouble bus service
1998 Master PlanComplete Linear TrailDevelop inter-city bicycle facilitiesBicycle parkingPolicies for future growth
Types of CyclistsA: operate under most conditions B: casual riders. Prefer low-speed, low-volume streets or paths C: child riders. Require comfortable areas.
1998 plan for completing the bike network“wheel and spokes” concept“All streets should be accessible to bicycle travel.”“An inter-connected network of designated bicycle routes – spokes – should be developed throughout the community.”“ideally, a rough grid of approximately ¼ - ½ mile spacing”Designated major streets as bicycle routes (College, Browning, Kimball, Poyntz, 14th, Juliette, etc.)
Ehreth’s 2004 critique of the Master Plan
Curb lane widths under 12 ft.
Topography
Traffic Volume
Traffic Speeds
Expert Observations
Final calculations
Ehreth’s 2004 critique of the Master Plan
“on-street road segments suggested by the Master Plan were very unsafe for shared use of bicycles and automobiles” – Ben Ehreth 2004
Current shortcomingsNot up to date with latest pathsUnfamiliar with backroads, cut-throughs, unofficial paths, and B-biker workaroundsFocus on A-bikers (<2%)Recent innovations in bicycle planning
A revised approach …Focus on B-bikers not A-bikersFocus on everyday commuting, not just recreationGoal: Complete ½ mile unbroken grid networkUse separate low-traffic routes when possible (B-biker friendly)
Why B-bikers?Over 85% of potential ridersA-Bikers will ride anyway B-bikers not swayed by A-focused improvements
Types of Cyclists (Portland DOT Revision)Strong & Fearless = 1-2% (prefer no amenities … ride with traffic)Enthused & Confident = 6% (will ride with traffic, but prefer amenities)Interested but scared = 60%“No way. No how” = 32%Aim for the 60%
“safe and comfortable”
Goal: An unbroken “green” grid
Ehreth’s 2004 calculations
Adding Points of Interests (POIs)with an iPhone using Mapzen
Sharing Tracks on iPhone
OSMTracker for Android
We’re closer than we think …
B-biker accessibility
Projects Needed
How do we get there?
Step One: Mark and promote current network
Step Two: Transform informal network into official Bicycle Boulevards
12 miles needed=$56,000 for signs$30,000 for road markingsMore for signals, etc. if needed
9th & Houston
Advantages of BBsCheap!  (as little as $3,500/mile)Works for B-bikers (Portland State study)B-biker access to key destinationsPreliminary studies show dramatic increase in ridership Creates *liveable* streets“For people concerned with safety and avoiding traffic, a well-connected network of low-traffic streets, including some bicycle boulevards, may be more effective than adding bike lanes on major streets with high volumes of motor vehicle traffic.” – Jennifer Dill 2009 JPHP
But they don’t solve all our problems …
Still needed2.5 miles of essential trails (Hayes, Anderson, Poliska, Miller Ranch – Anneberg, etc.)2 miles of recommended trails2 miles of recreational trail (N. Linear)6 crossings of “the beltway”A few other intersection/crossing improvements
Setting Specific Priorities: Garden City example
Austin Model (1,600 projects!)
The Manhattan Formula# of key destinations served by routex # of people served by that routex level of improvement of that route+ “network score” which =1,000s of people brought into network+ centrality of the improvement+ miles of bike-able routes it adds to network/ total cost = Impact per Dollar
Improvement MatrixOther notes:Bike Lanes = +1Soft Surface => Hard Surface = +1Smooth Surface => +1(Soft => Smooth = +2)Sidewalk = Street Score +1 (min.2)
Current priorities posted on city website
Summary of suggested revisionsCurrent Master PlanSuggested Revisionsbike lanes on core major arterials, complete Linear TrailBike lanes on outer arterials (including roads with existing multi-use paths)Bike lanes in new developmentsBicycle boulevards(BBs), complete core connections (will increase ridership)Complete outer connections using short multi-use paths connecting living streets / BBs.With money saved, dream big.   Manhattan Greenway Project.(Update code to include requirement for BB/connections every 2,000 feet in new developments.  Culdesacs must have pedestrian/bicycle connectivity.
Additional slides from Talbert & Vickrey for brainstorming session
Manhattan Kansas Bicycle Master Plan Revision

Manhattan Kansas Bicycle Master Plan Revision

  • 2.
    Where we arenow …Amsterdam = 40% CPH = 33% Davis = 17% Boulder = 12.3% Berkeley 9.9% Portland 5.8%
  • 3.
    Missoula, MontanaPopulation 57,000in 2000, now 69,000+College Town7.2% bicycle mode share64% of arterials with bike lanes
  • 11.
    “The Missoula Model”Retrofitstreets to max of 3 lanesReplace traffic signals with single lane roundabouts emphasizing bike/walkConnect all bike lanes, sidewalks, and trailsOne street per neighborhood = “green street”Max 25 mph speed in city limitsDouble bus service
  • 12.
    1998 Master PlanCompleteLinear TrailDevelop inter-city bicycle facilitiesBicycle parkingPolicies for future growth
  • 13.
    Types of CyclistsA:operate under most conditions B: casual riders. Prefer low-speed, low-volume streets or paths C: child riders. Require comfortable areas.
  • 14.
    1998 plan forcompleting the bike network“wheel and spokes” concept“All streets should be accessible to bicycle travel.”“An inter-connected network of designated bicycle routes – spokes – should be developed throughout the community.”“ideally, a rough grid of approximately ¼ - ½ mile spacing”Designated major streets as bicycle routes (College, Browning, Kimball, Poyntz, 14th, Juliette, etc.)
  • 16.
    Ehreth’s 2004 critiqueof the Master Plan
  • 17.
    Curb lane widthsunder 12 ft.
  • 18.
  • 19.
  • 20.
  • 21.
  • 22.
  • 23.
    Ehreth’s 2004 critiqueof the Master Plan
  • 24.
    “on-street road segmentssuggested by the Master Plan were very unsafe for shared use of bicycles and automobiles” – Ben Ehreth 2004
  • 31.
    Current shortcomingsNot upto date with latest pathsUnfamiliar with backroads, cut-throughs, unofficial paths, and B-biker workaroundsFocus on A-bikers (<2%)Recent innovations in bicycle planning
  • 32.
    A revised approach…Focus on B-bikers not A-bikersFocus on everyday commuting, not just recreationGoal: Complete ½ mile unbroken grid networkUse separate low-traffic routes when possible (B-biker friendly)
  • 33.
    Why B-bikers?Over 85%of potential ridersA-Bikers will ride anyway B-bikers not swayed by A-focused improvements
  • 34.
    Types of Cyclists(Portland DOT Revision)Strong & Fearless = 1-2% (prefer no amenities … ride with traffic)Enthused & Confident = 6% (will ride with traffic, but prefer amenities)Interested but scared = 60%“No way. No how” = 32%Aim for the 60%
  • 36.
  • 37.
    Goal: An unbroken“green” grid
  • 38.
  • 42.
    Adding Points ofInterests (POIs)with an iPhone using Mapzen
  • 43.
  • 44.
  • 50.
  • 52.
  • 55.
  • 60.
    How do weget there?
  • 61.
    Step One: Markand promote current network
  • 62.
    Step Two: Transforminformal network into official Bicycle Boulevards
  • 69.
    12 miles needed=$56,000for signs$30,000 for road markingsMore for signals, etc. if needed
  • 71.
  • 75.
    Advantages of BBsCheap! (as little as $3,500/mile)Works for B-bikers (Portland State study)B-biker access to key destinationsPreliminary studies show dramatic increase in ridership Creates *liveable* streets“For people concerned with safety and avoiding traffic, a well-connected network of low-traffic streets, including some bicycle boulevards, may be more effective than adding bike lanes on major streets with high volumes of motor vehicle traffic.” – Jennifer Dill 2009 JPHP
  • 76.
    But they don’tsolve all our problems …
  • 77.
    Still needed2.5 milesof essential trails (Hayes, Anderson, Poliska, Miller Ranch – Anneberg, etc.)2 miles of recommended trails2 miles of recreational trail (N. Linear)6 crossings of “the beltway”A few other intersection/crossing improvements
  • 78.
    Setting Specific Priorities:Garden City example
  • 79.
  • 80.
    The Manhattan Formula#of key destinations served by routex # of people served by that routex level of improvement of that route+ “network score” which =1,000s of people brought into network+ centrality of the improvement+ miles of bike-able routes it adds to network/ total cost = Impact per Dollar
  • 81.
    Improvement MatrixOther notes:BikeLanes = +1Soft Surface => Hard Surface = +1Smooth Surface => +1(Soft => Smooth = +2)Sidewalk = Street Score +1 (min.2)
  • 84.
  • 86.
    Summary of suggestedrevisionsCurrent Master PlanSuggested Revisionsbike lanes on core major arterials, complete Linear TrailBike lanes on outer arterials (including roads with existing multi-use paths)Bike lanes in new developmentsBicycle boulevards(BBs), complete core connections (will increase ridership)Complete outer connections using short multi-use paths connecting living streets / BBs.With money saved, dream big. Manhattan Greenway Project.(Update code to include requirement for BB/connections every 2,000 feet in new developments. Culdesacs must have pedestrian/bicycle connectivity.
  • 87.
    Additional slides fromTalbert & Vickrey for brainstorming session