Download to read offline

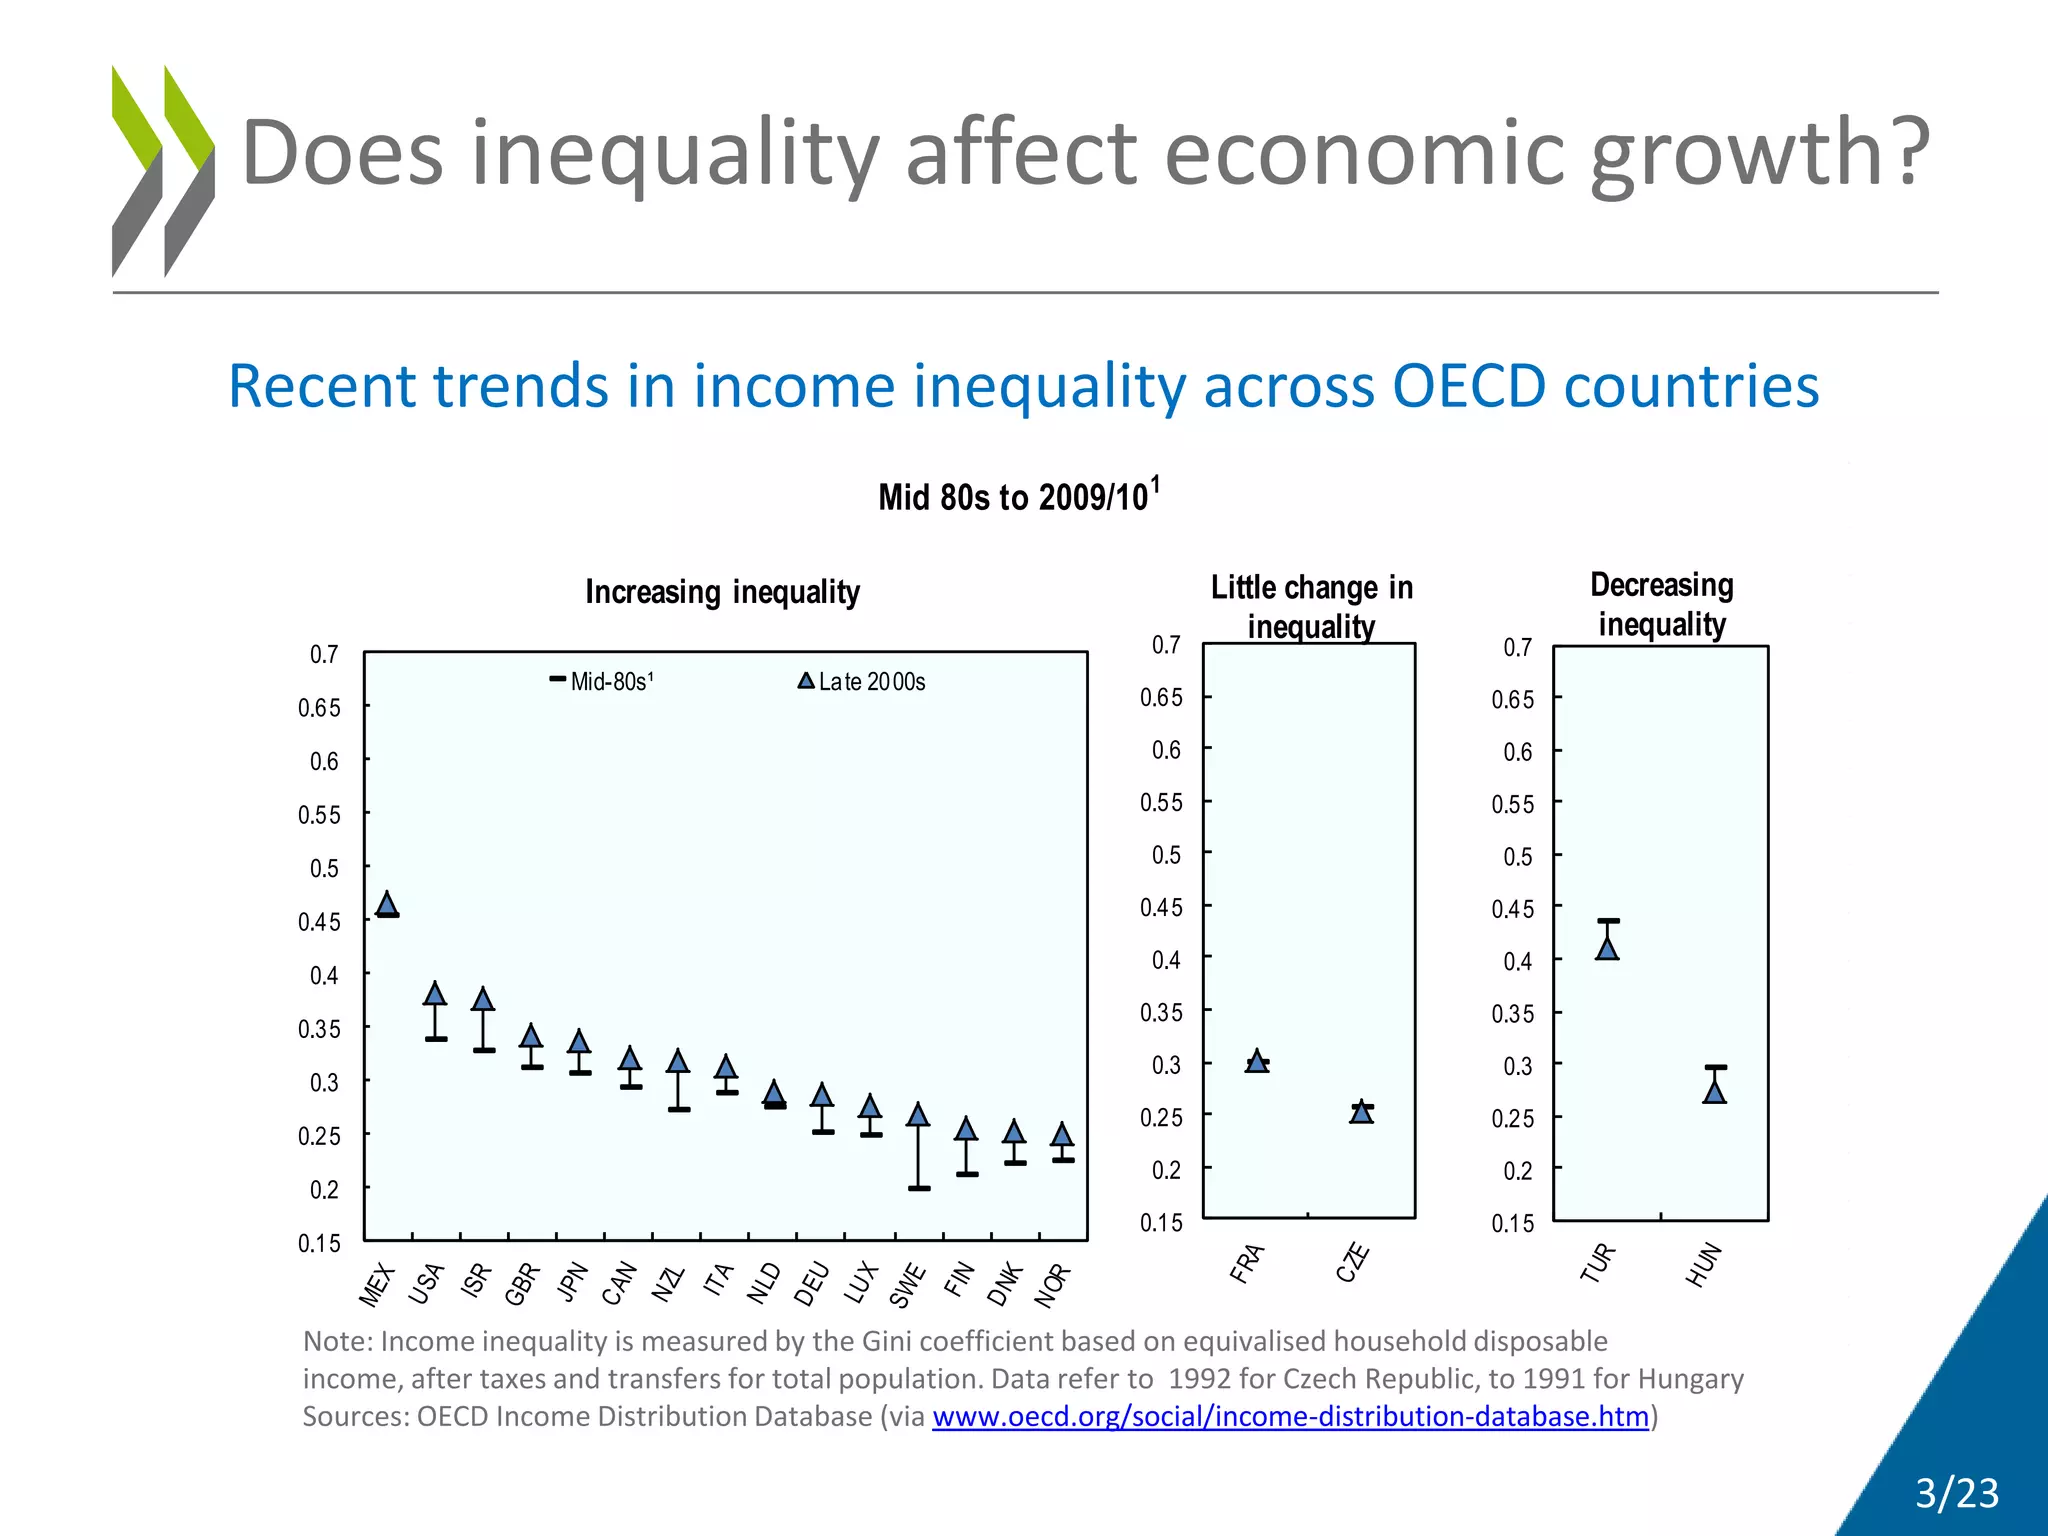
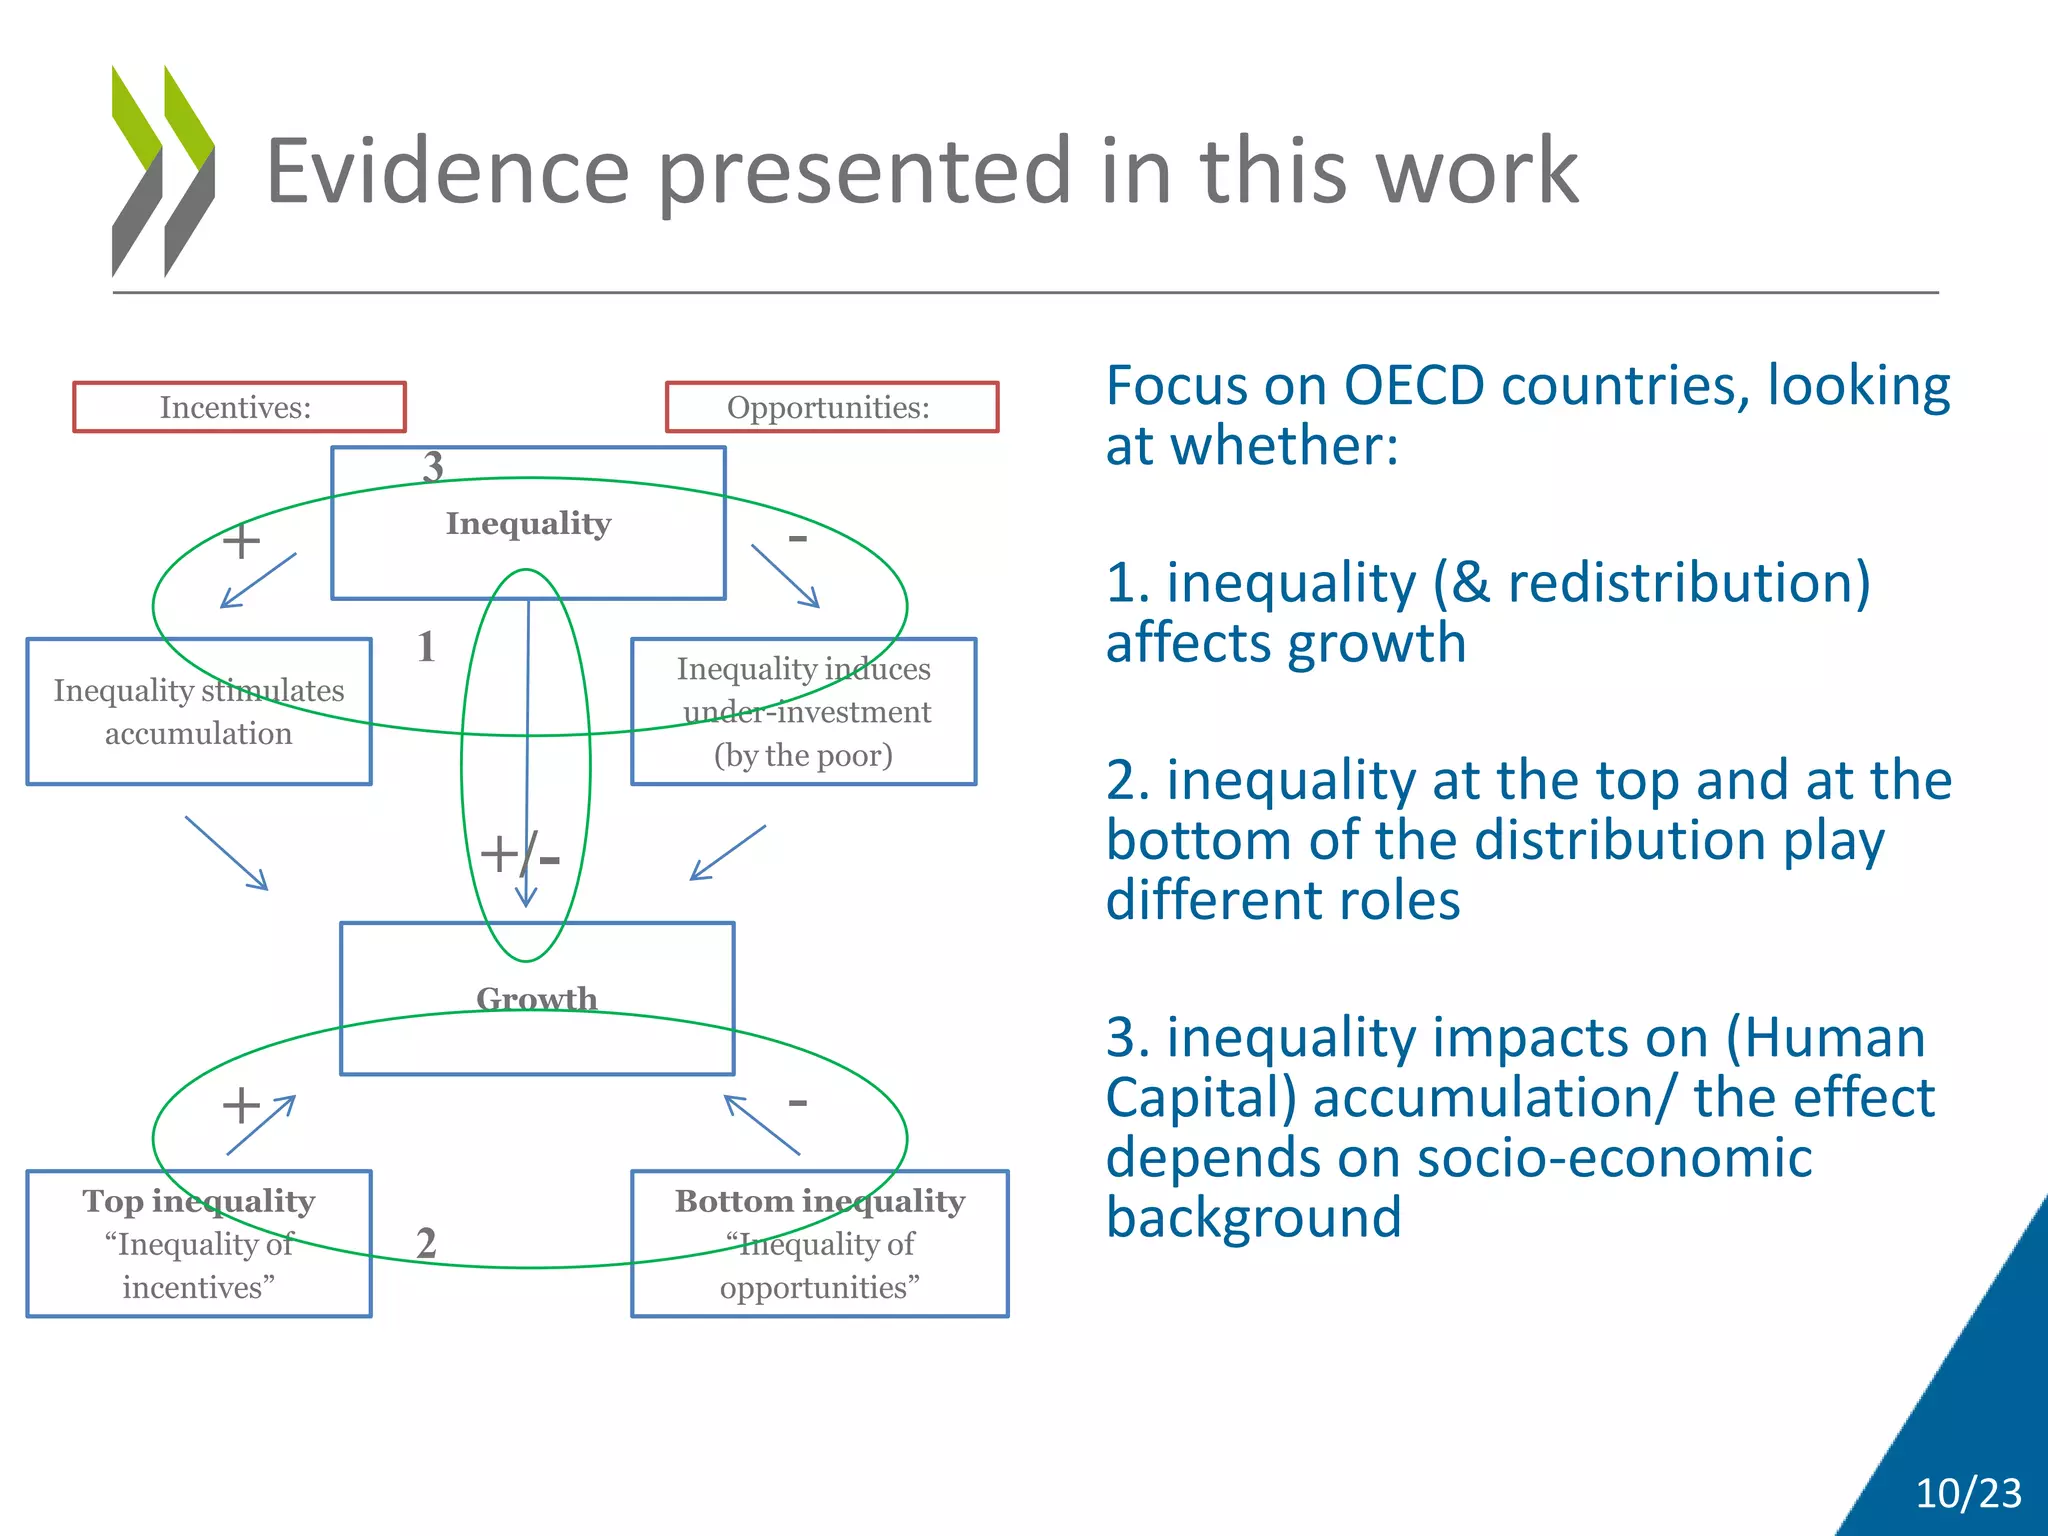
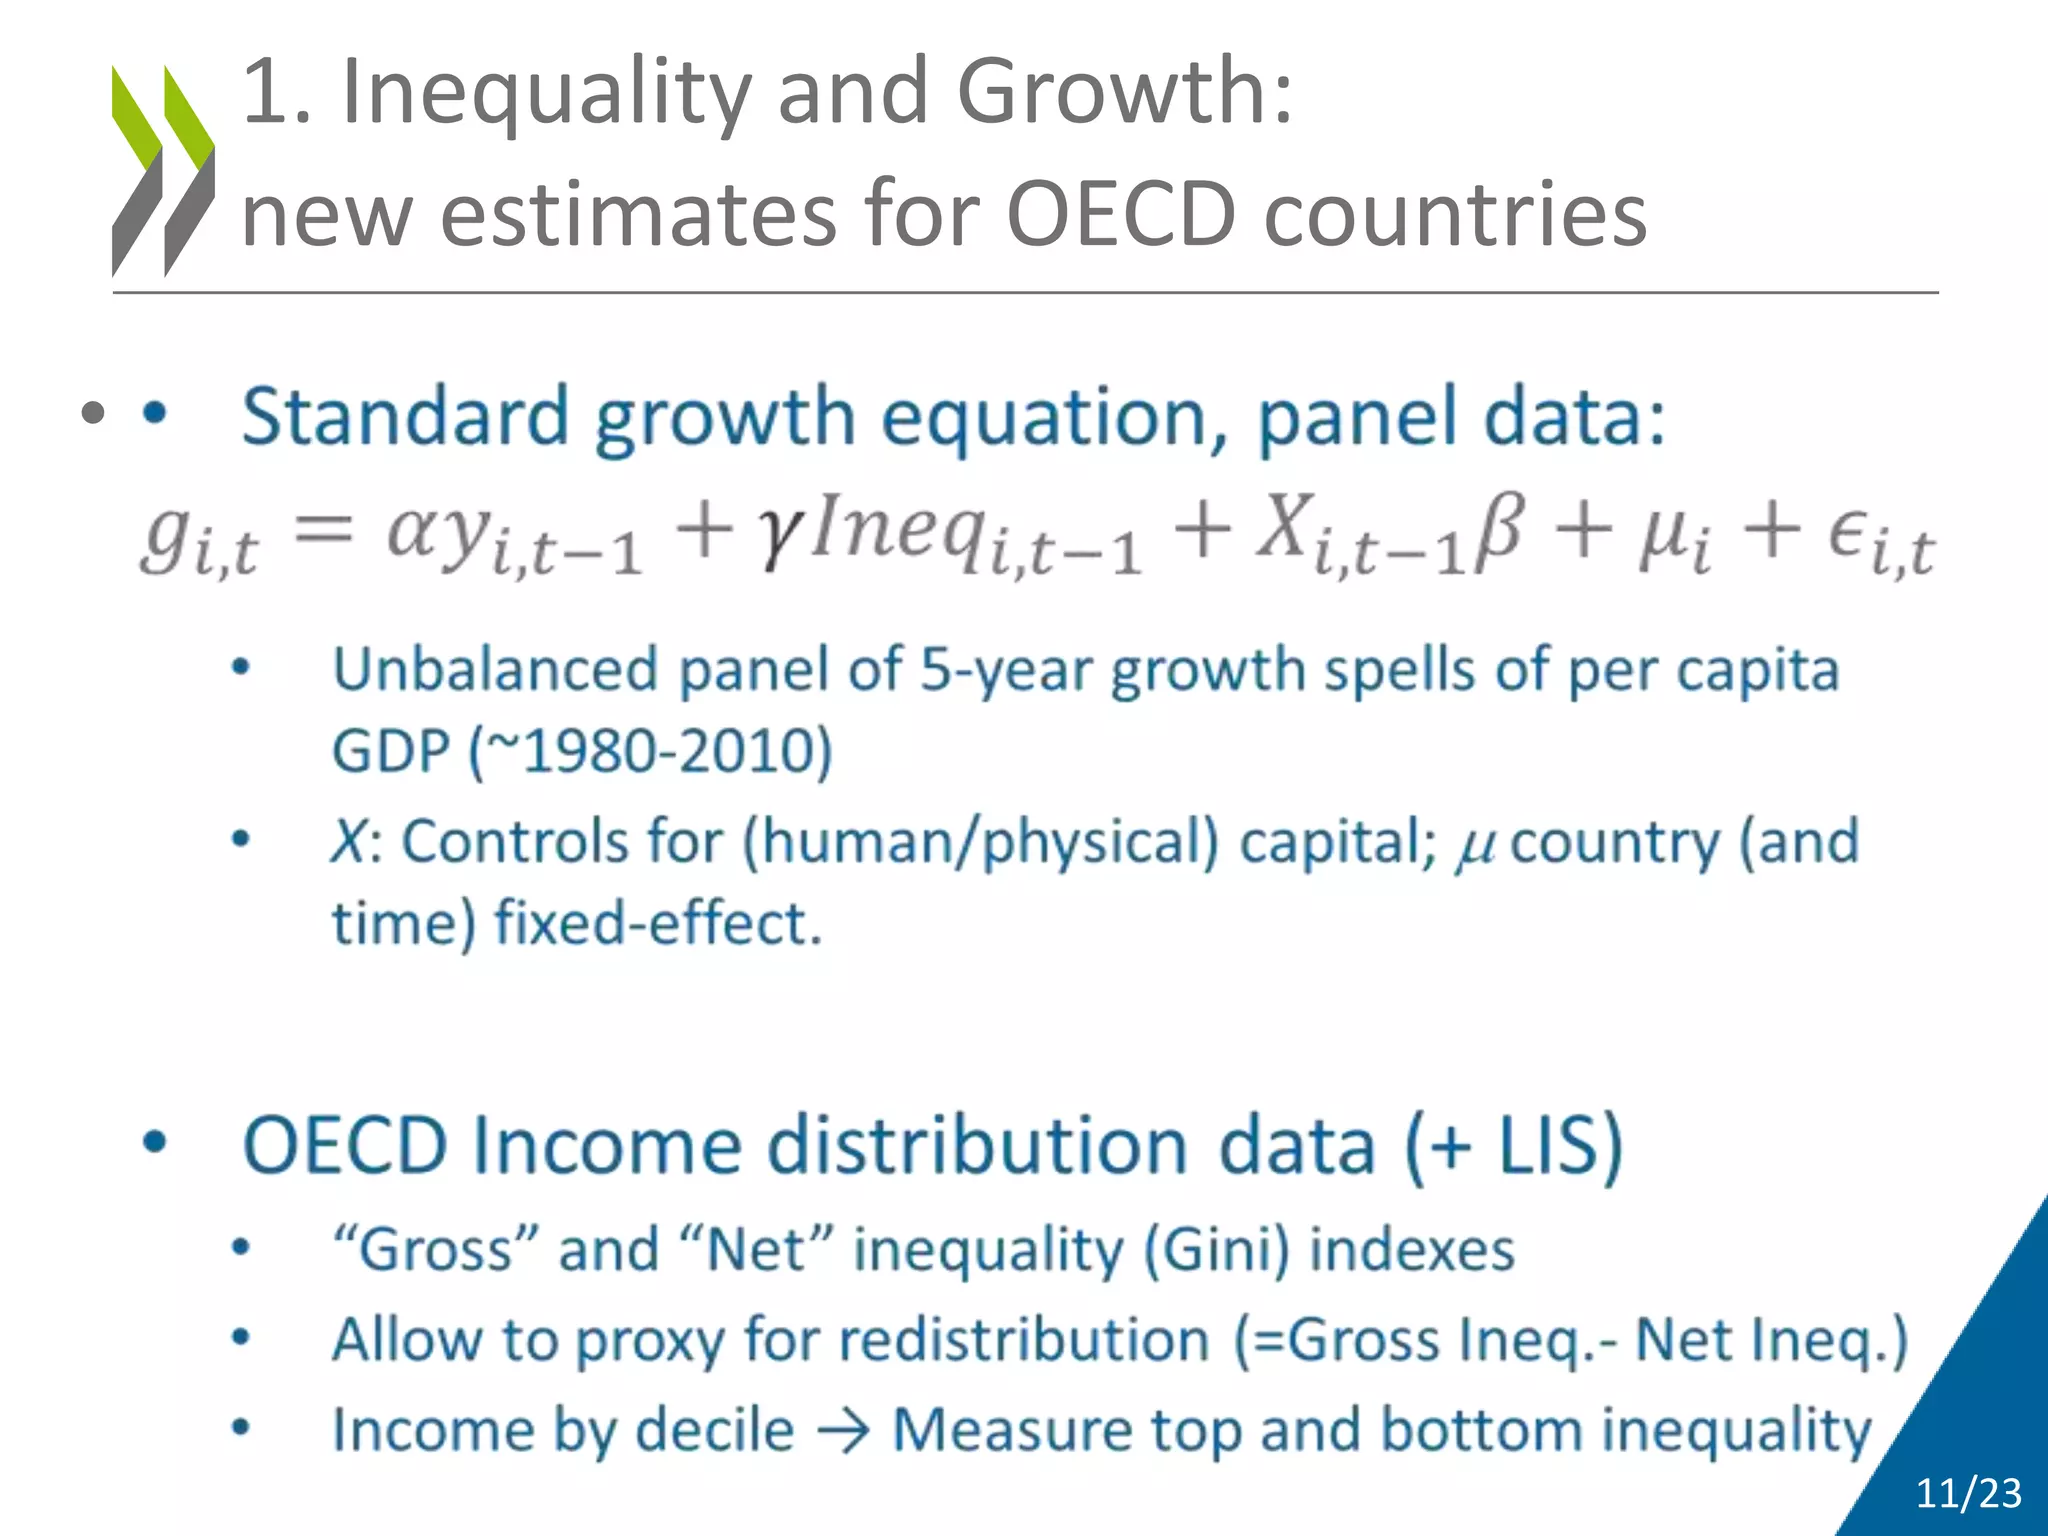
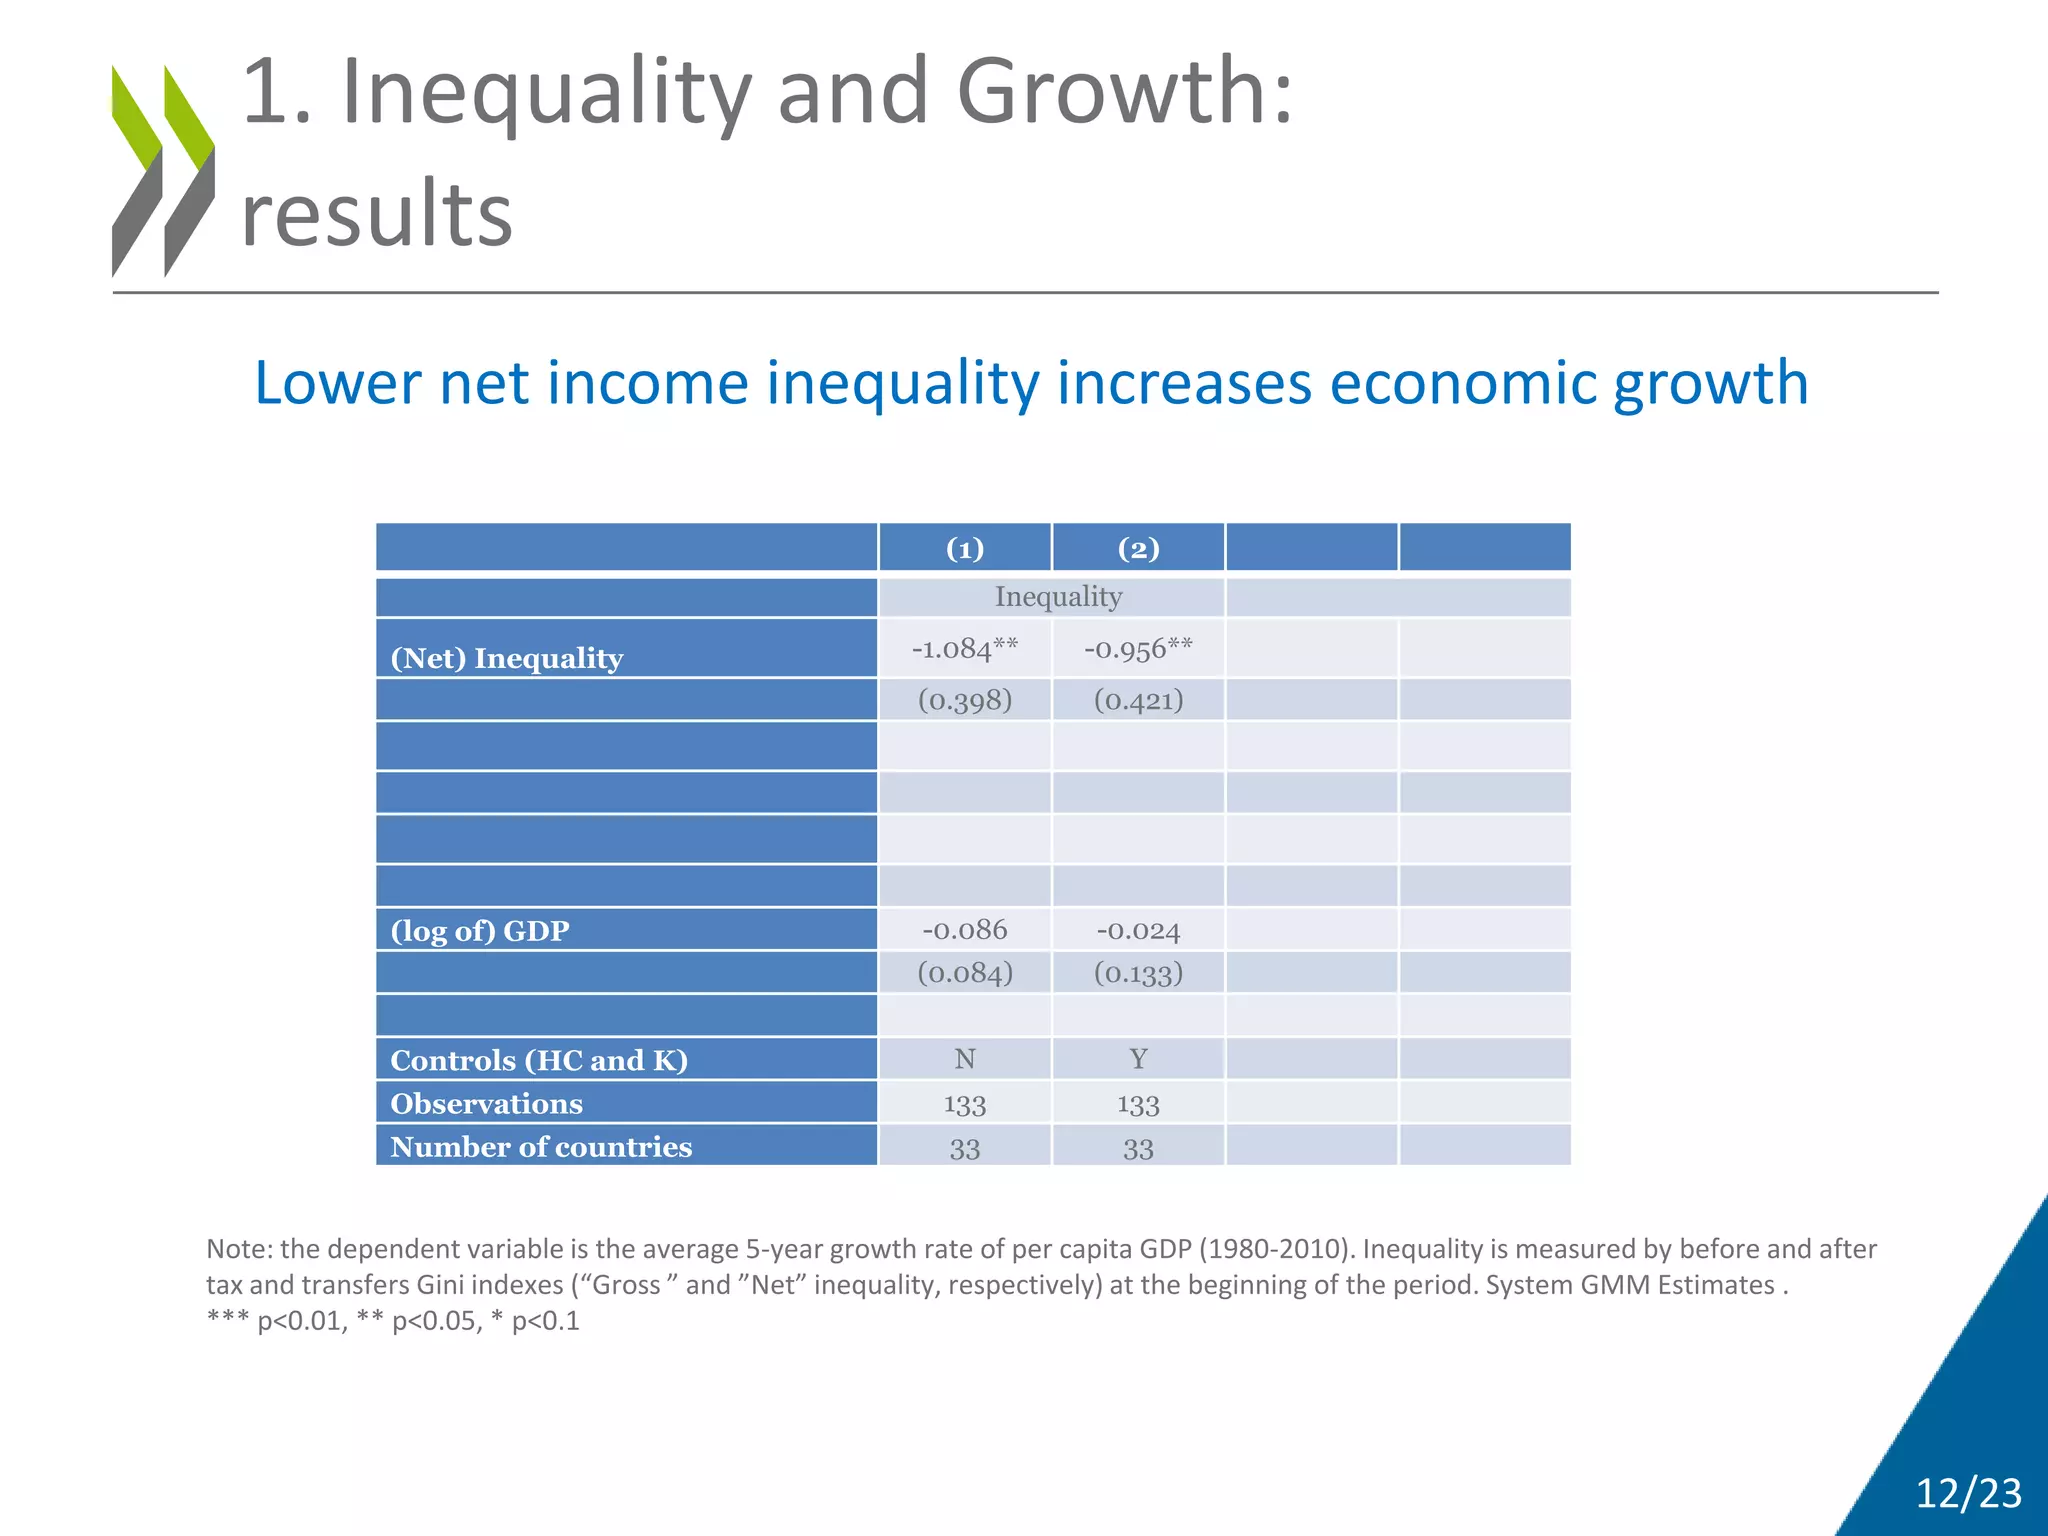
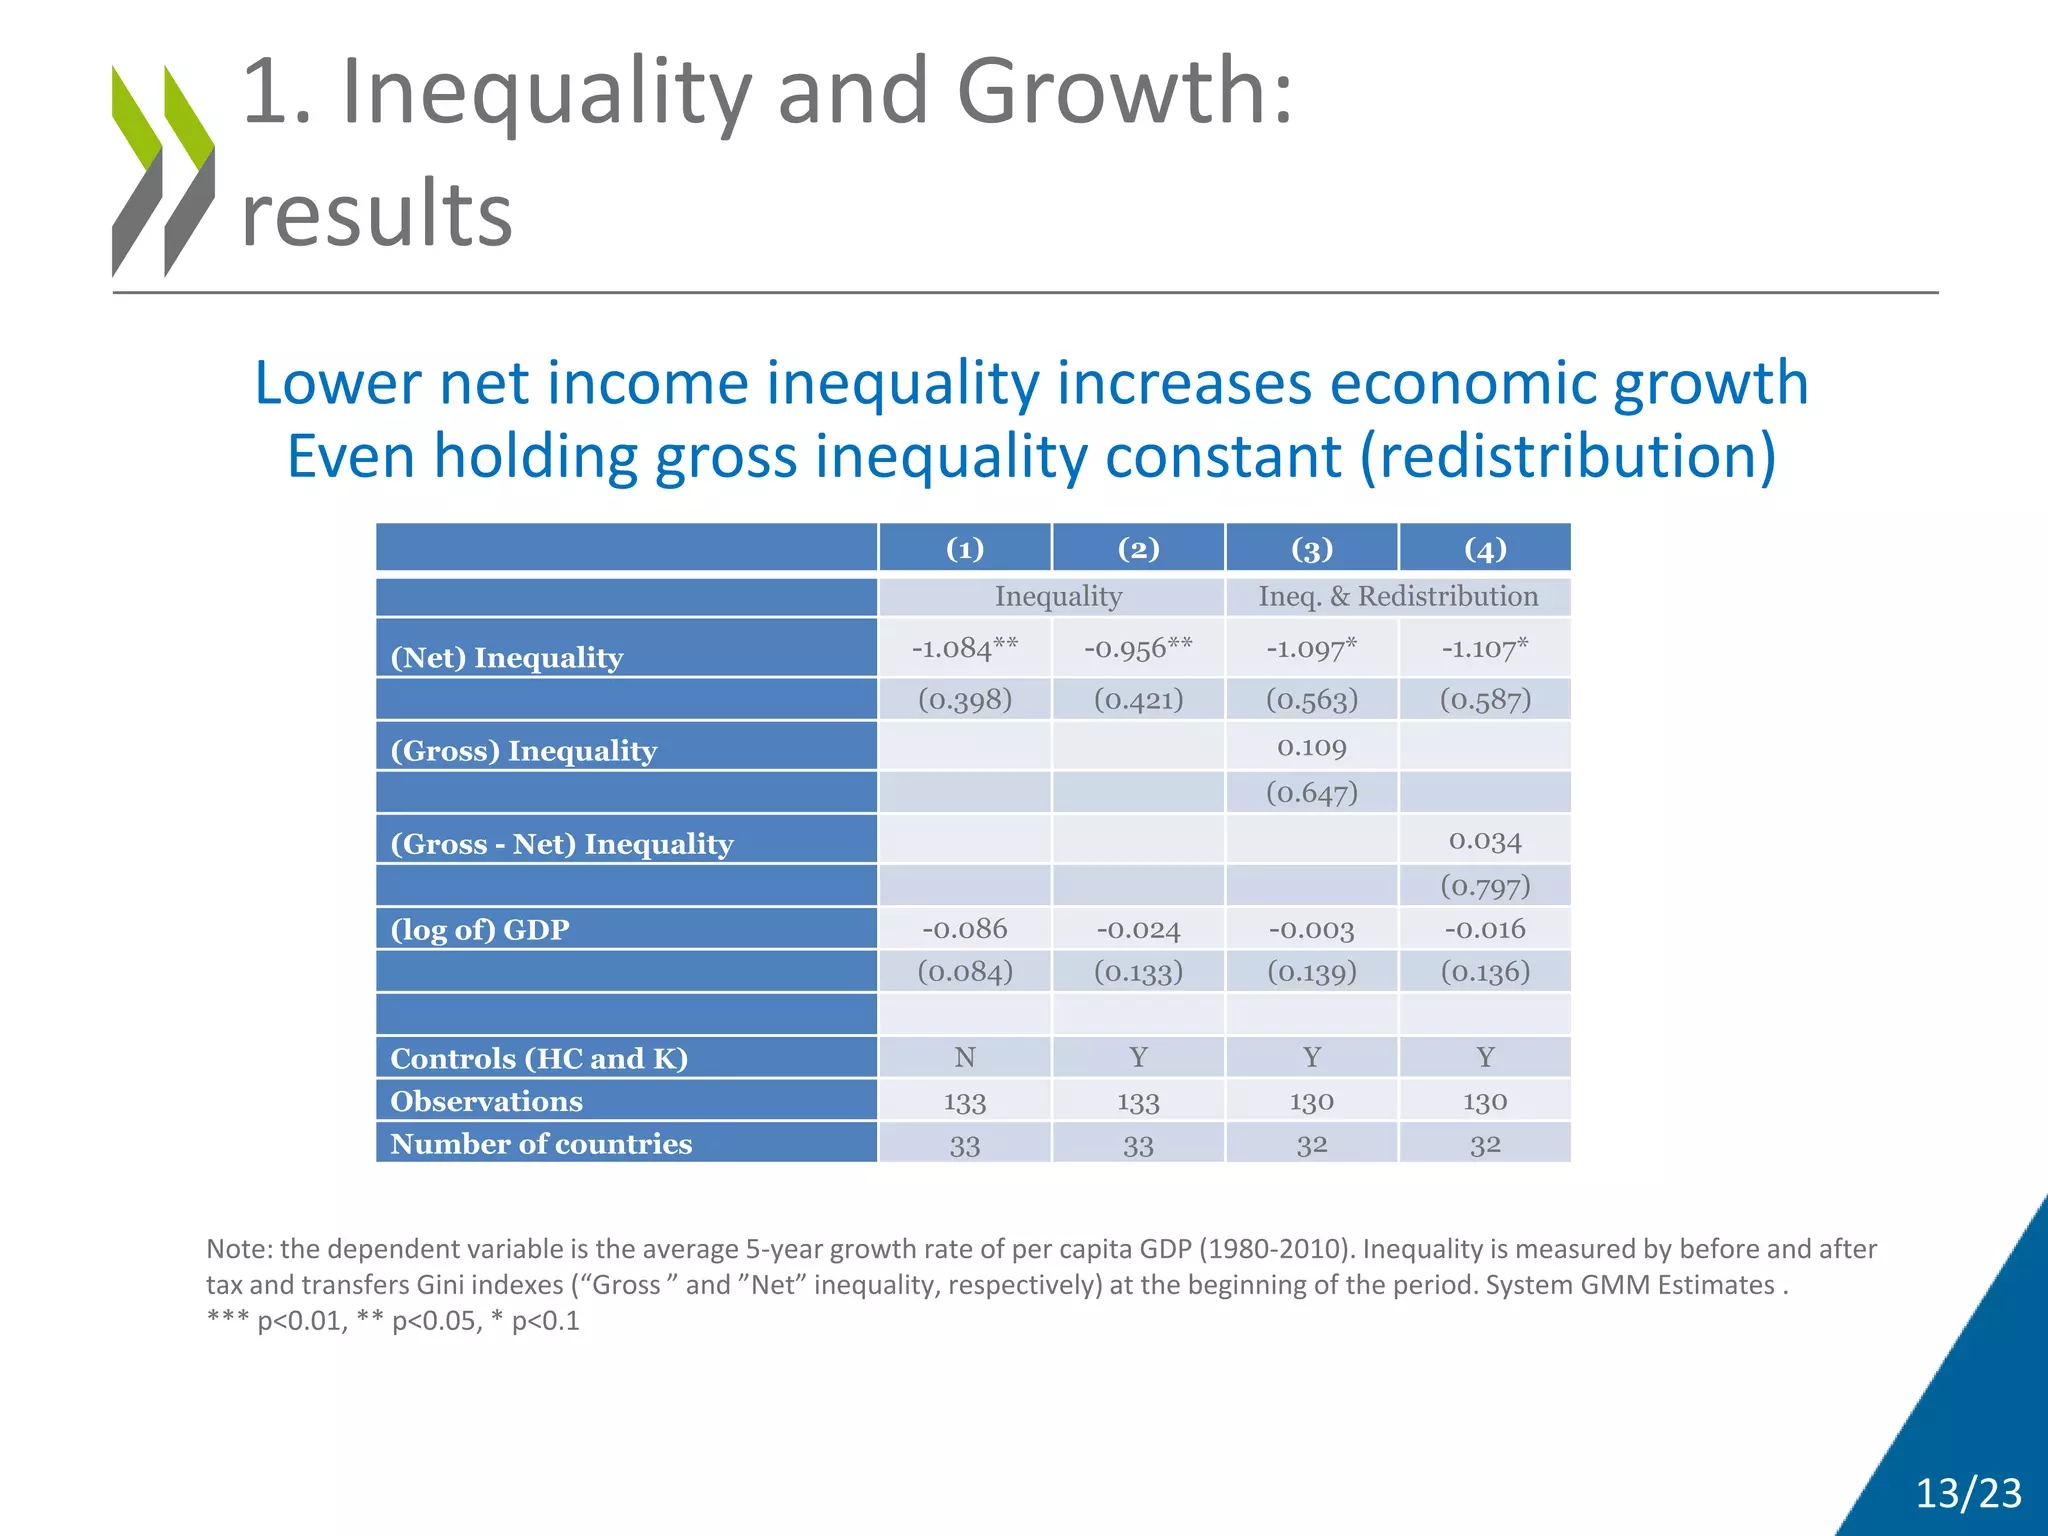
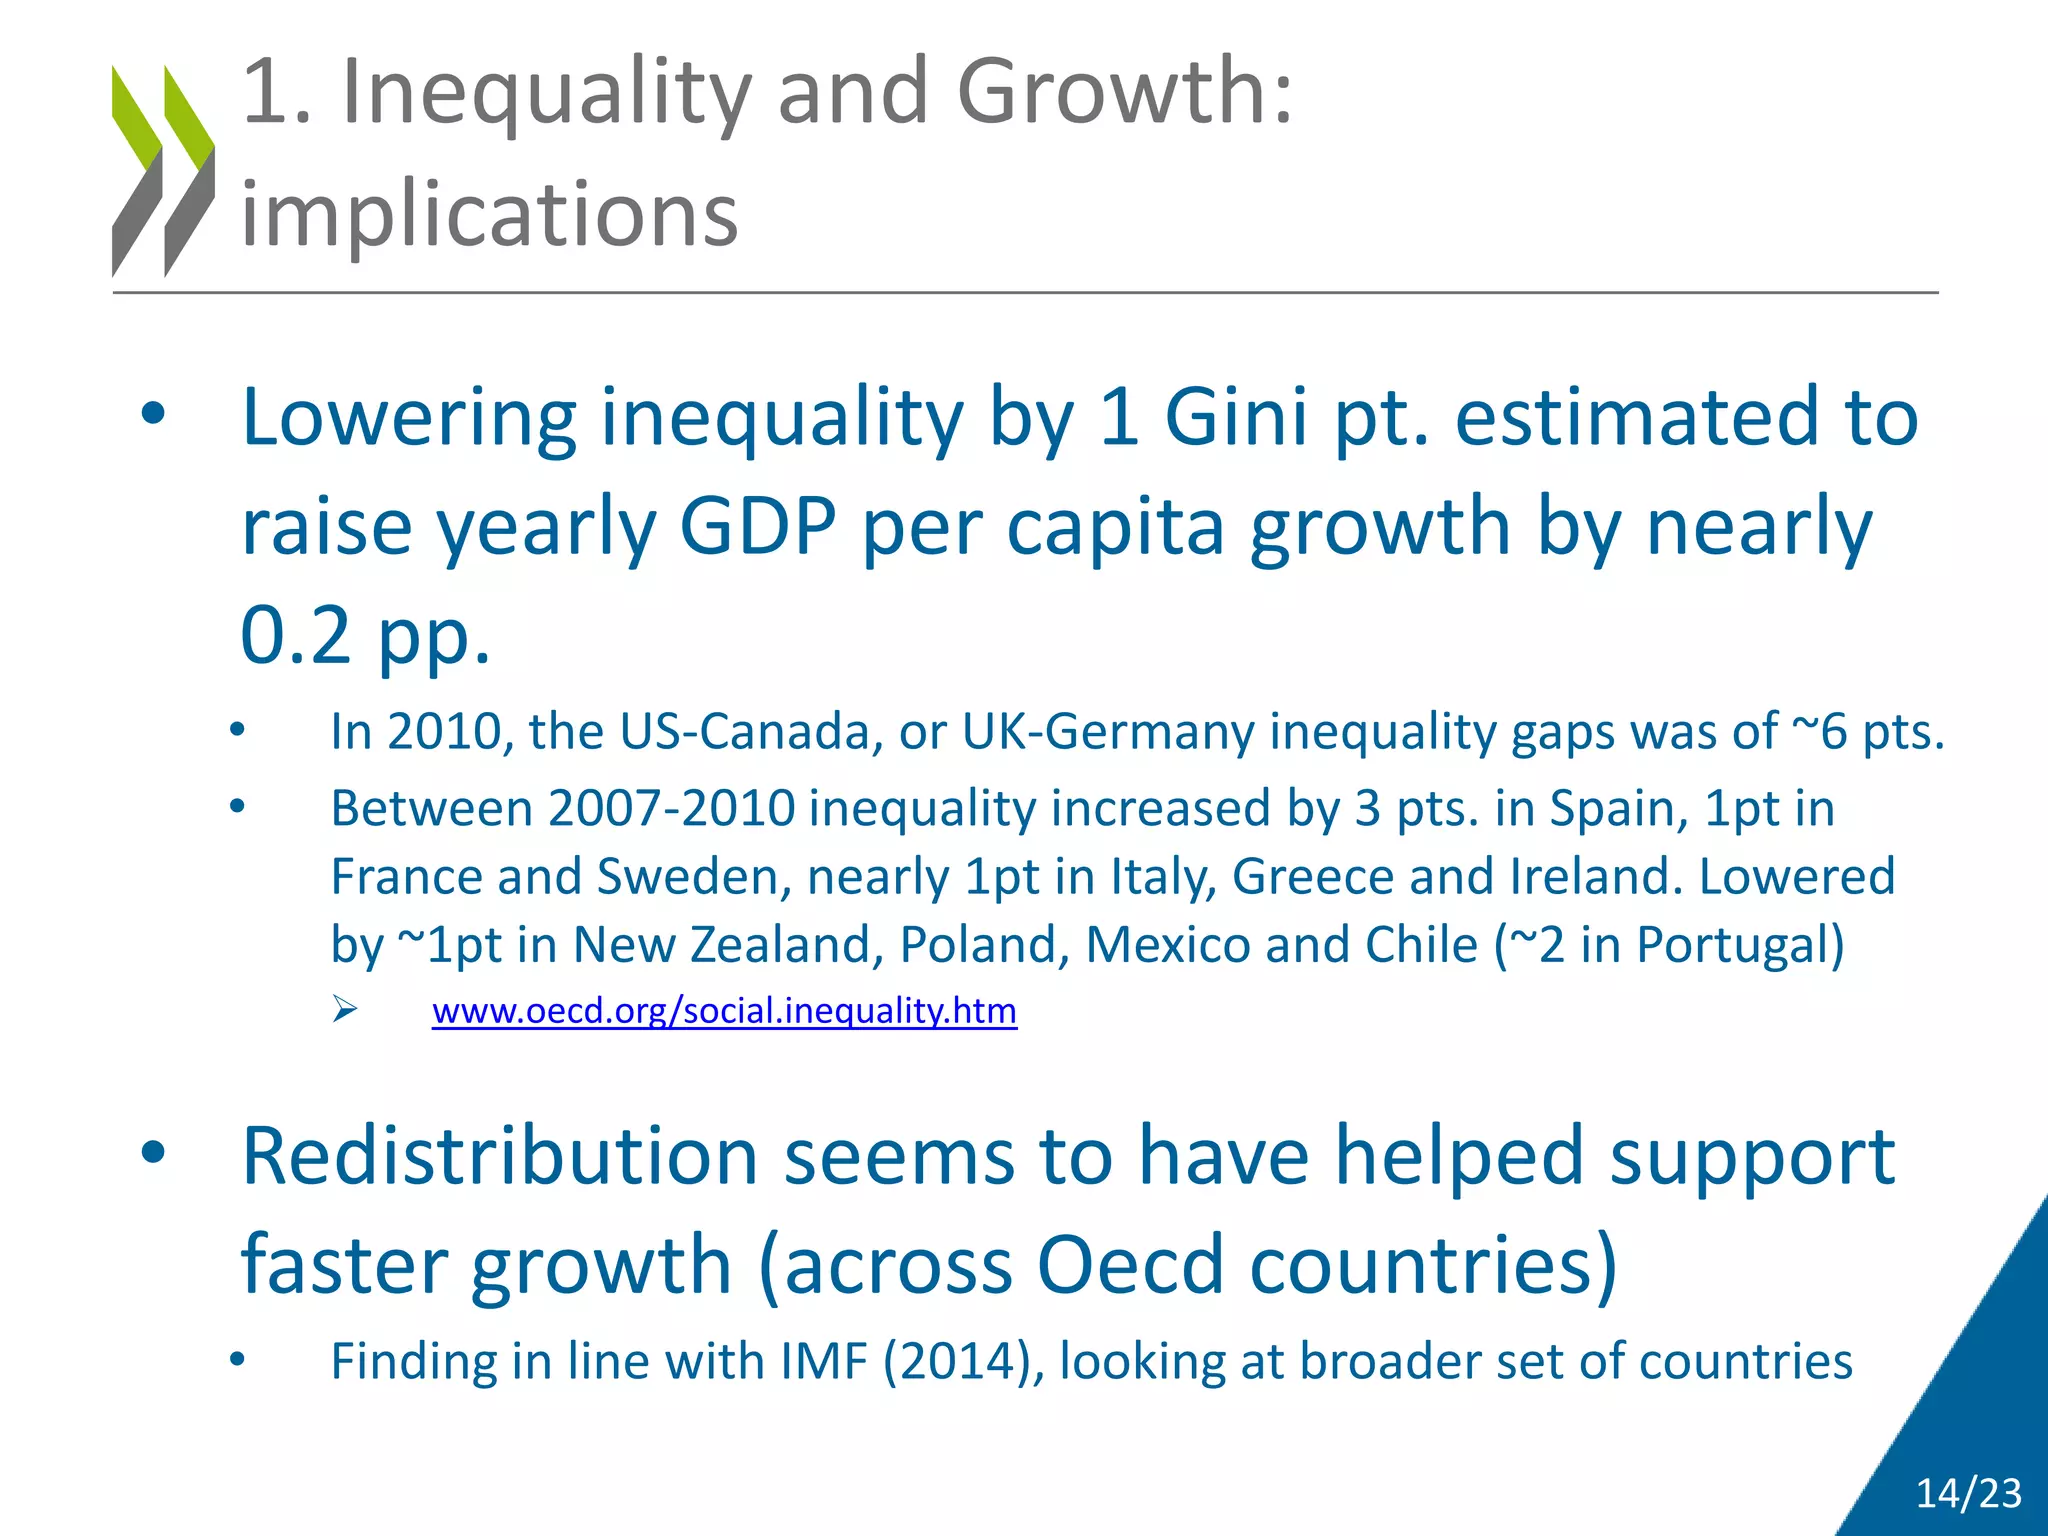
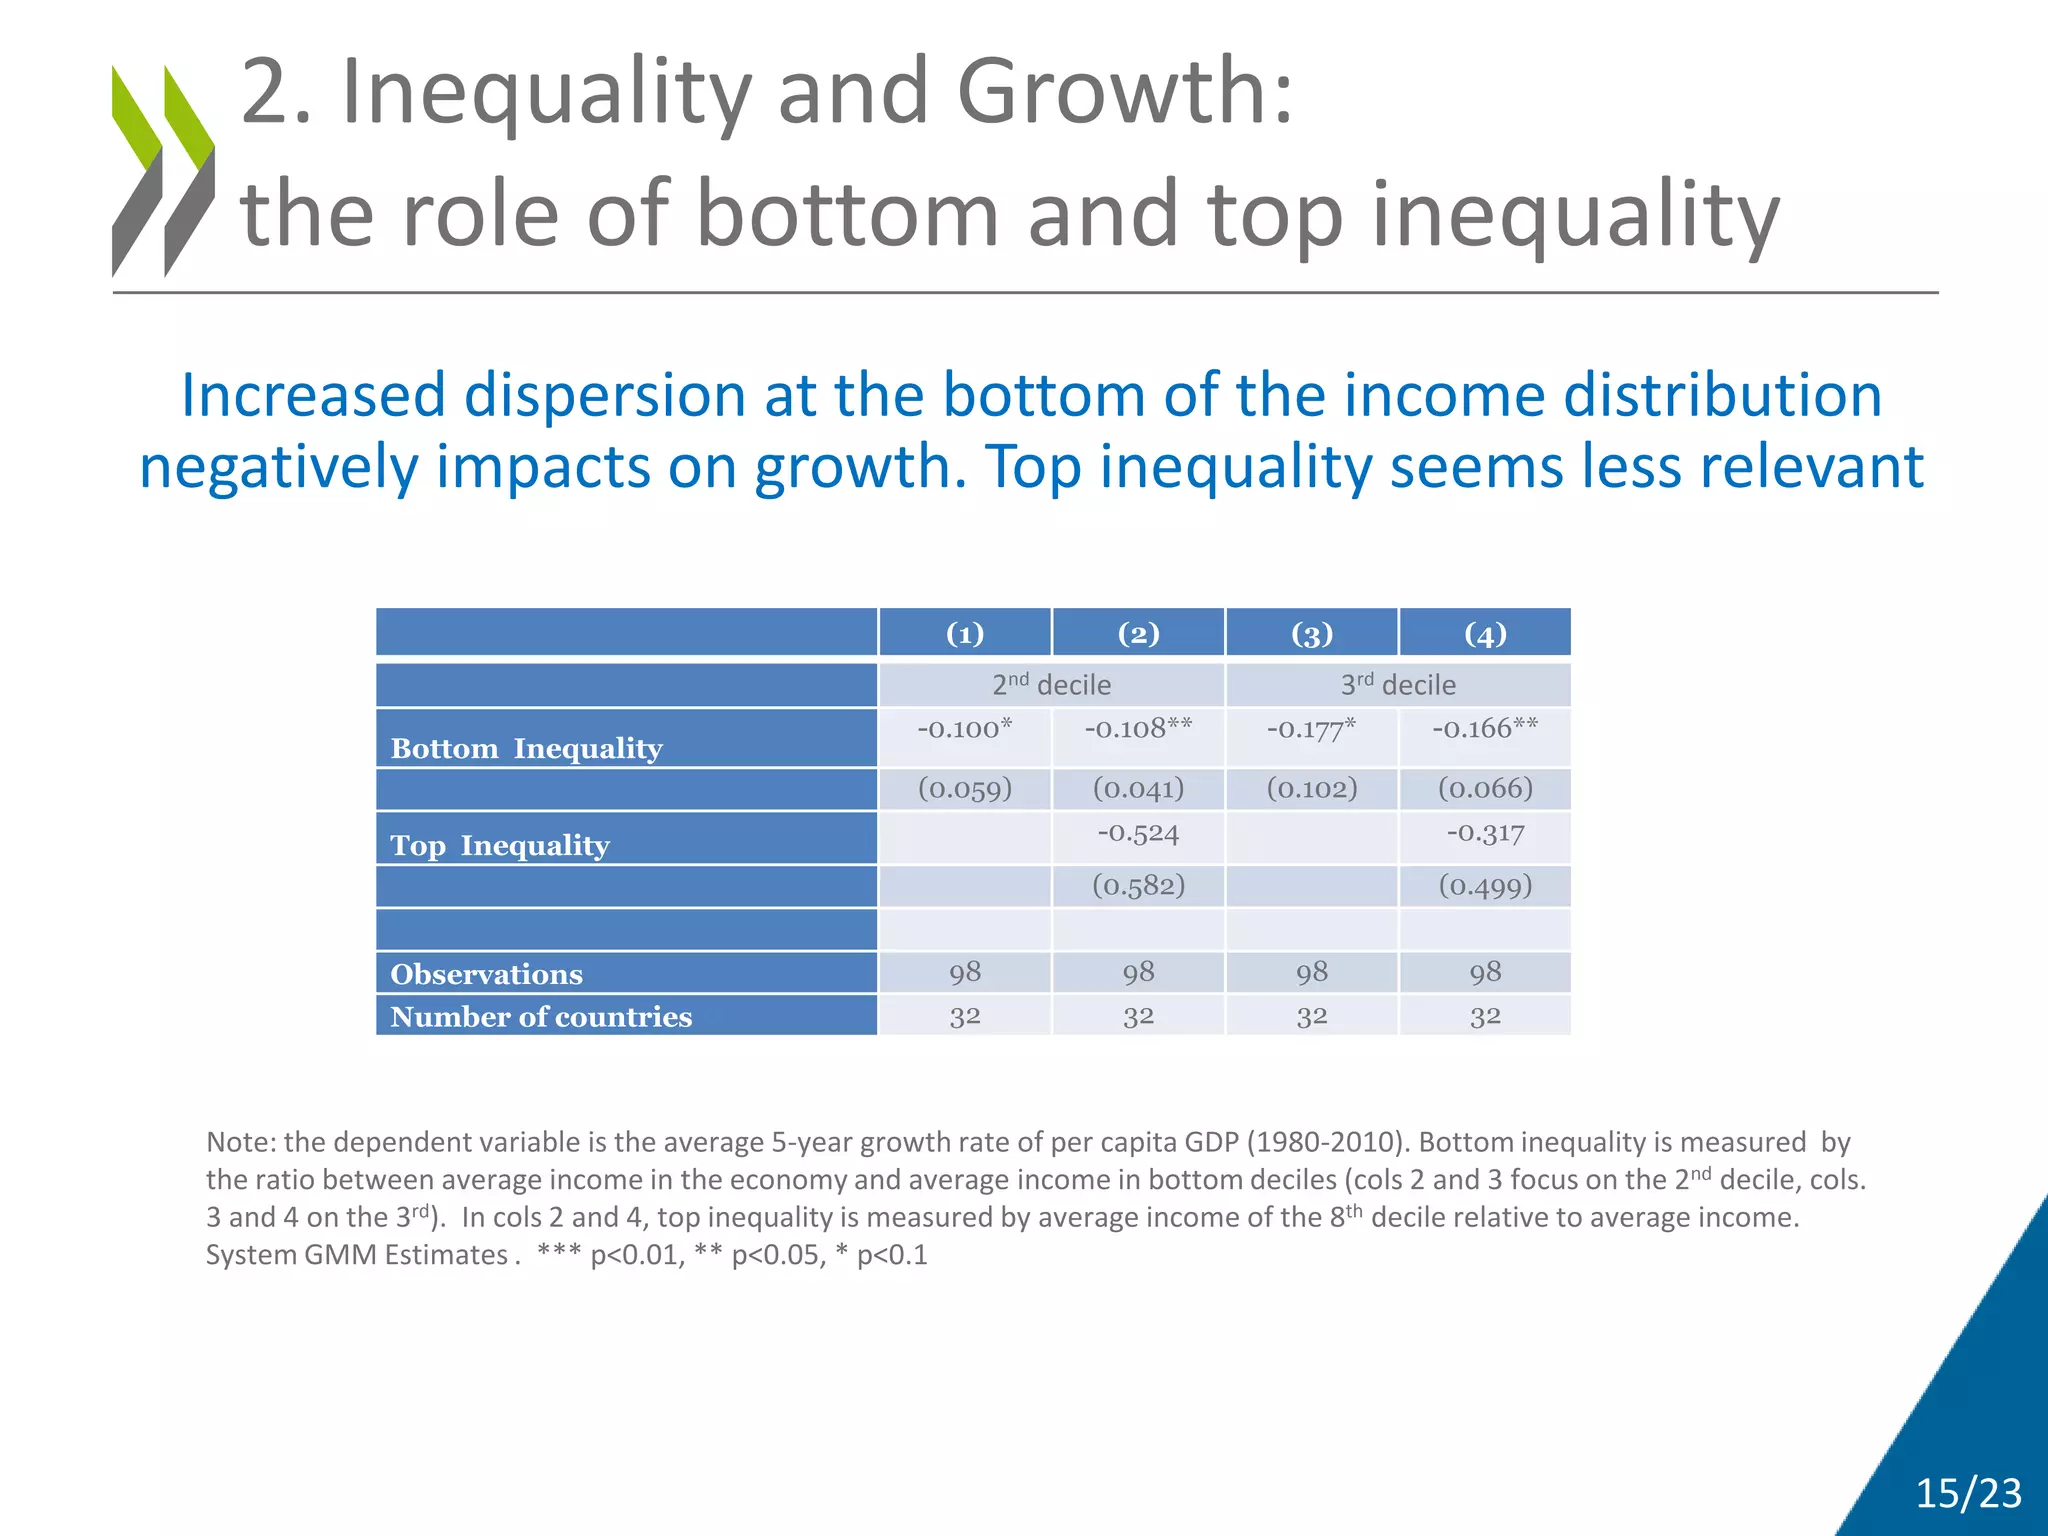
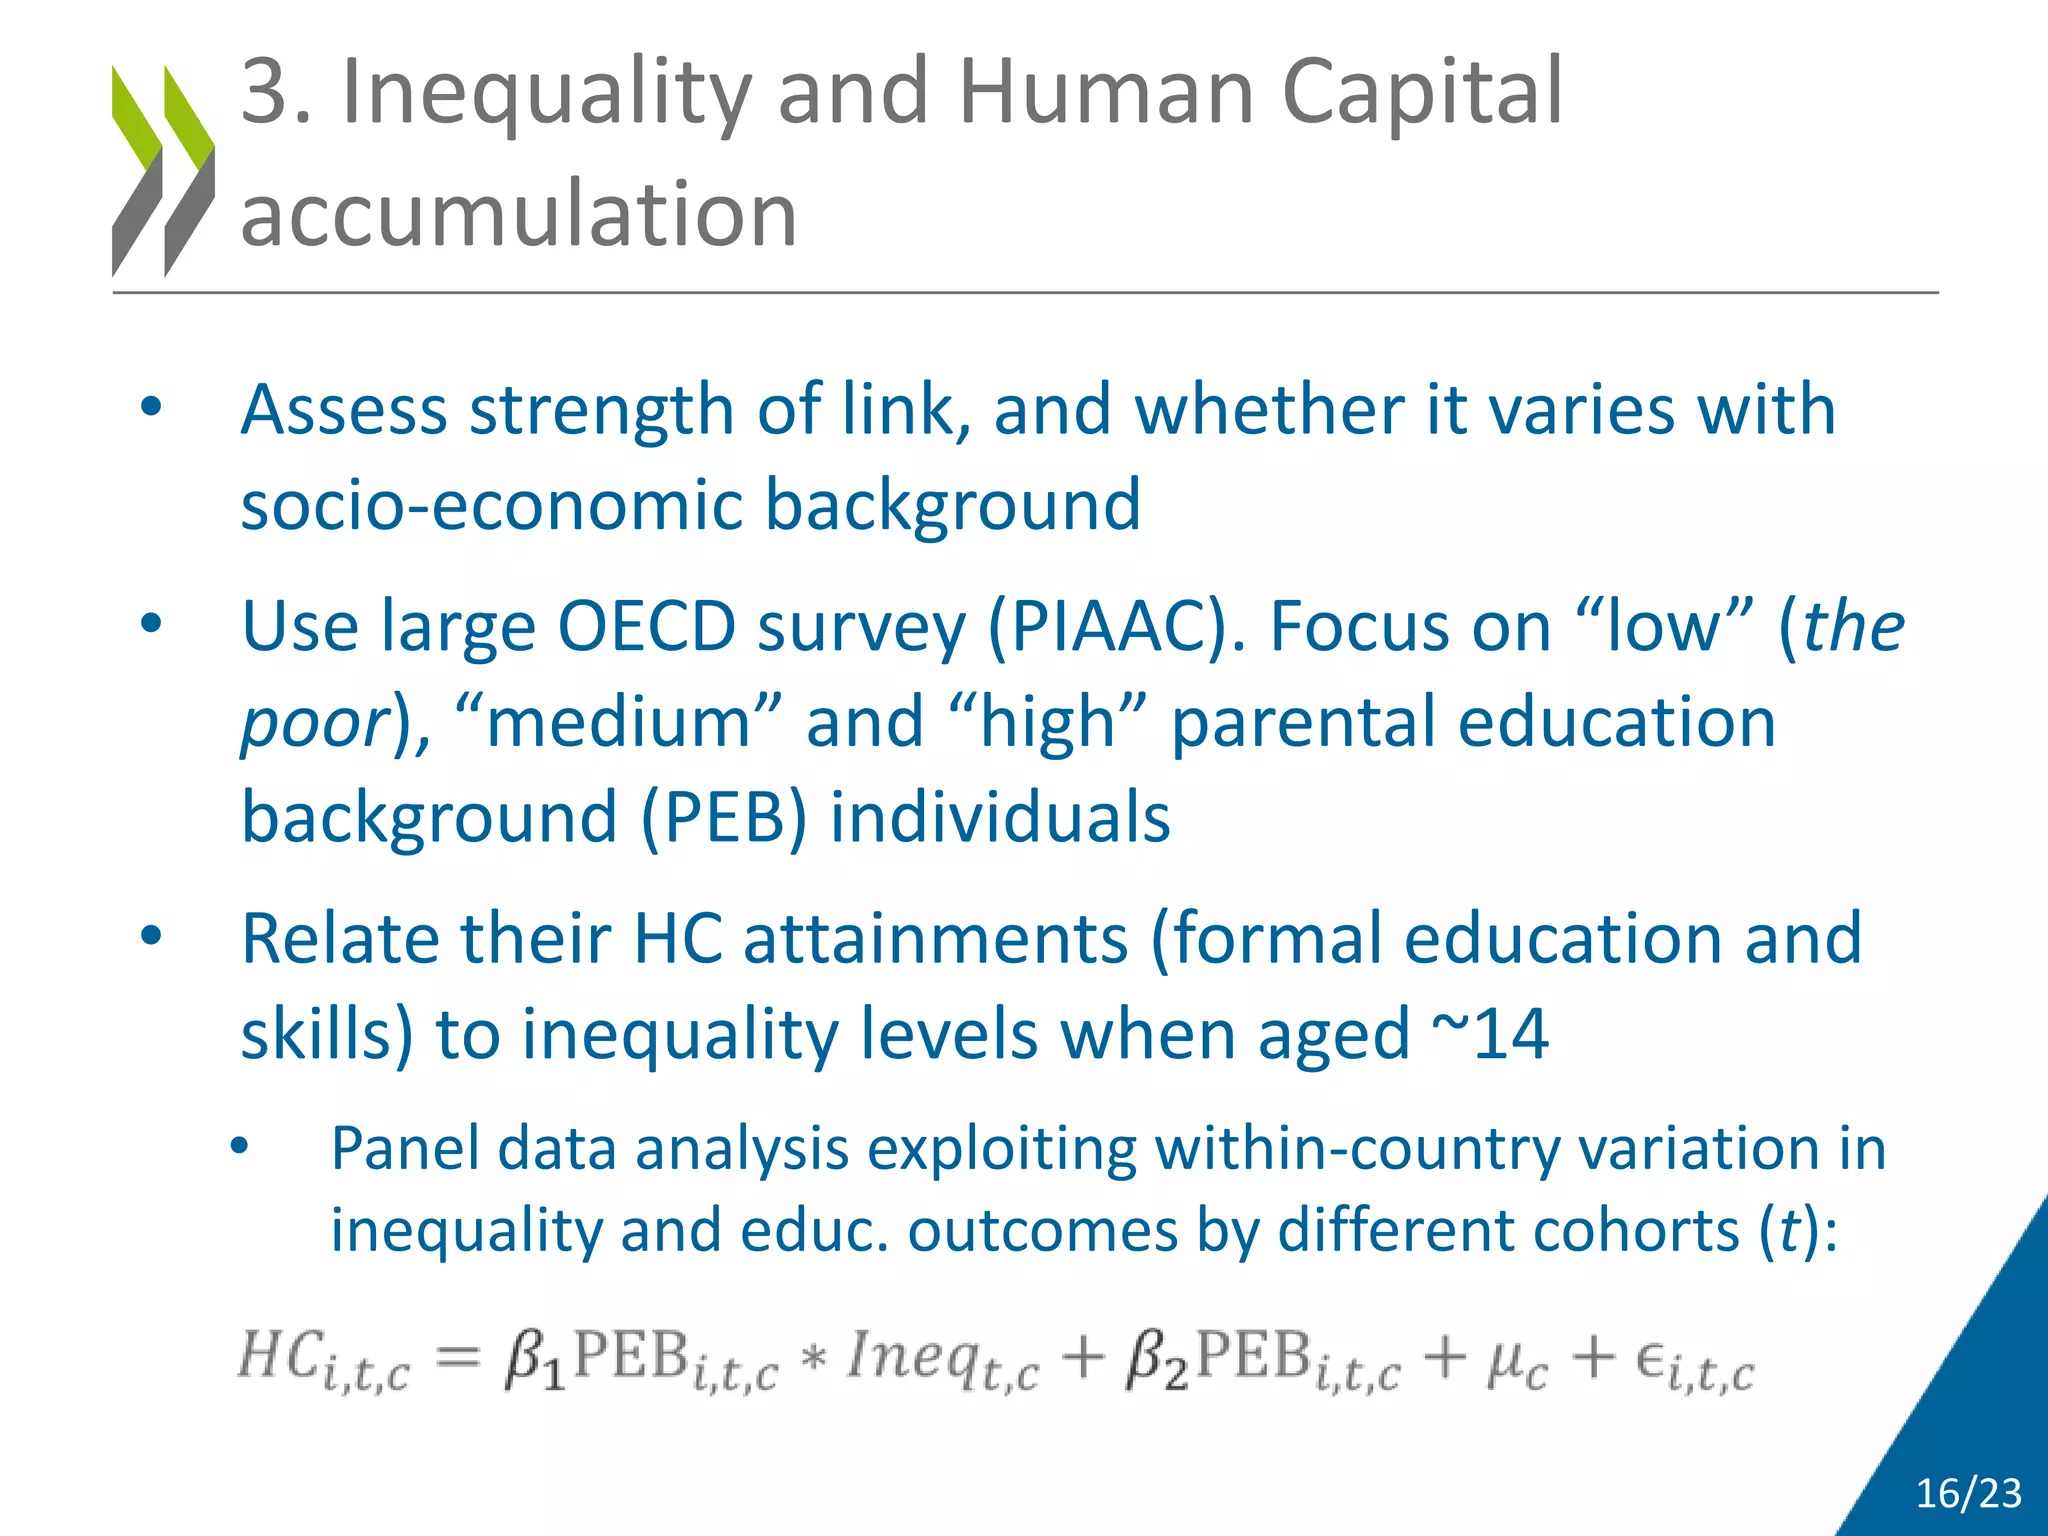

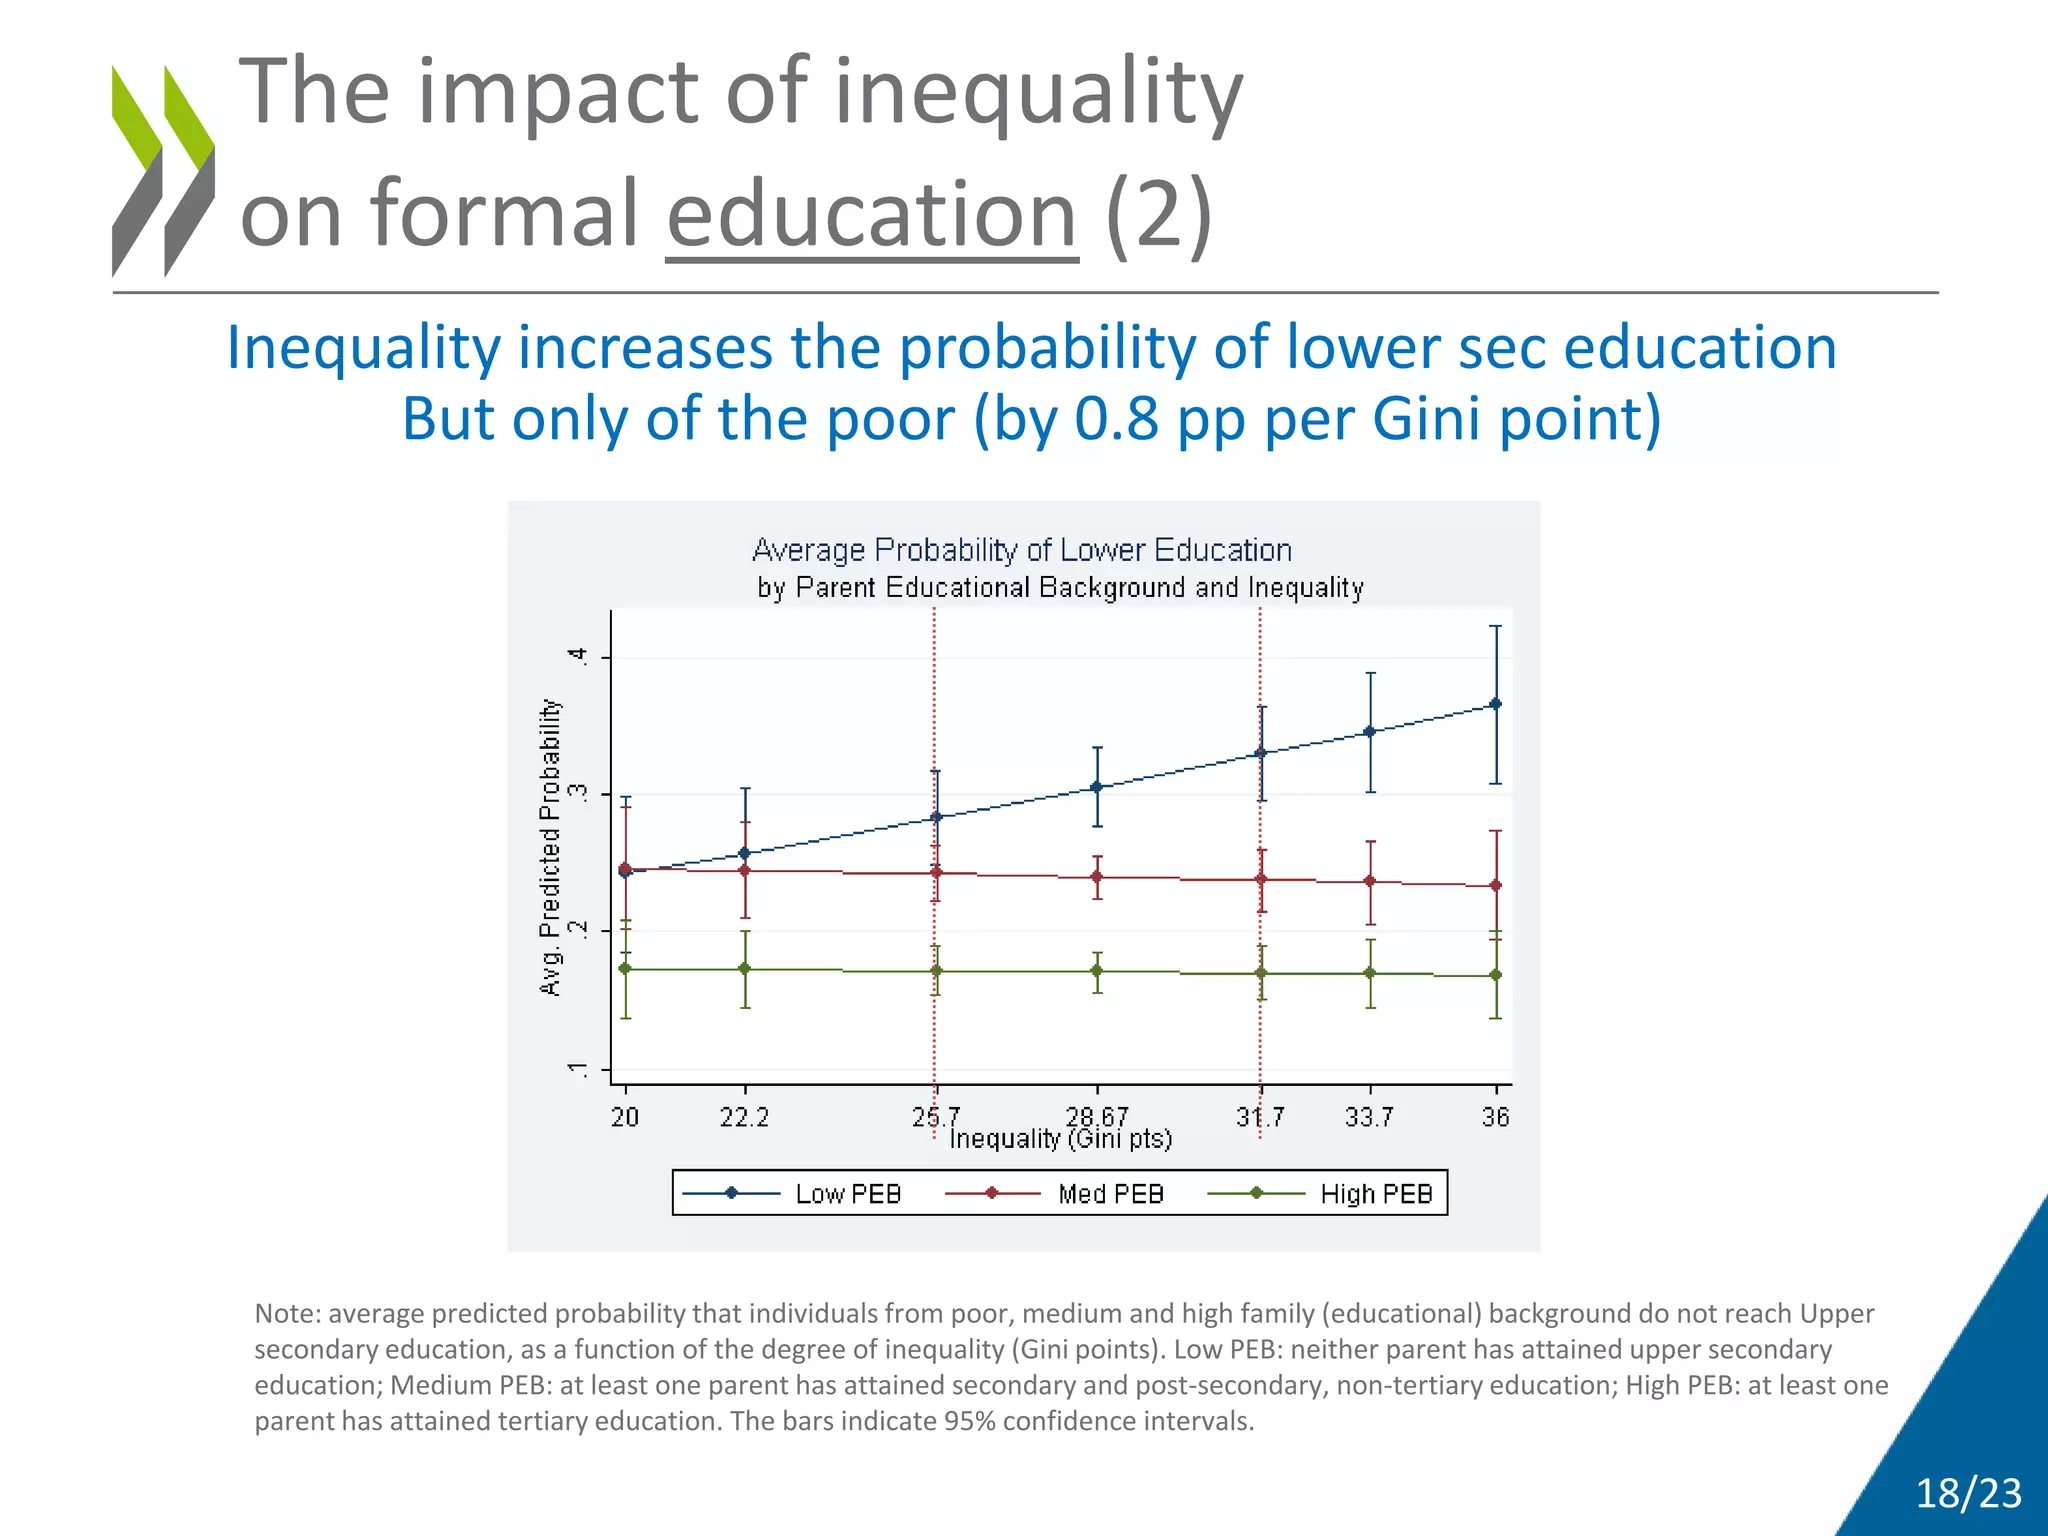
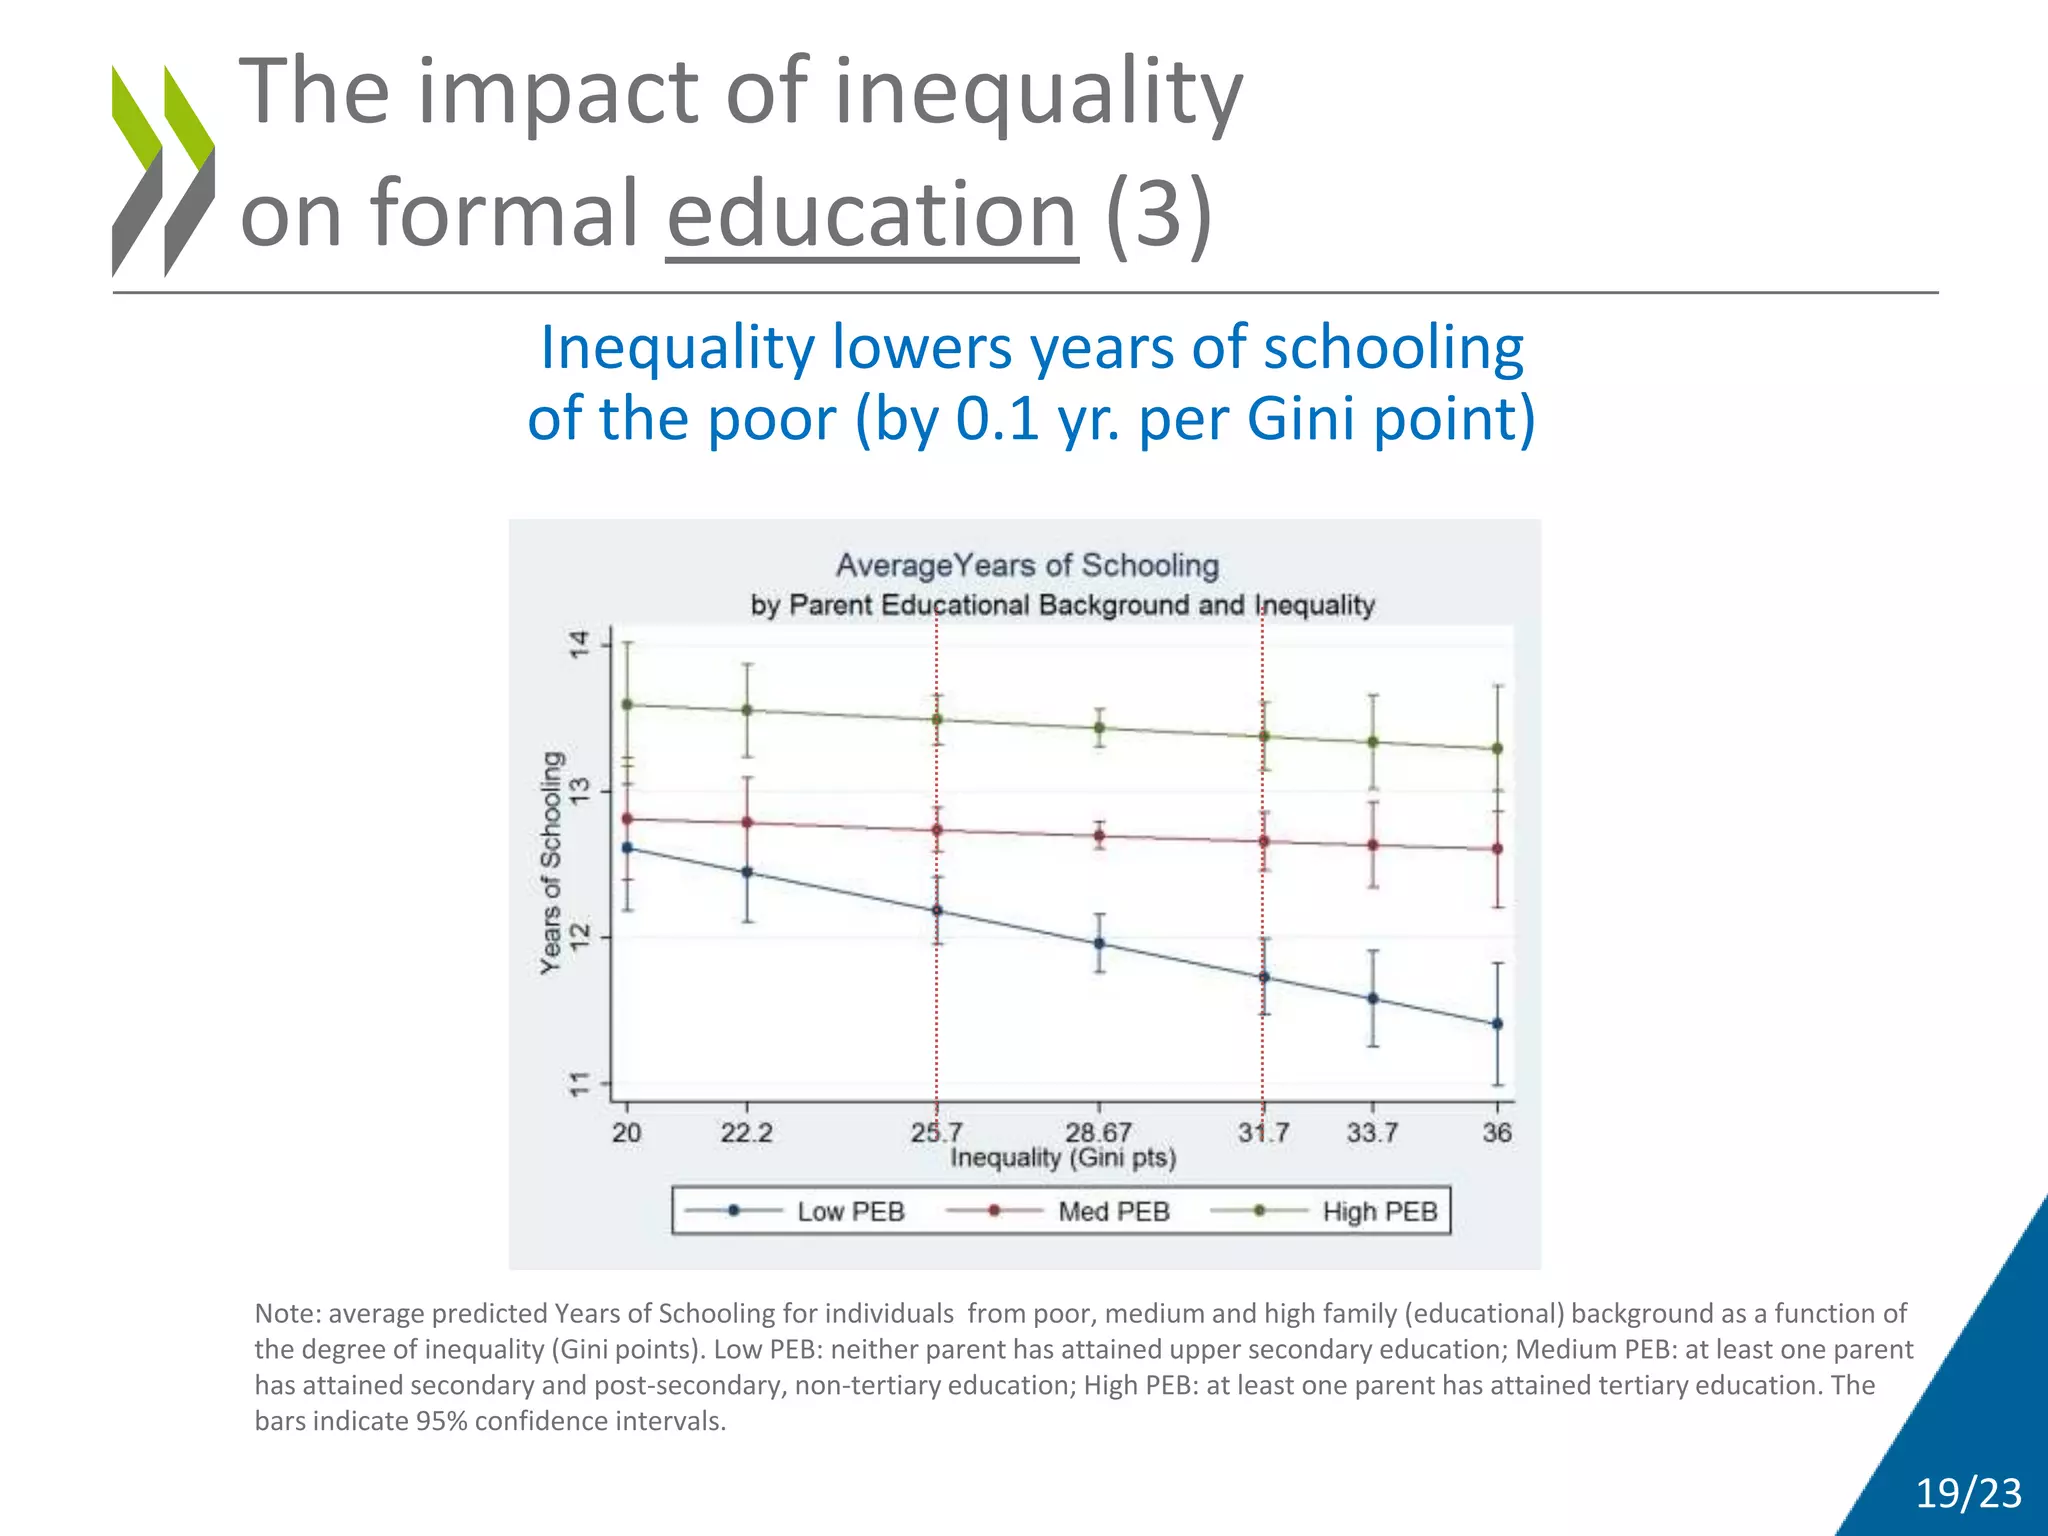

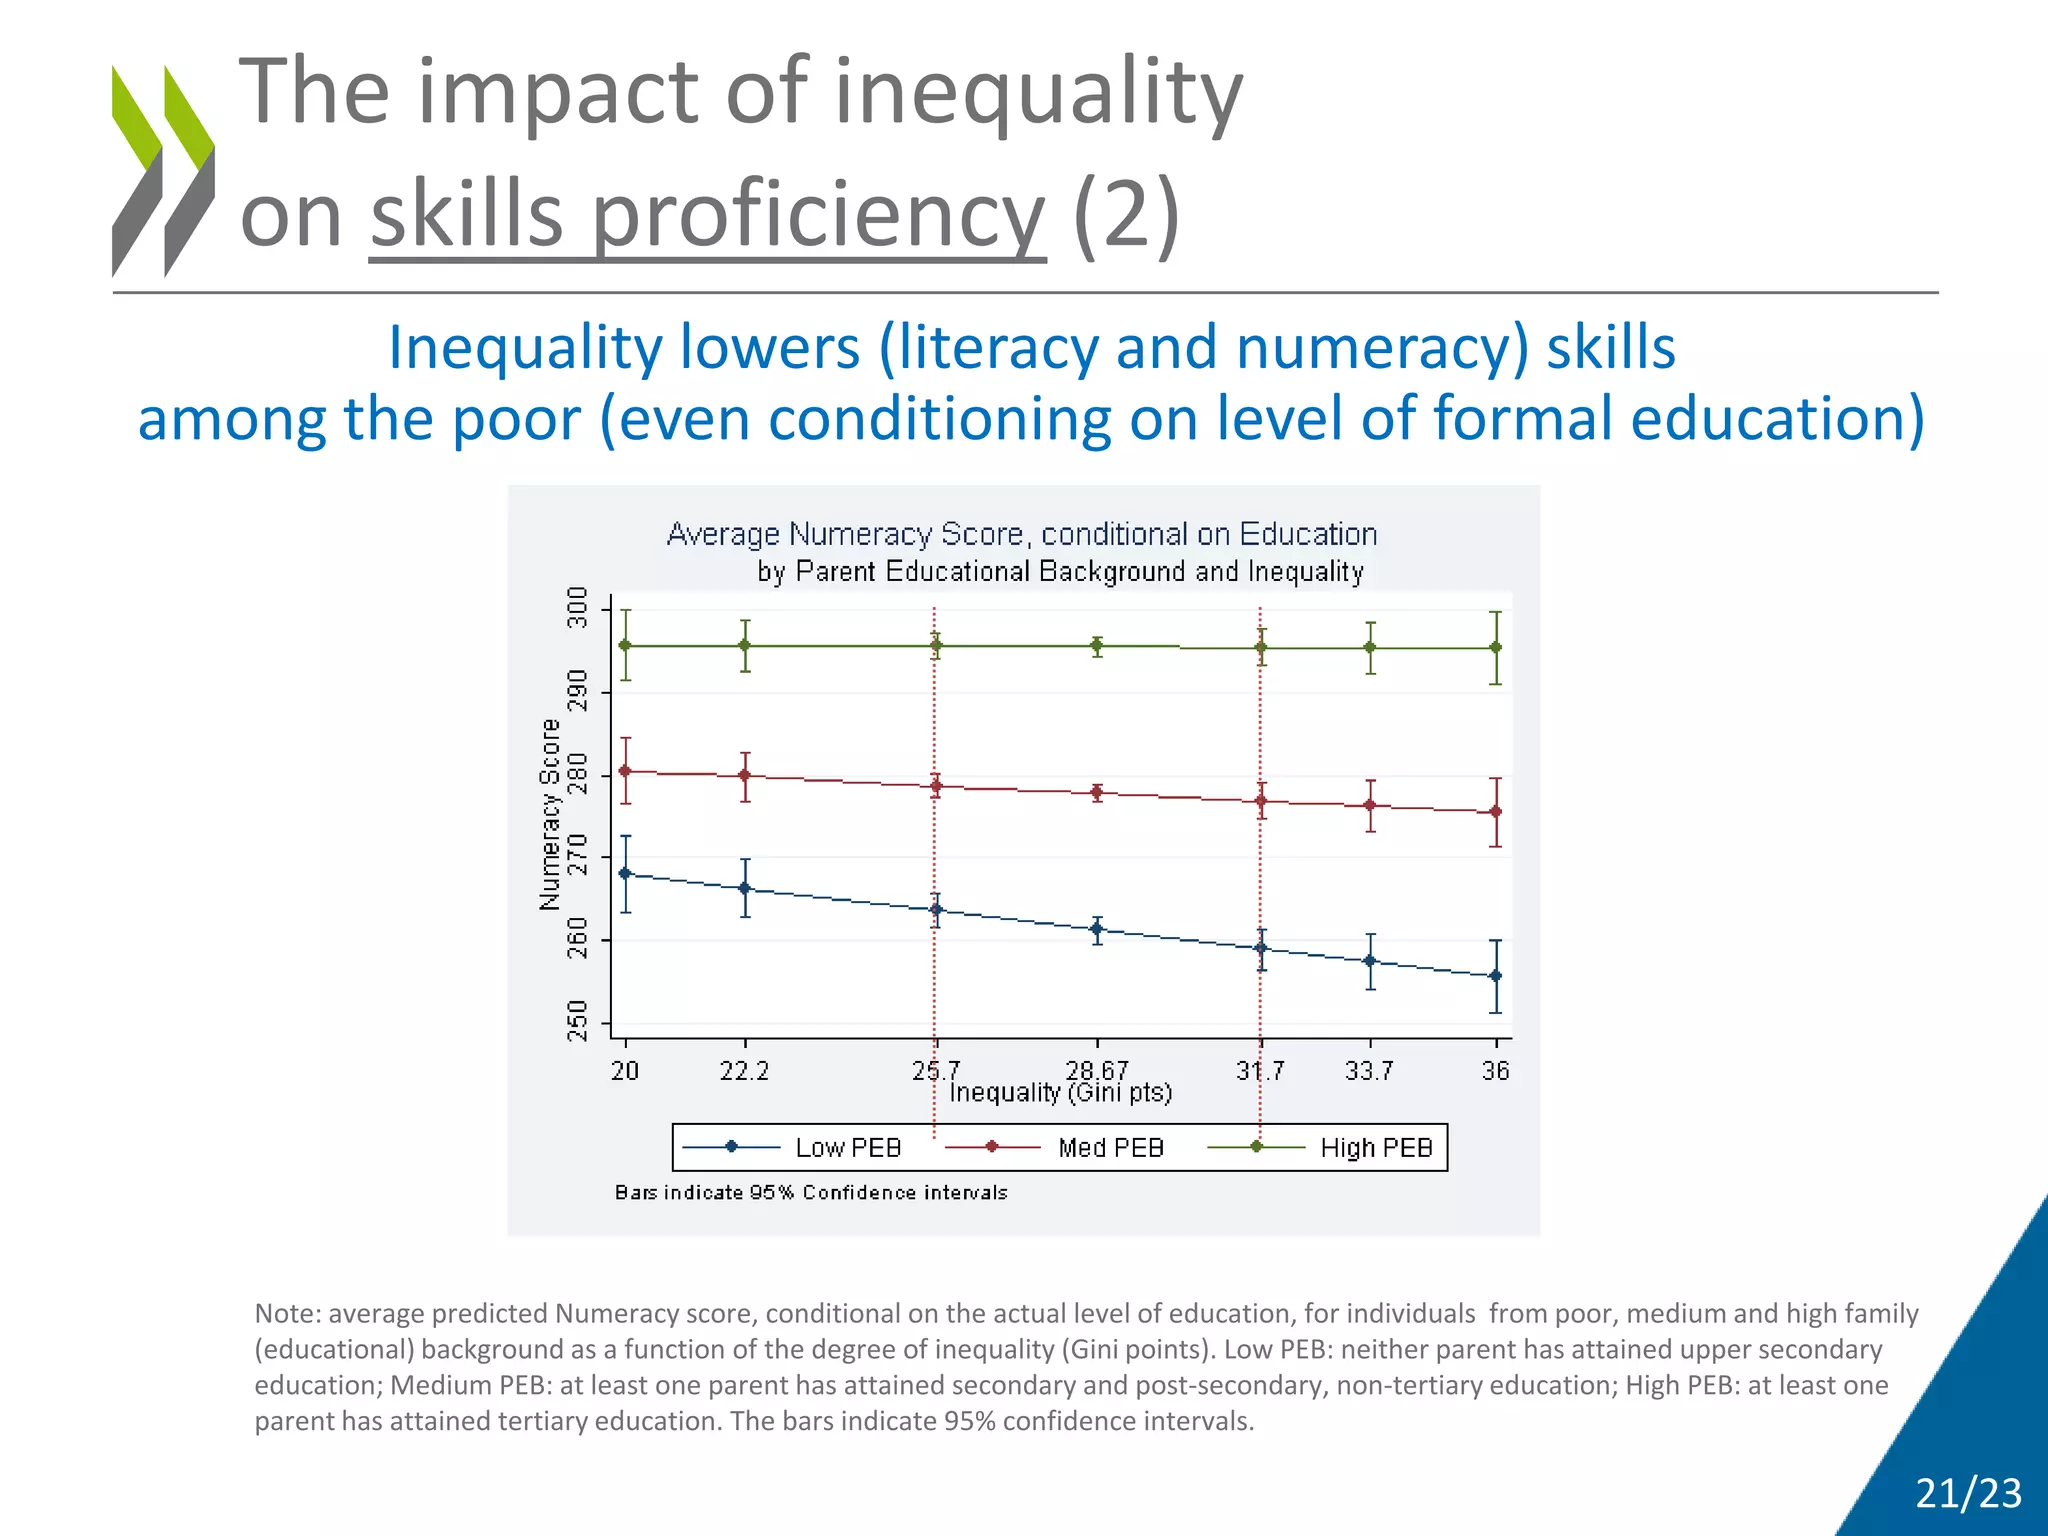
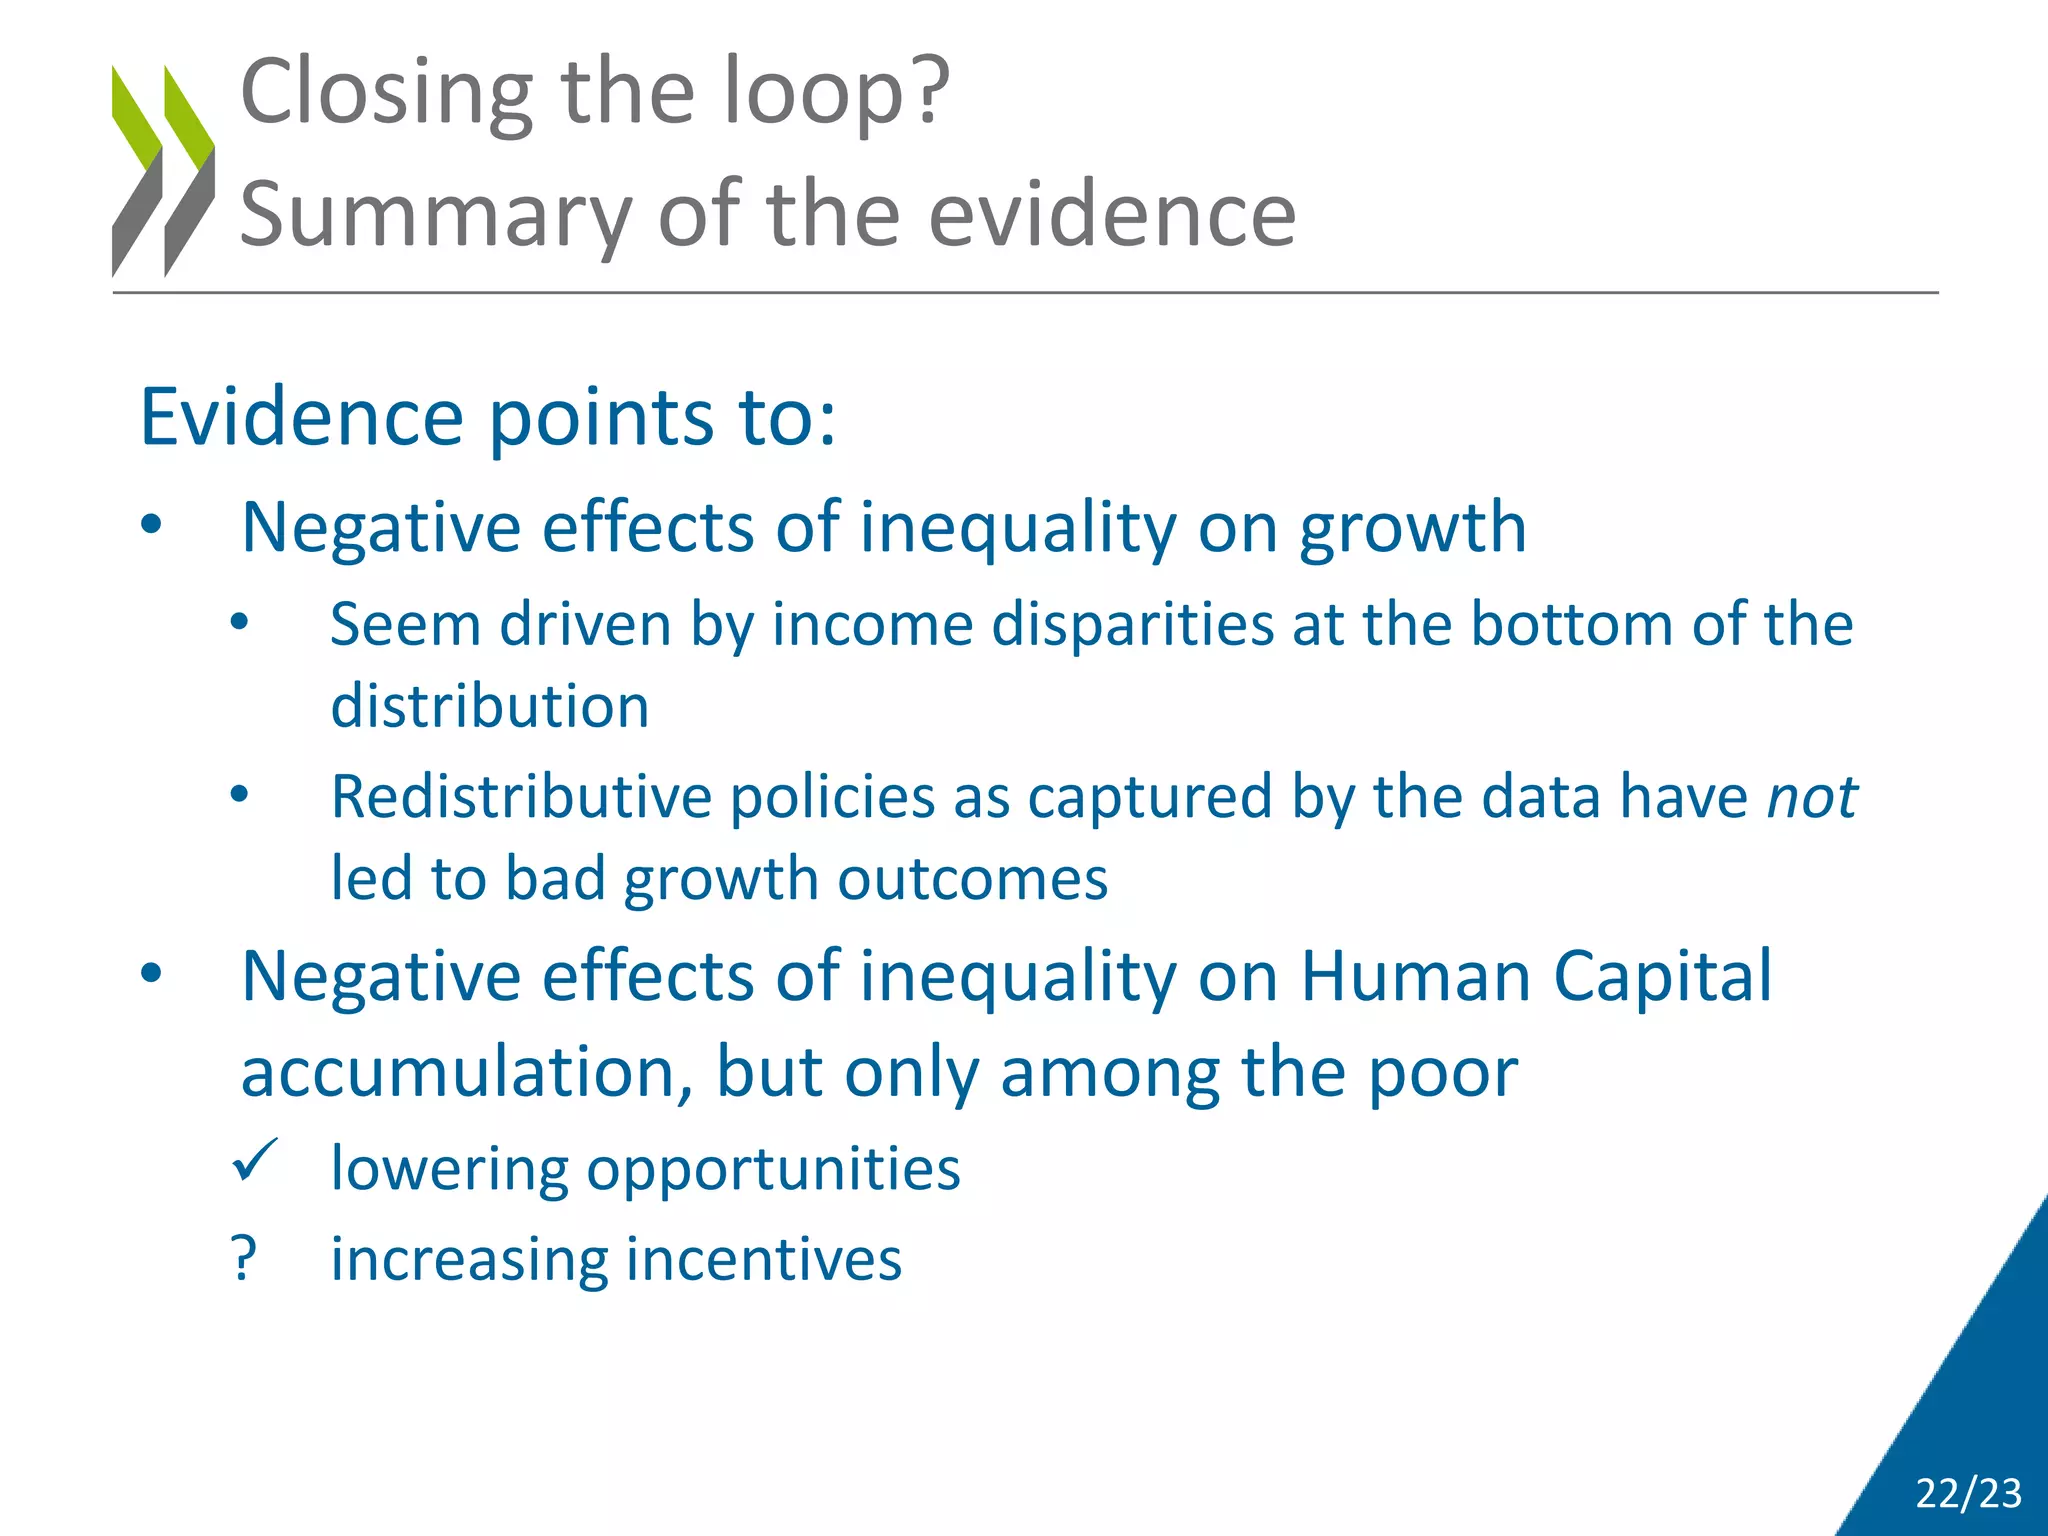

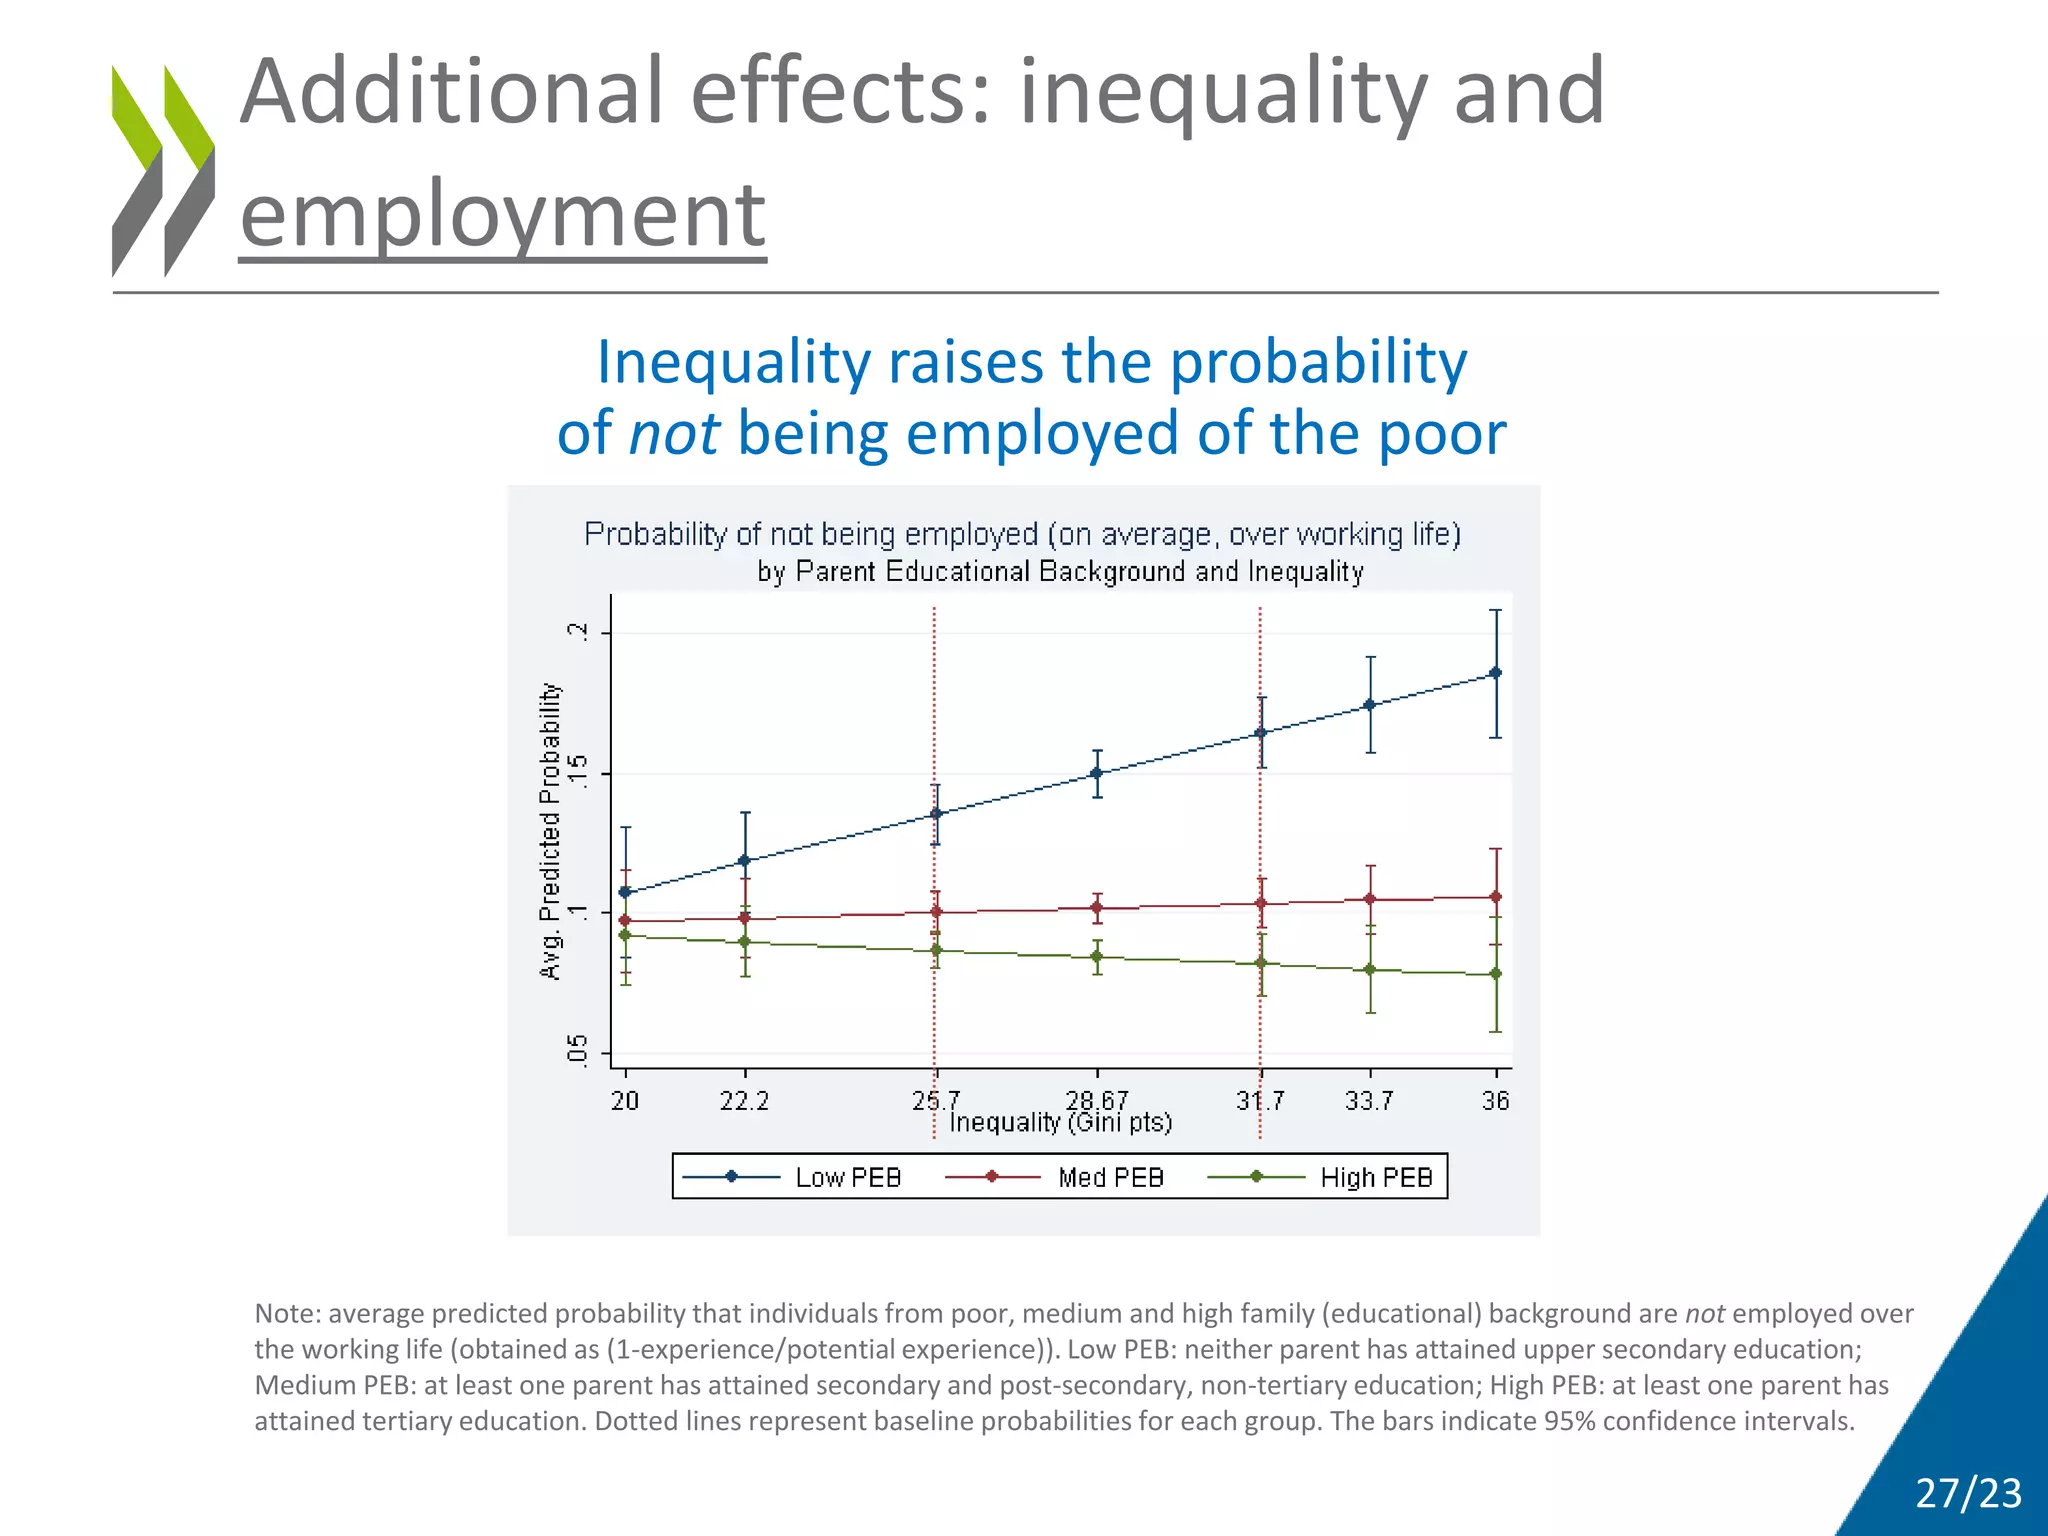
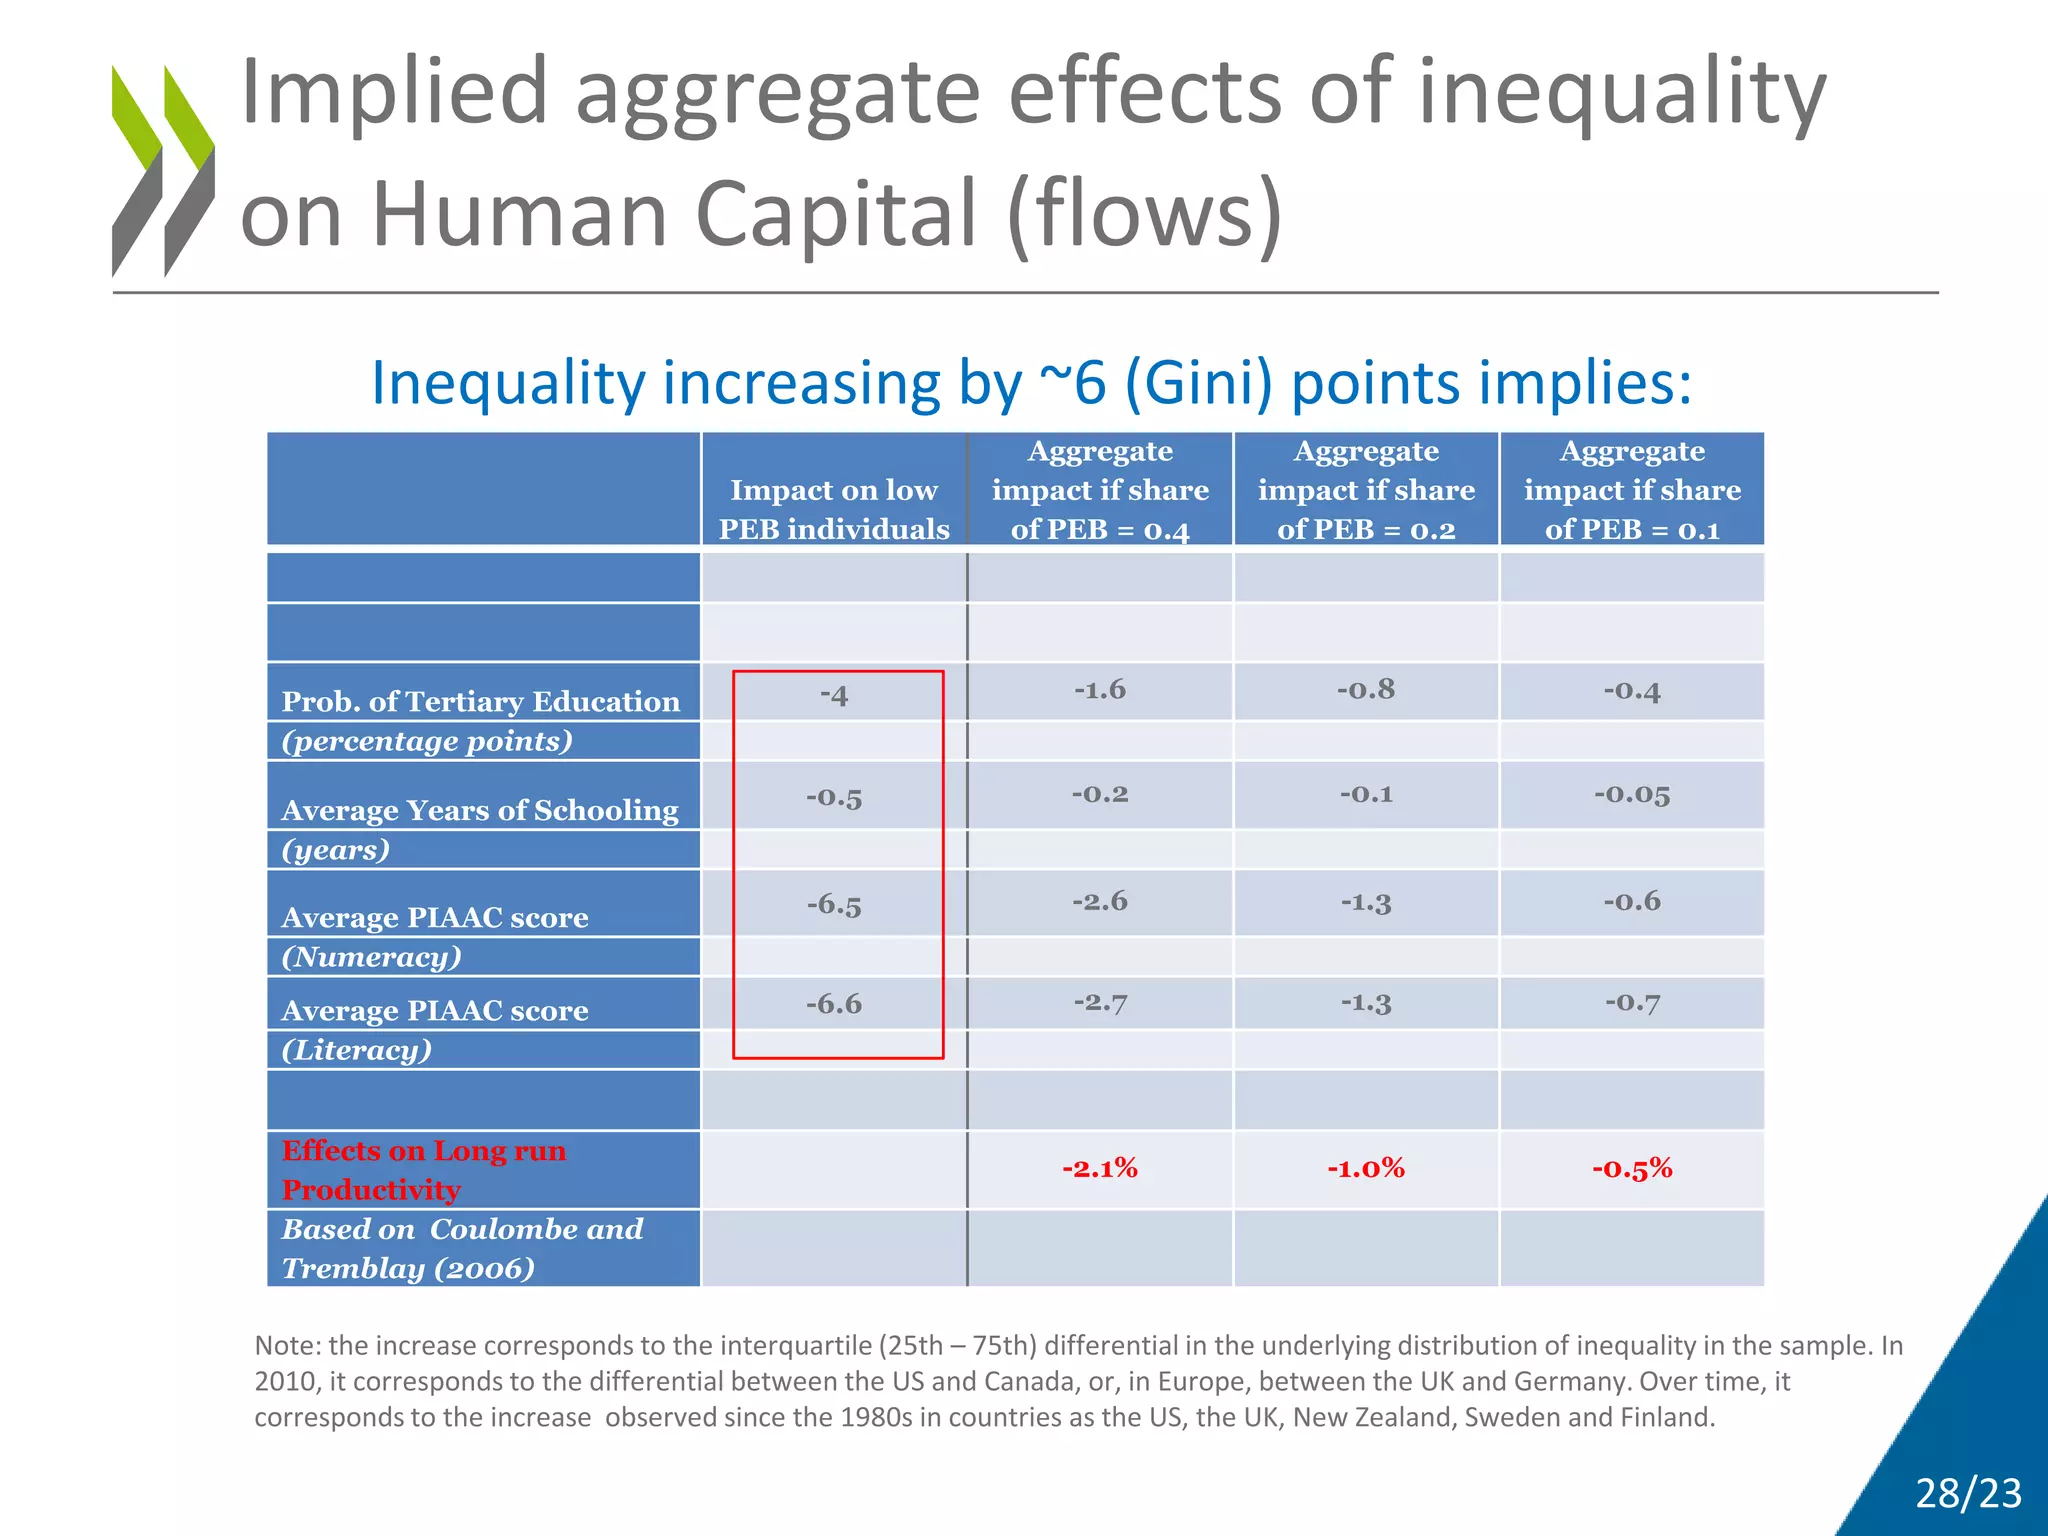

This document summarizes research on how inequality affects economic growth and human capital accumulation. The key points are: 1. Analysis of OECD countries finds that lower net income inequality is linked to higher economic growth rates. Reducing inequality by 1 Gini point could increase annual GDP growth by 0.2 percentage points. 2. Inequality at the bottom of the income distribution, not the top, appears to negatively impact growth. 3. Inequality reduces human capital accumulation, but only for those from poorer socioeconomic backgrounds. It lowers their education levels and skills proficiency even when controlling for education. This suggests inequality decreases opportunities for the poor.


