Download to read offline
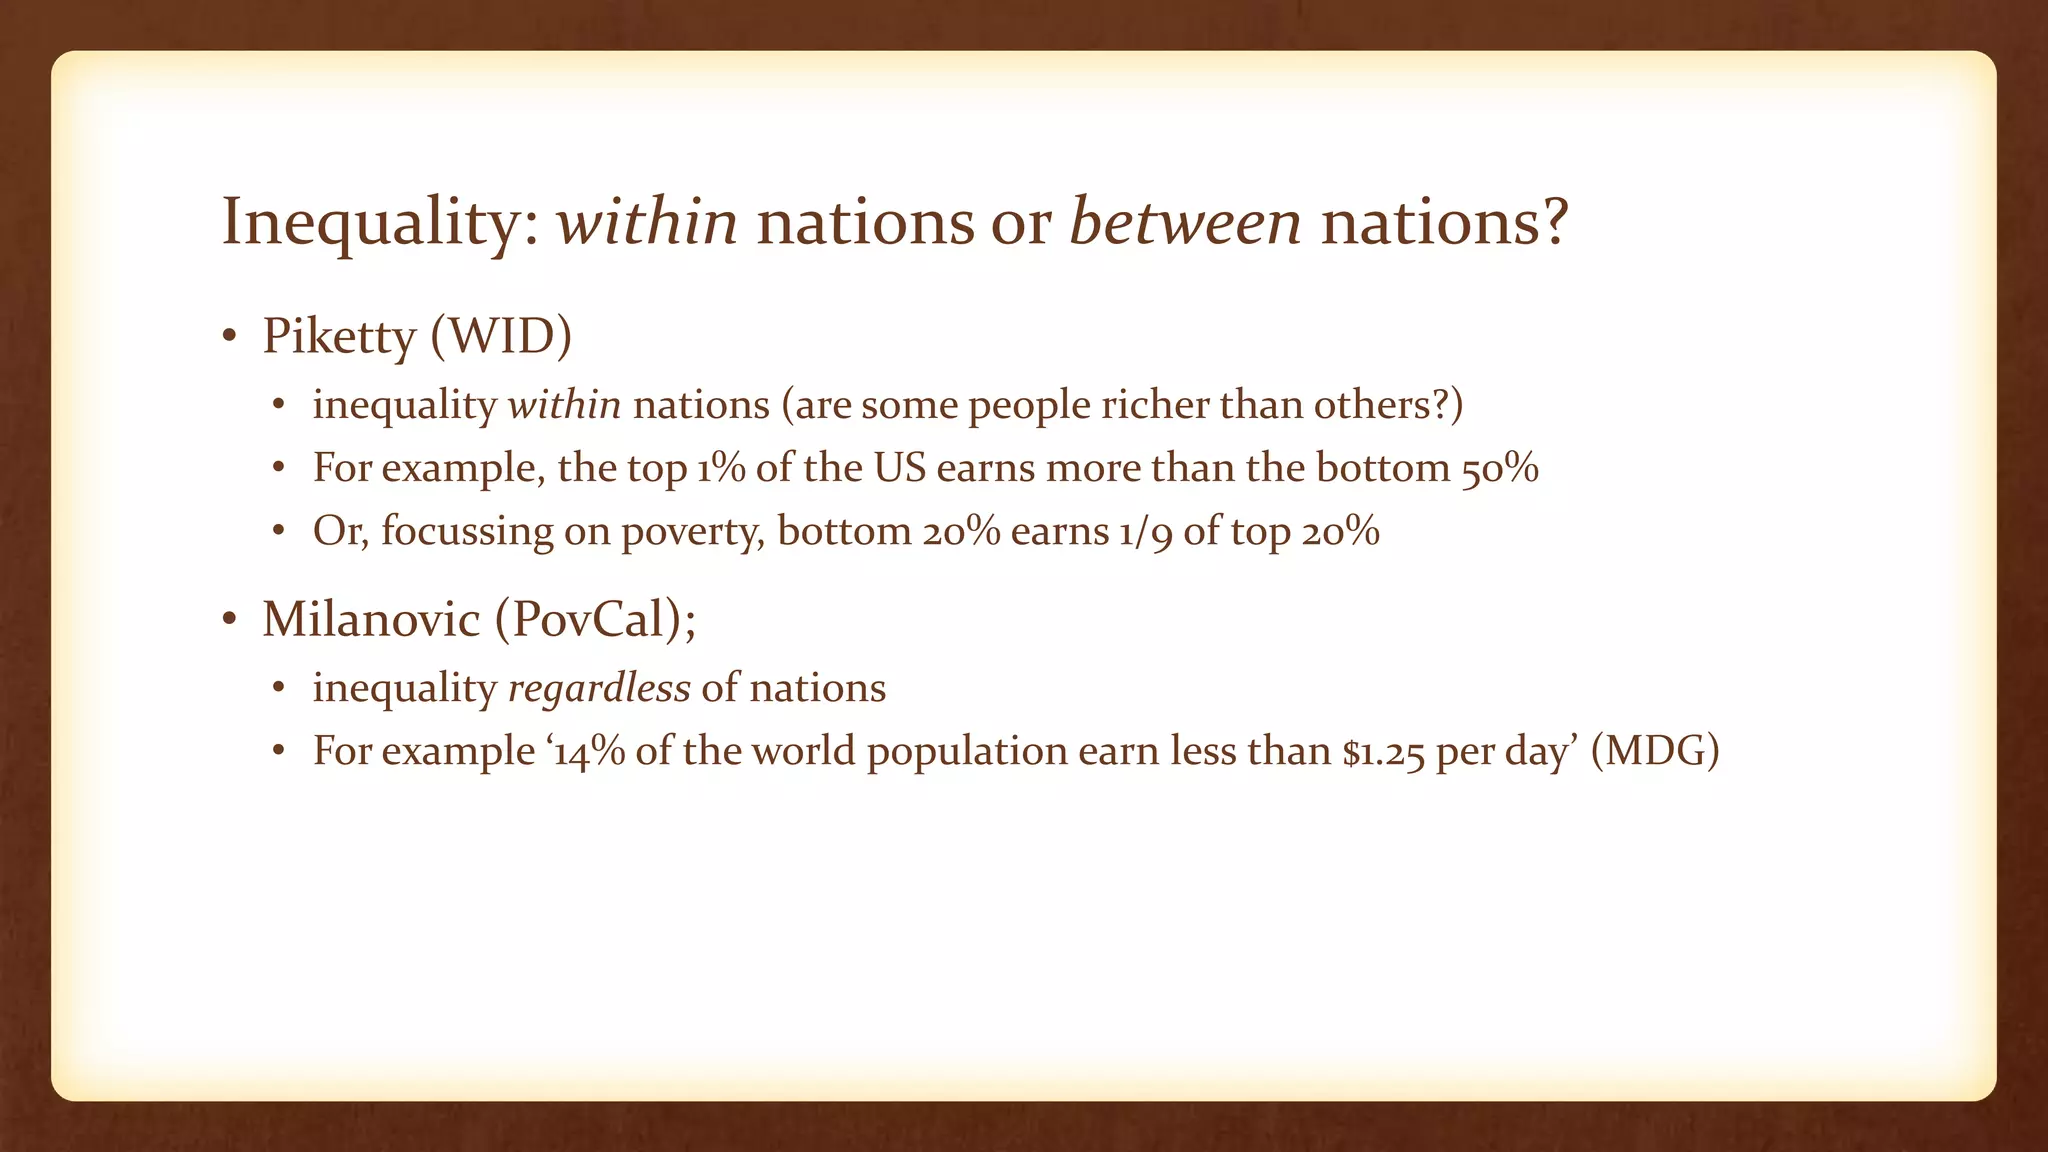
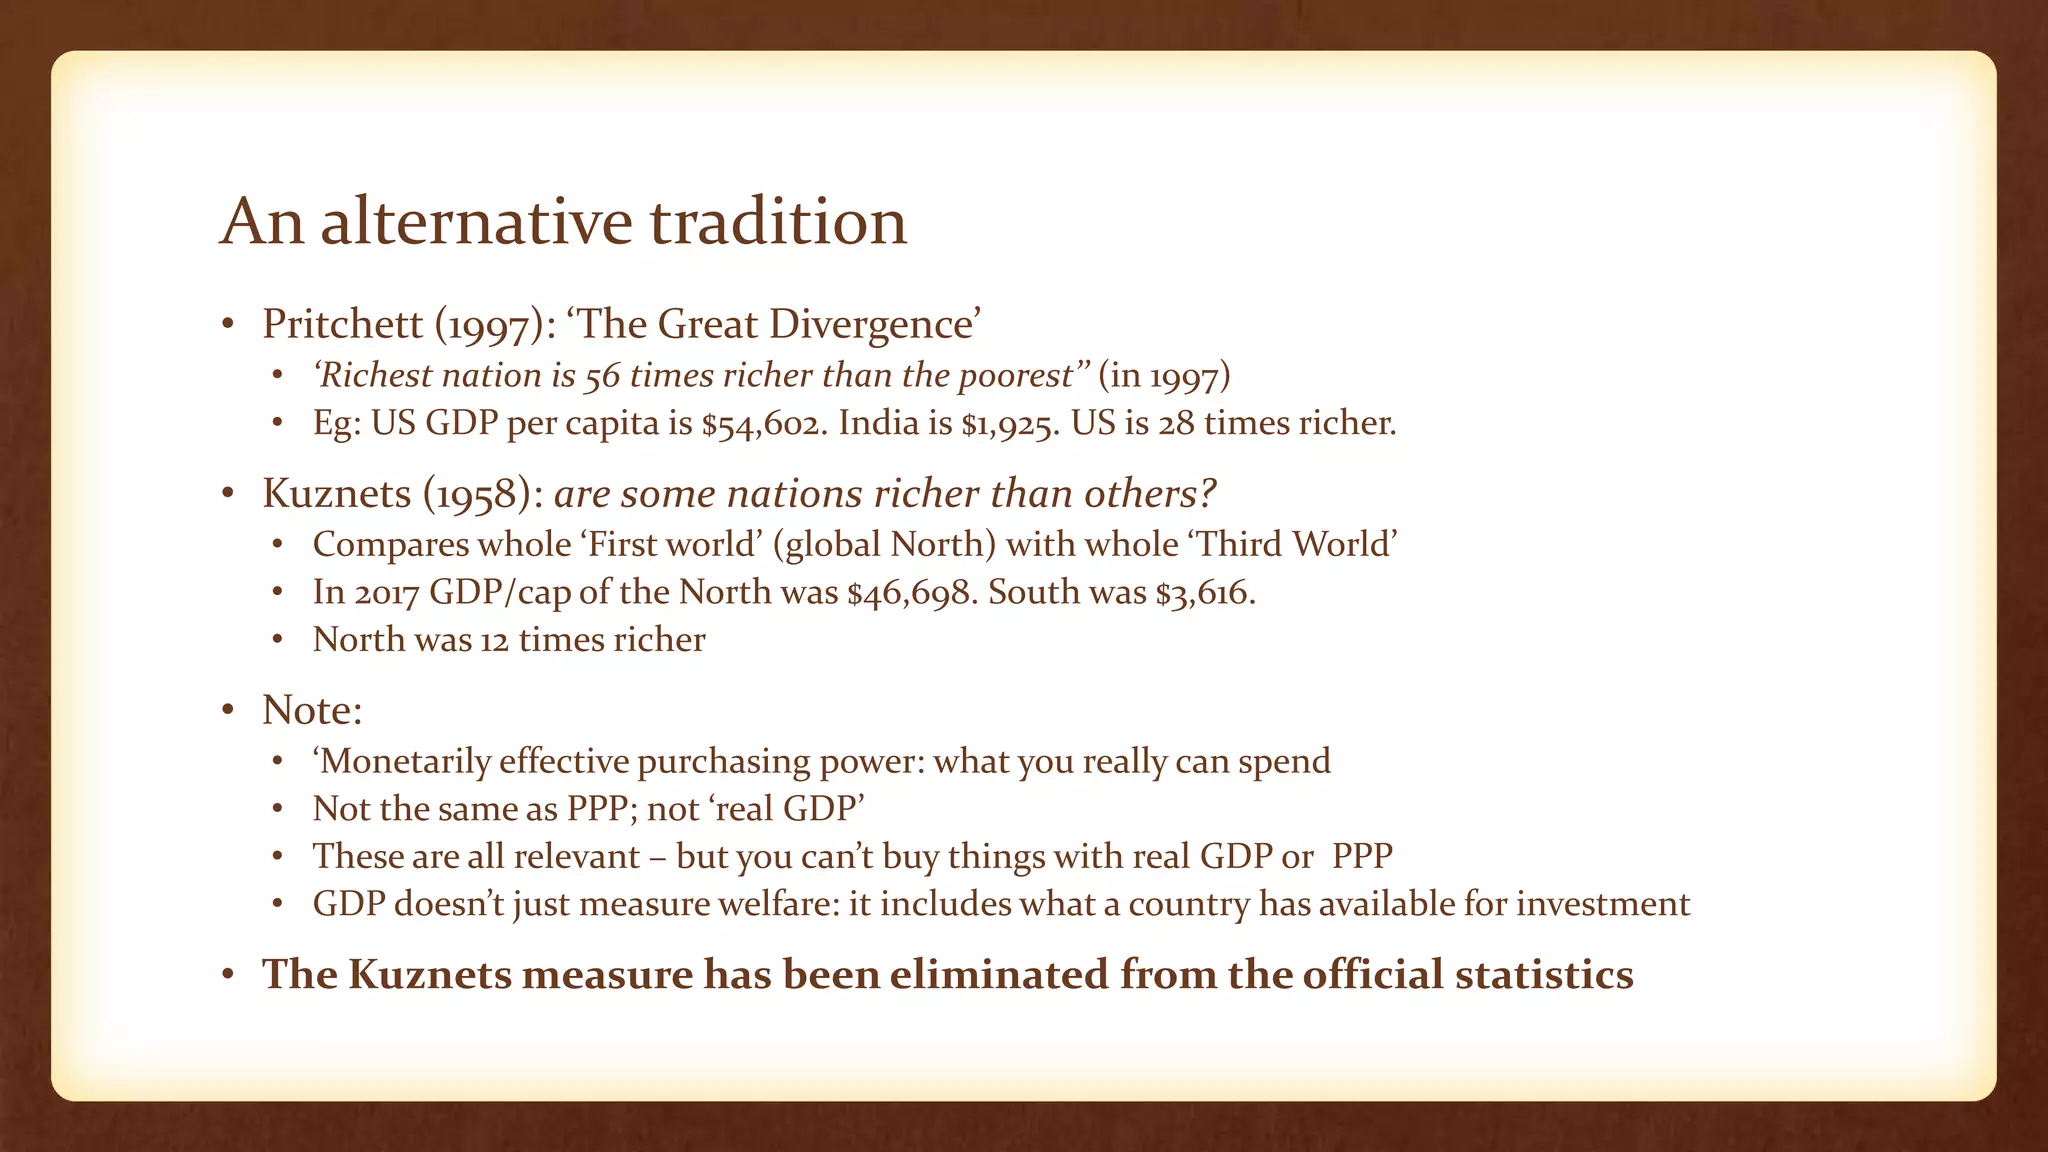
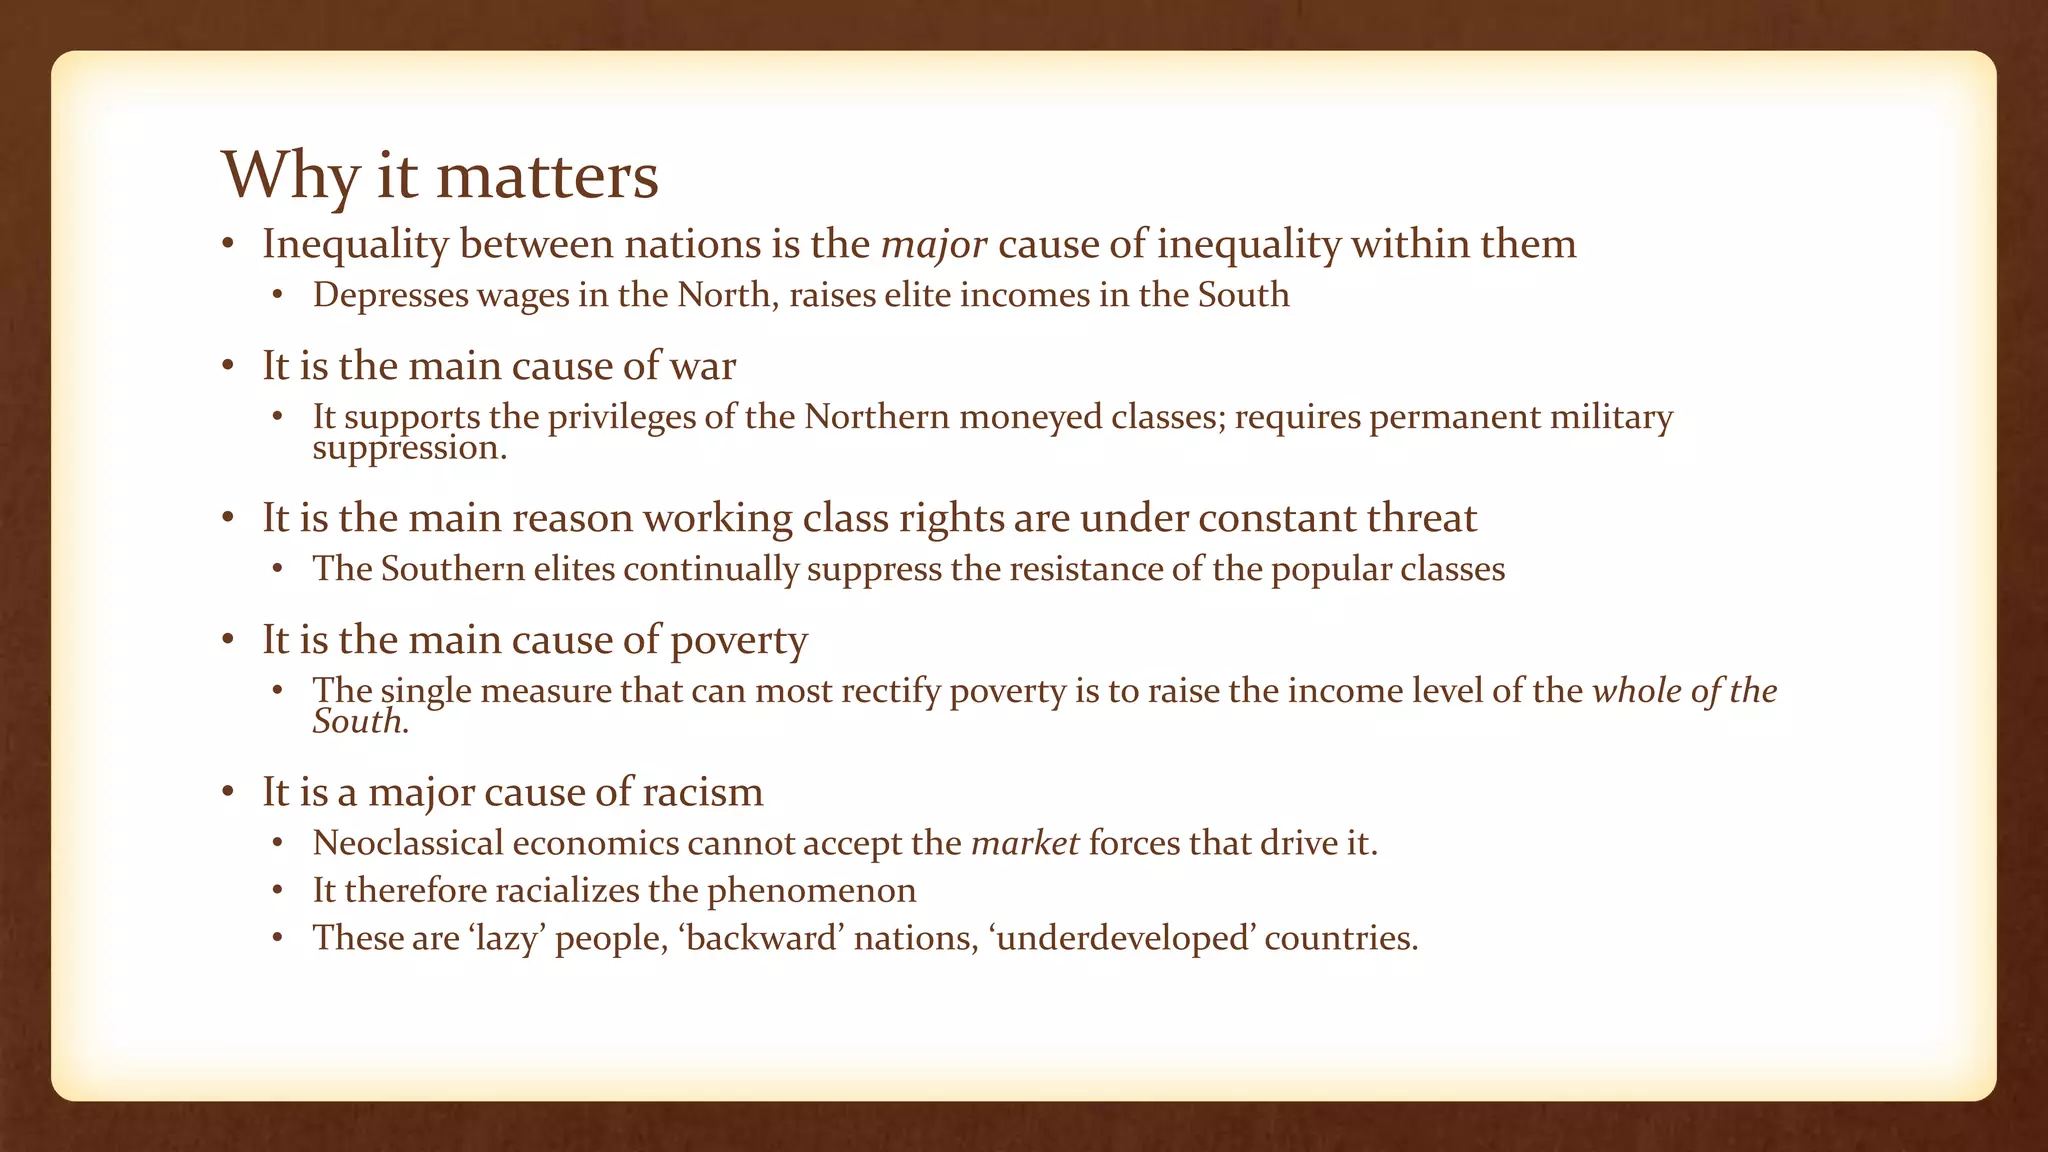
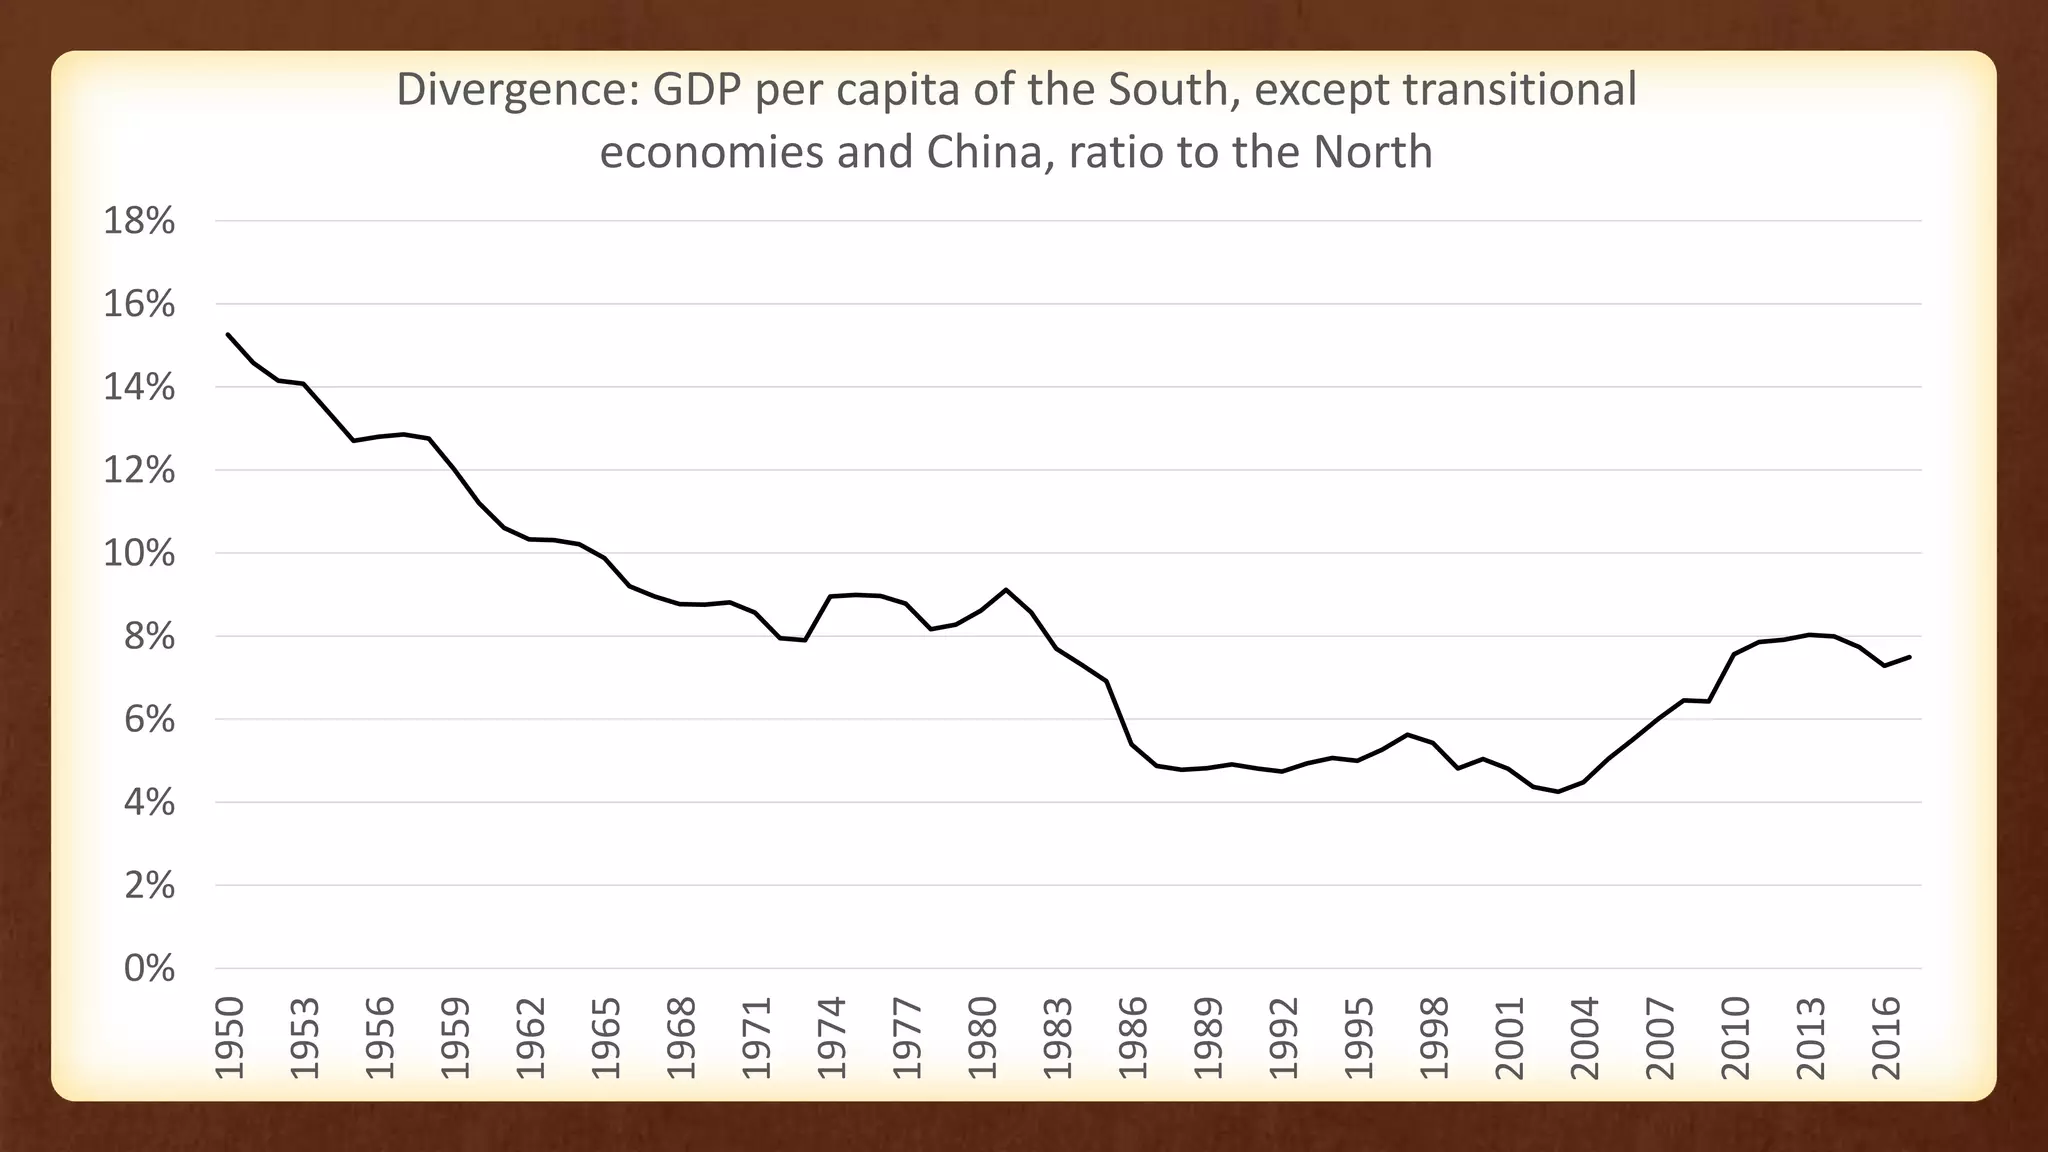
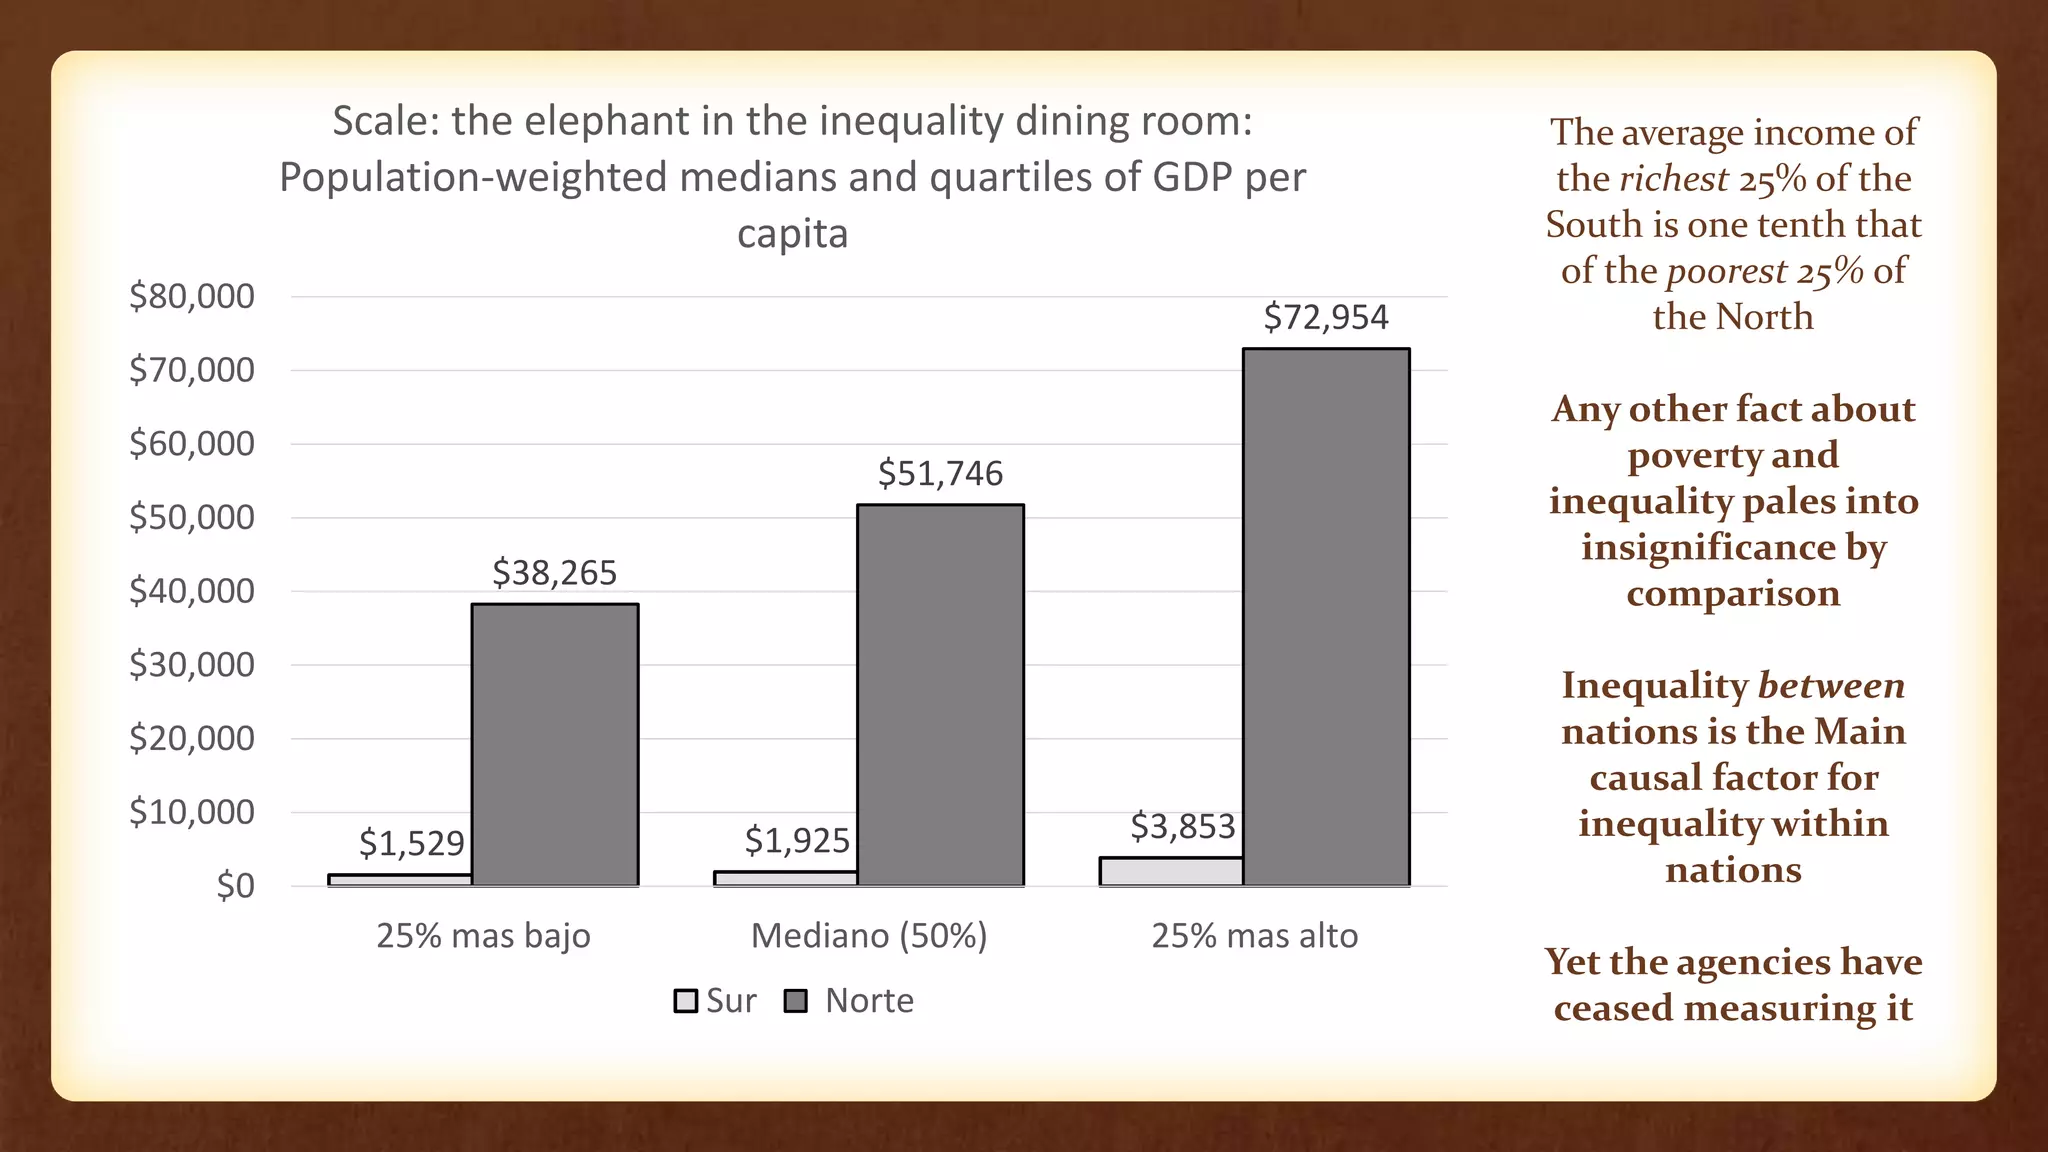
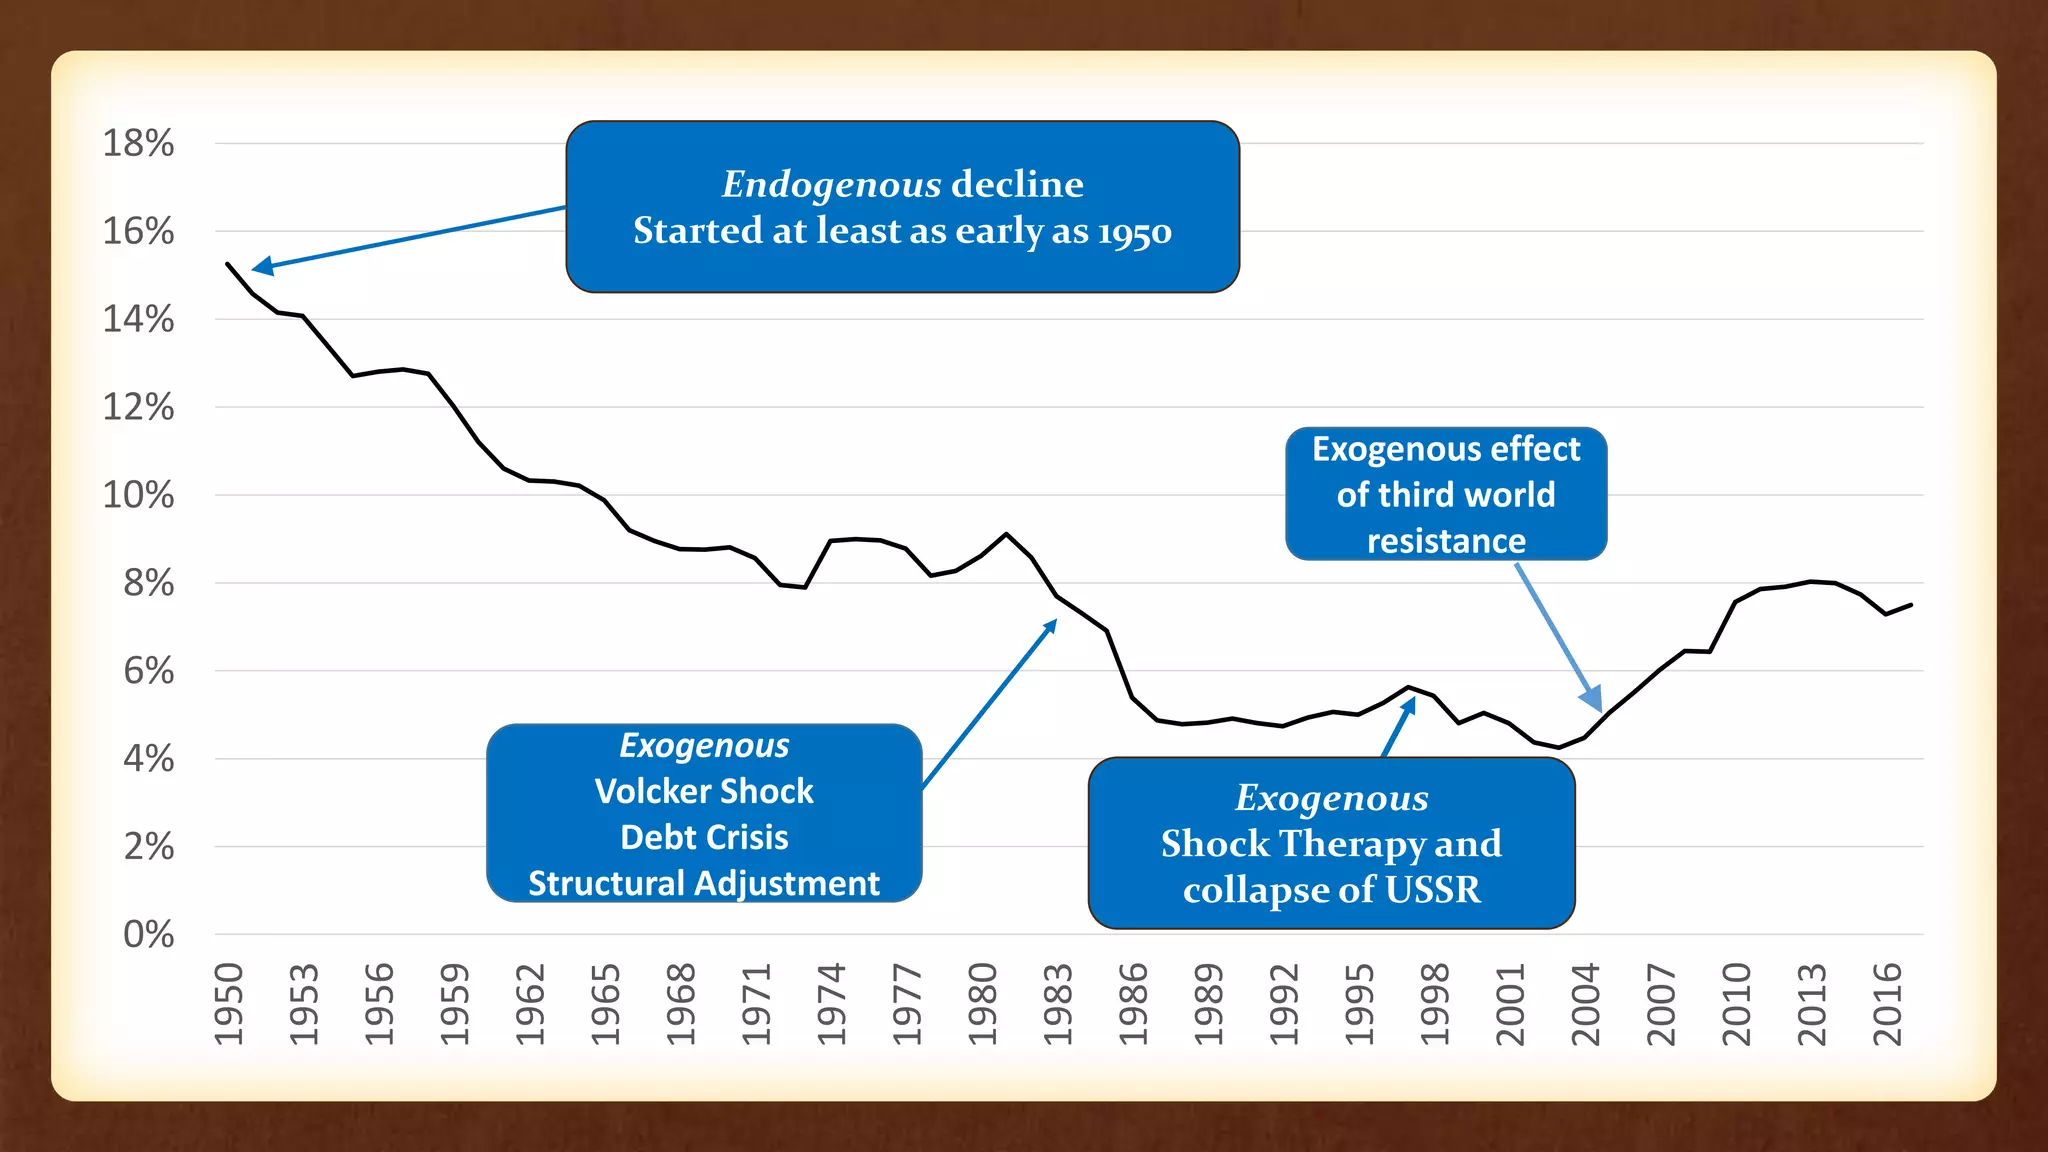

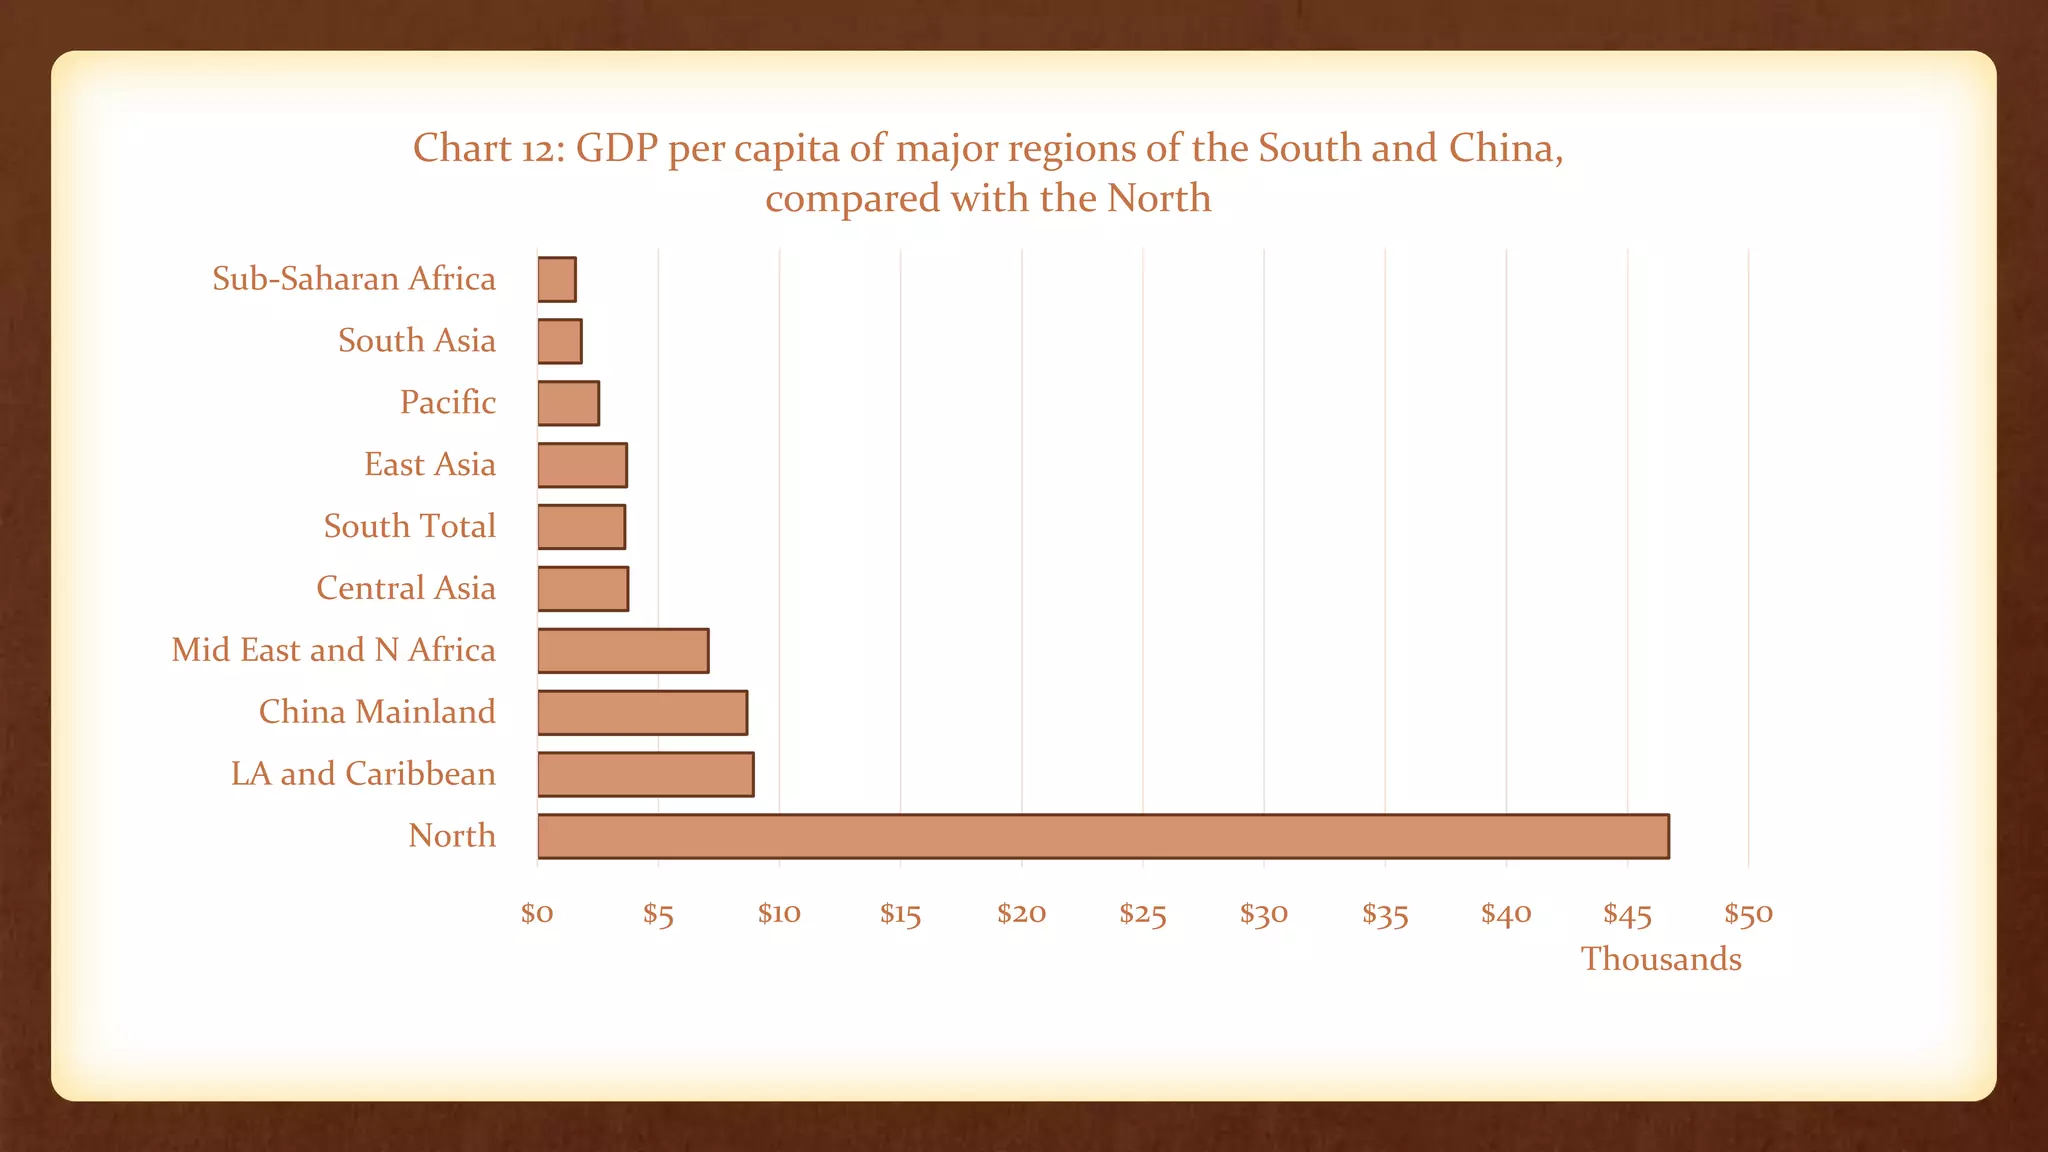
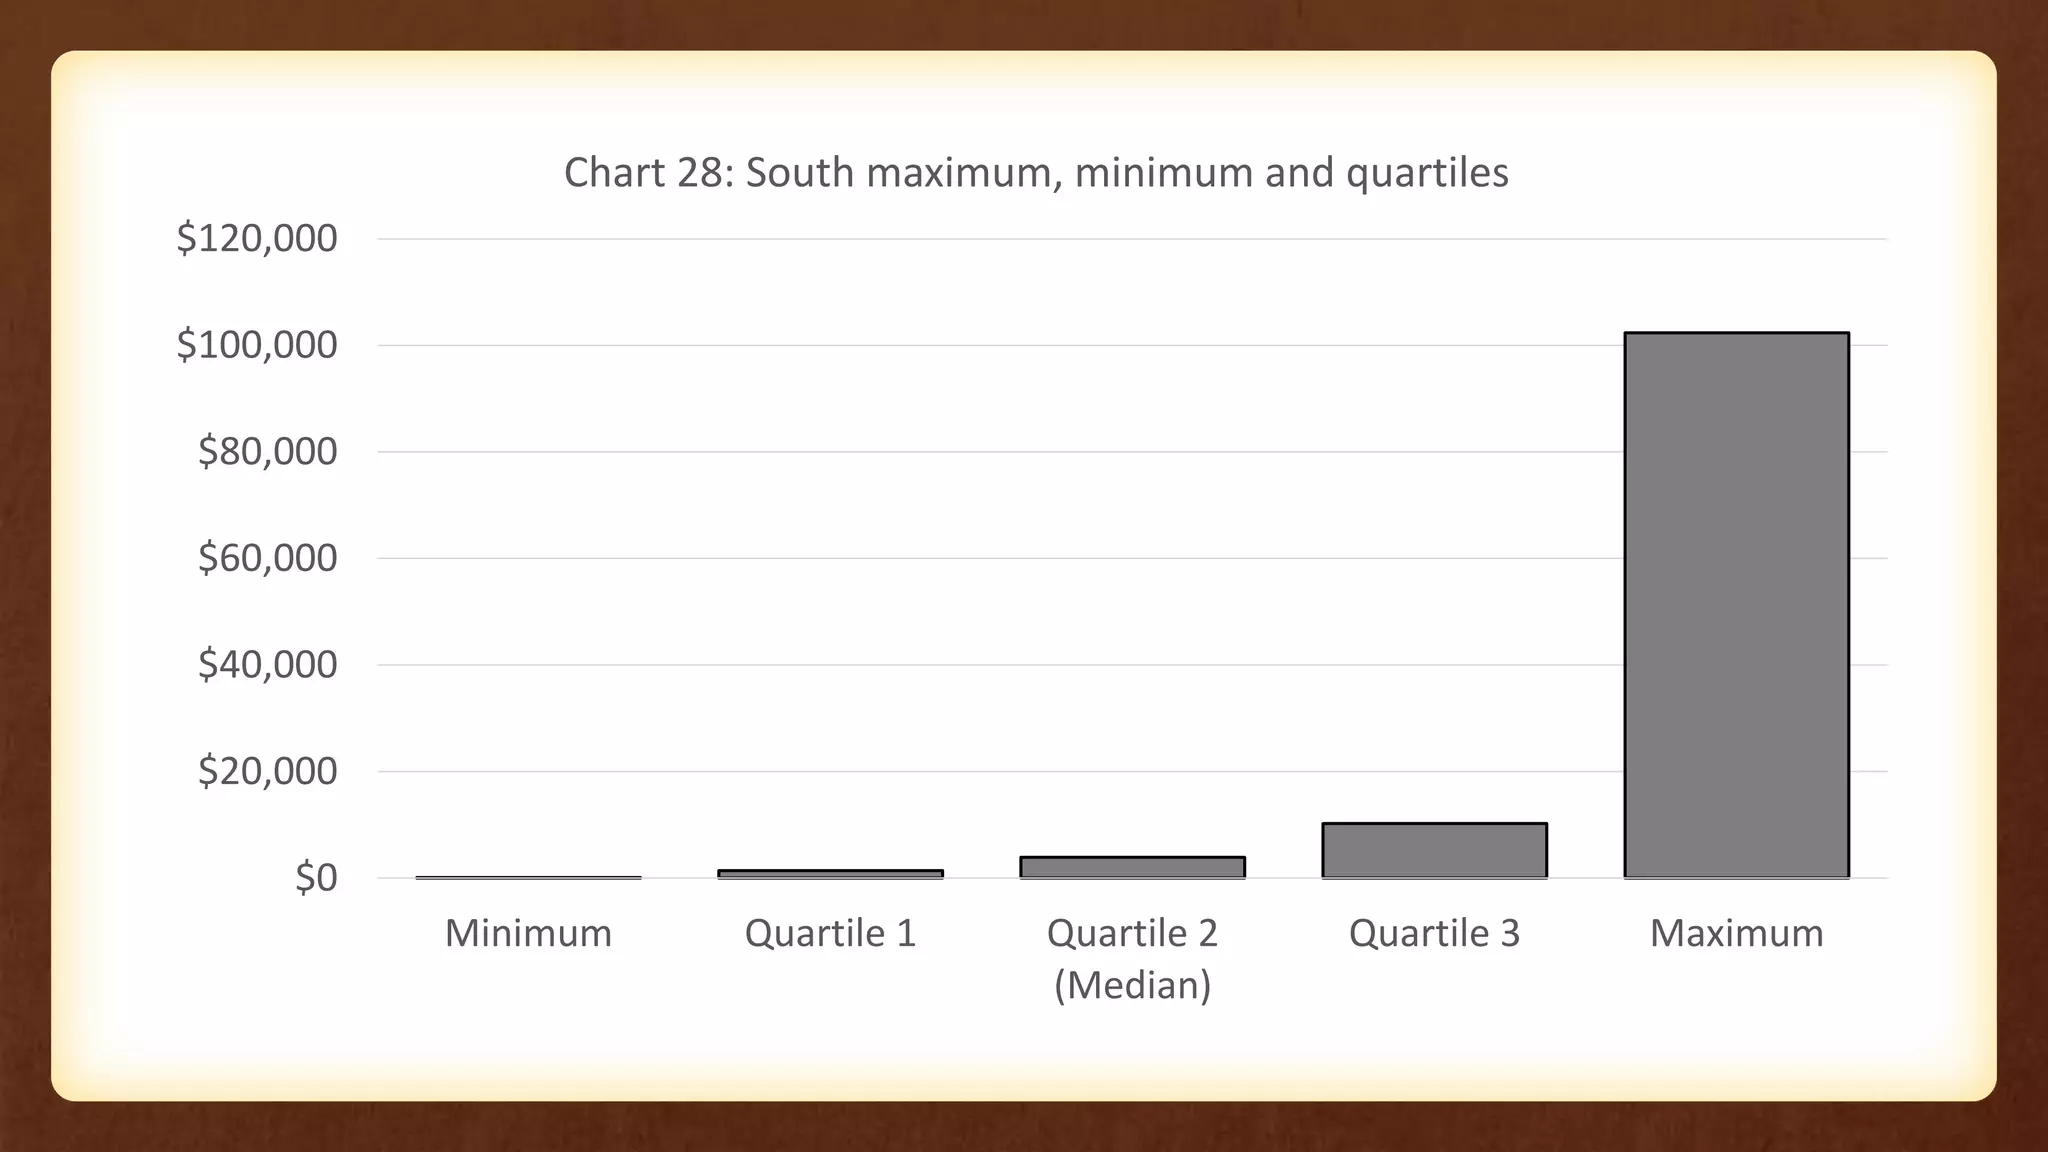
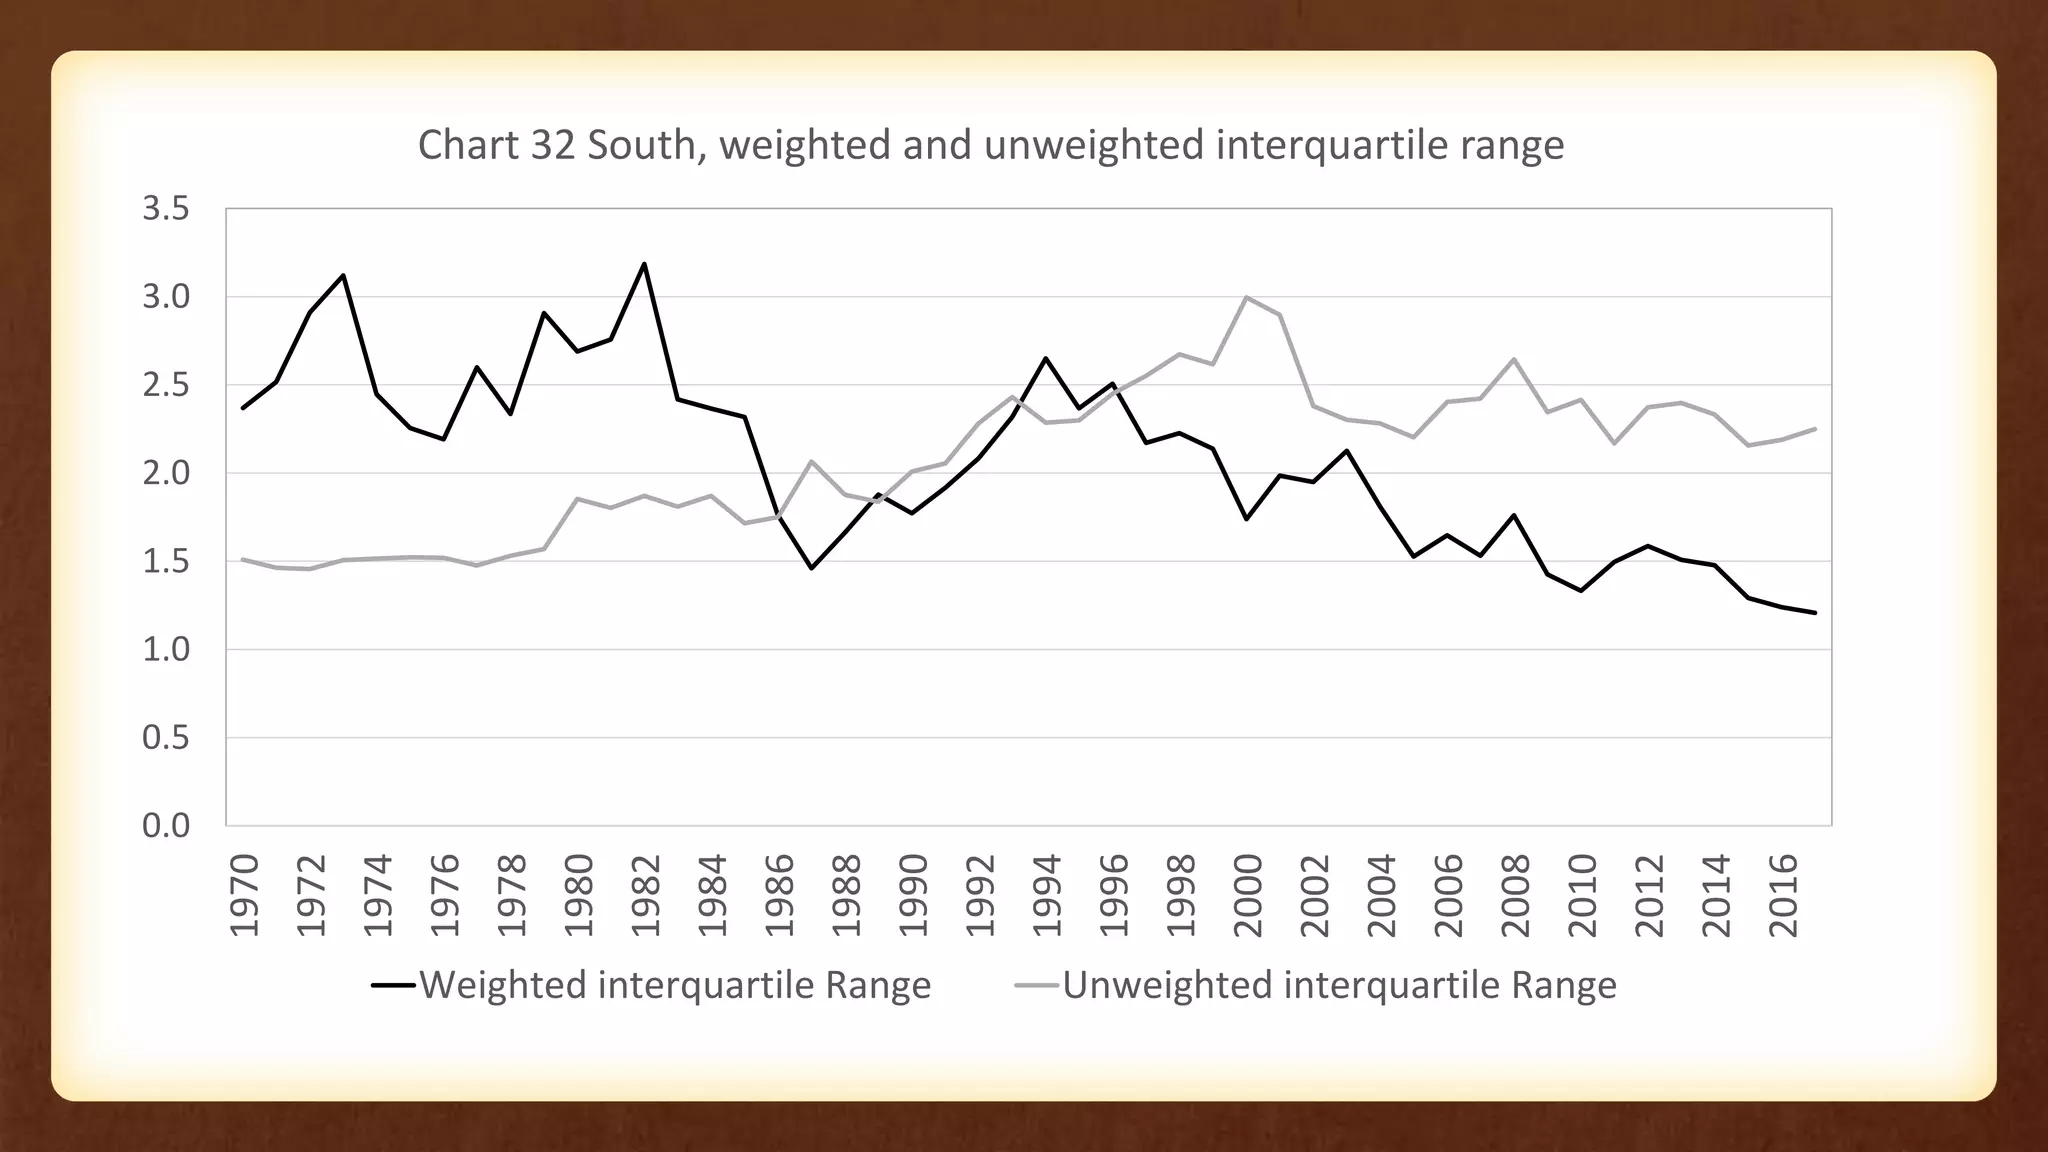

The document examines the persistence of economic inequality between and within nations, emphasizing that global disparities are a primary cause of domestic inequalities and socio-economic issues such as poverty, war, and racism. It critiques existing economic measures and institutions for failing to account for these disparities, highlighting the stark contrasts in GDP per capita between the Global North and South. Furthermore, it suggests that a significant part of the solution to poverty lies in increasing incomes across the Global South.


