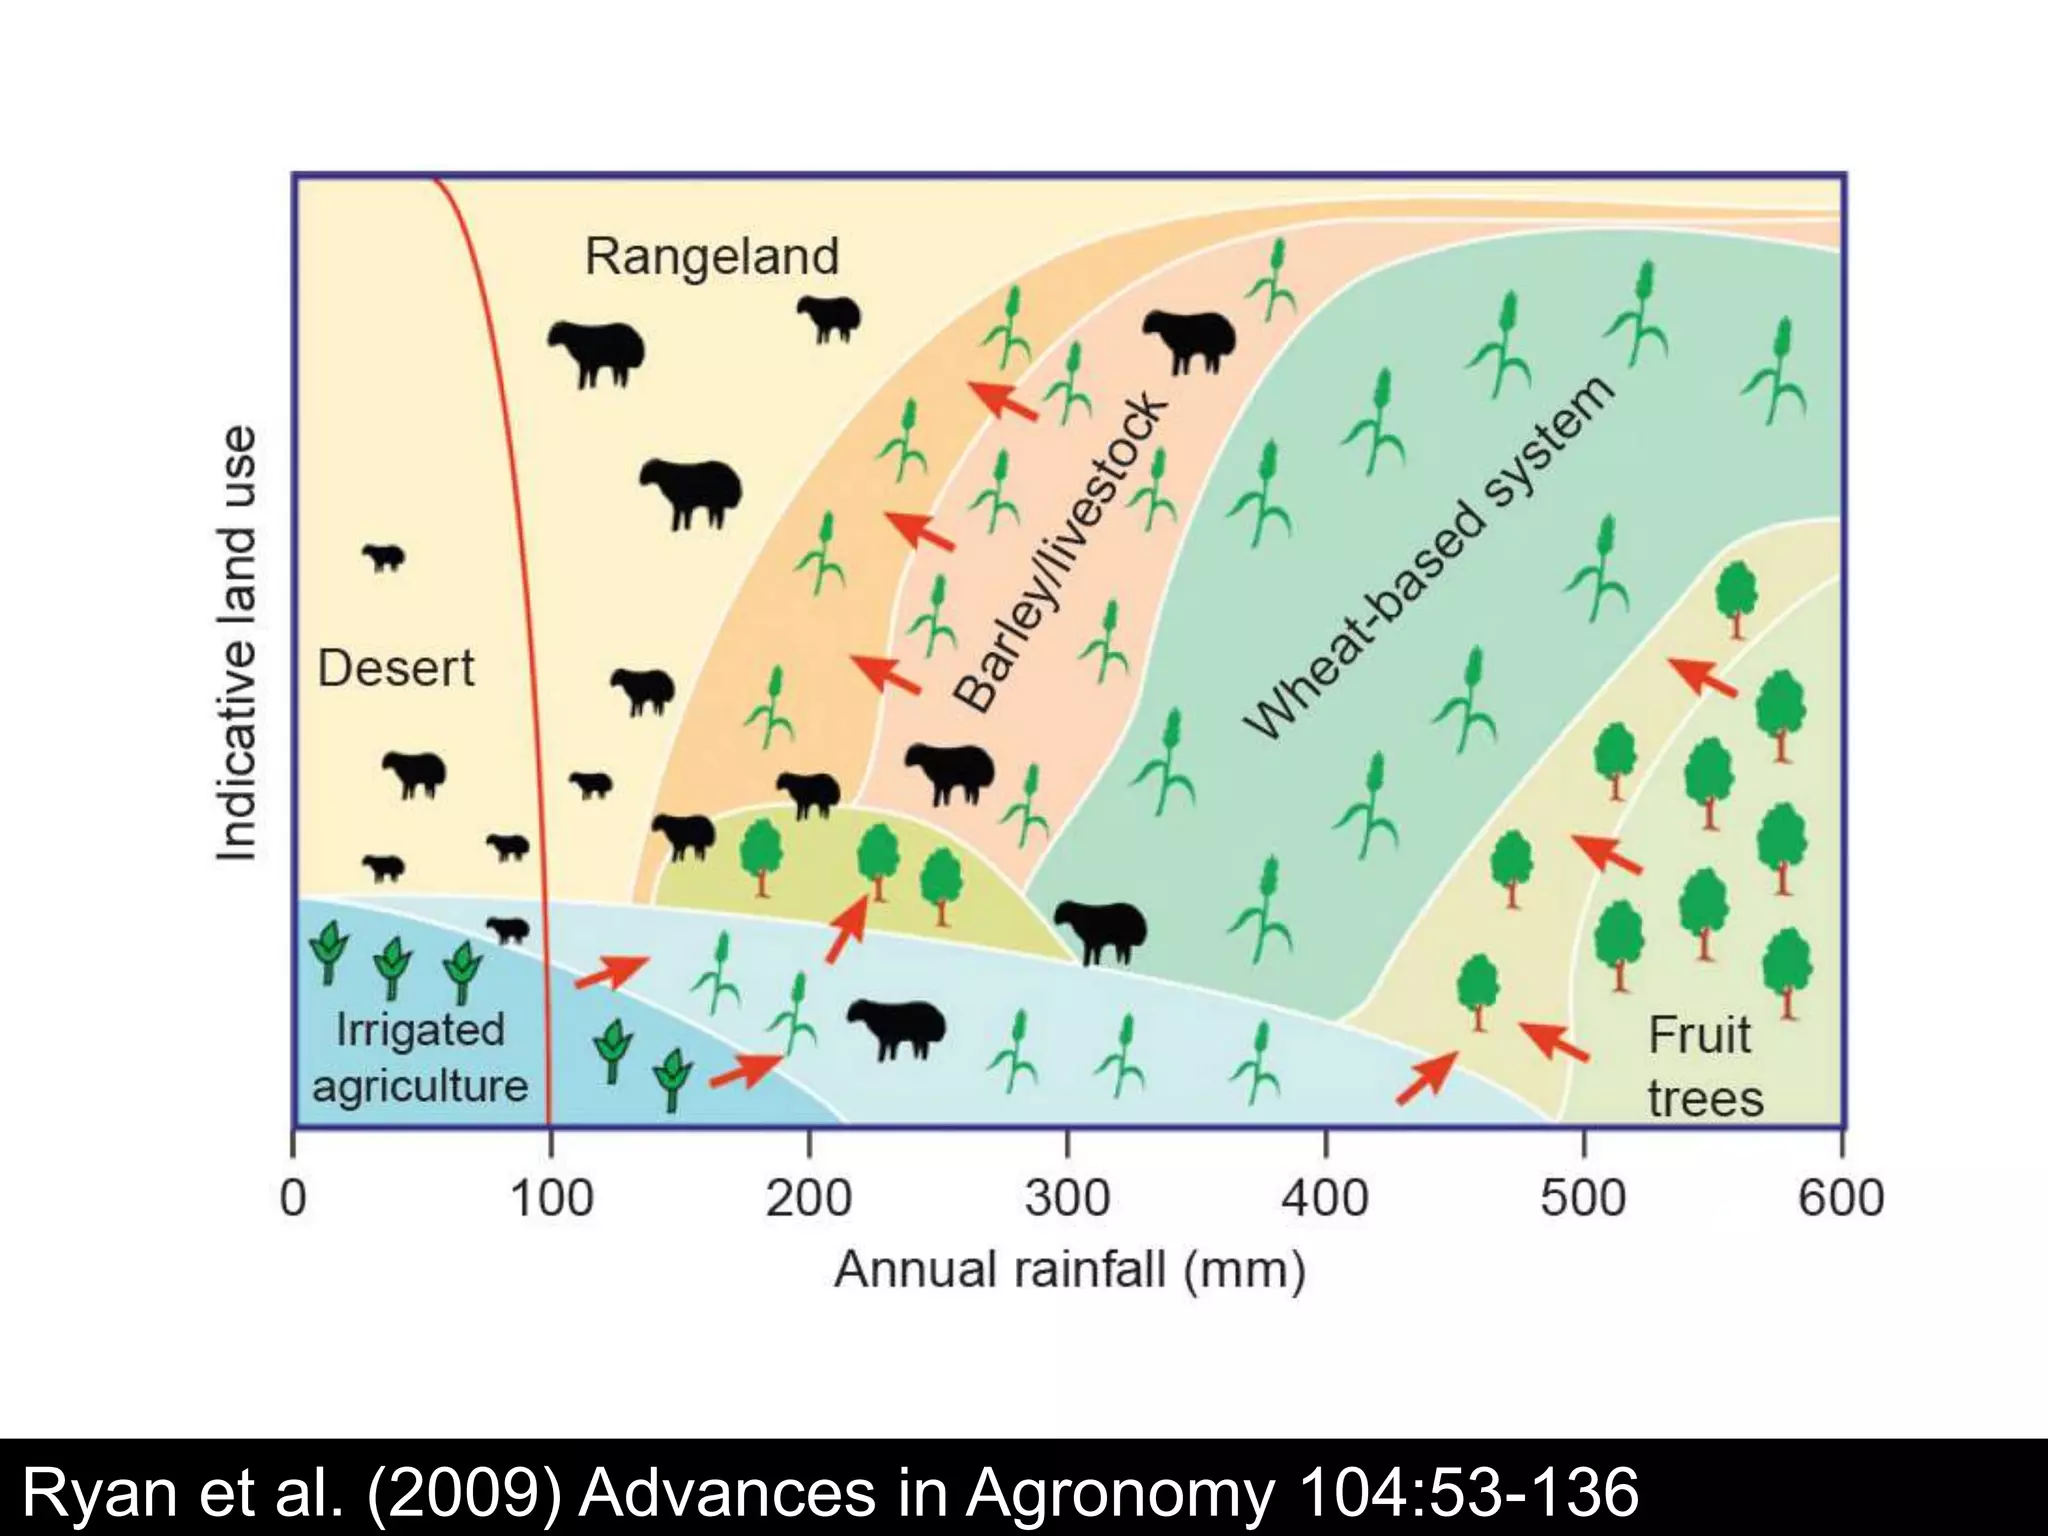
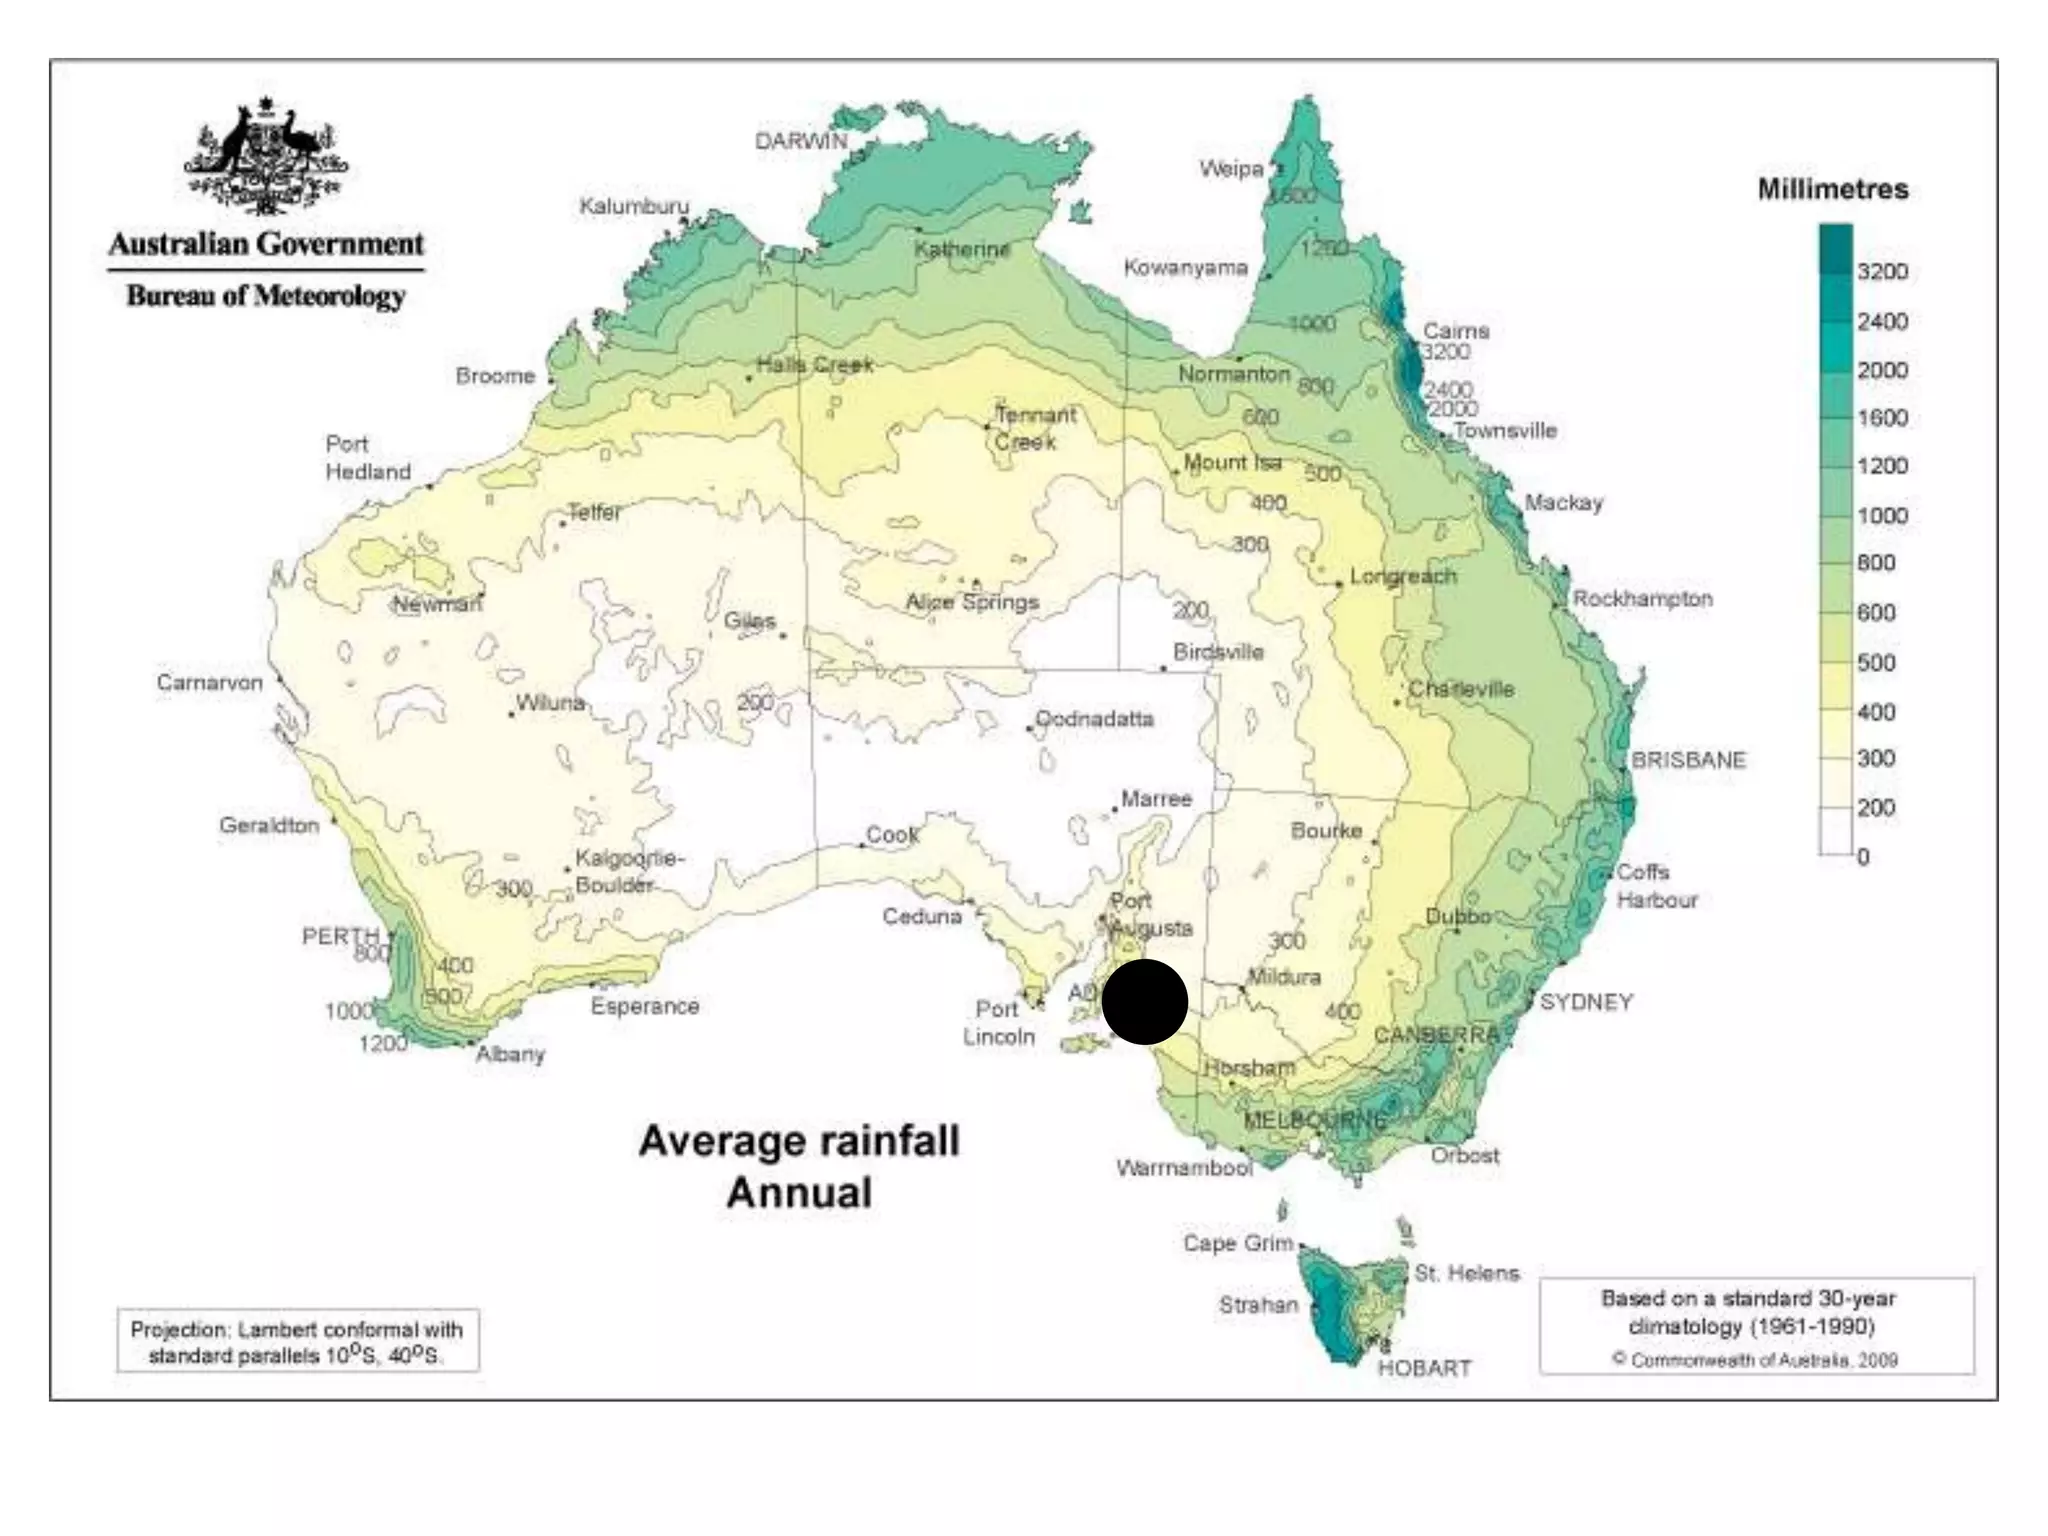
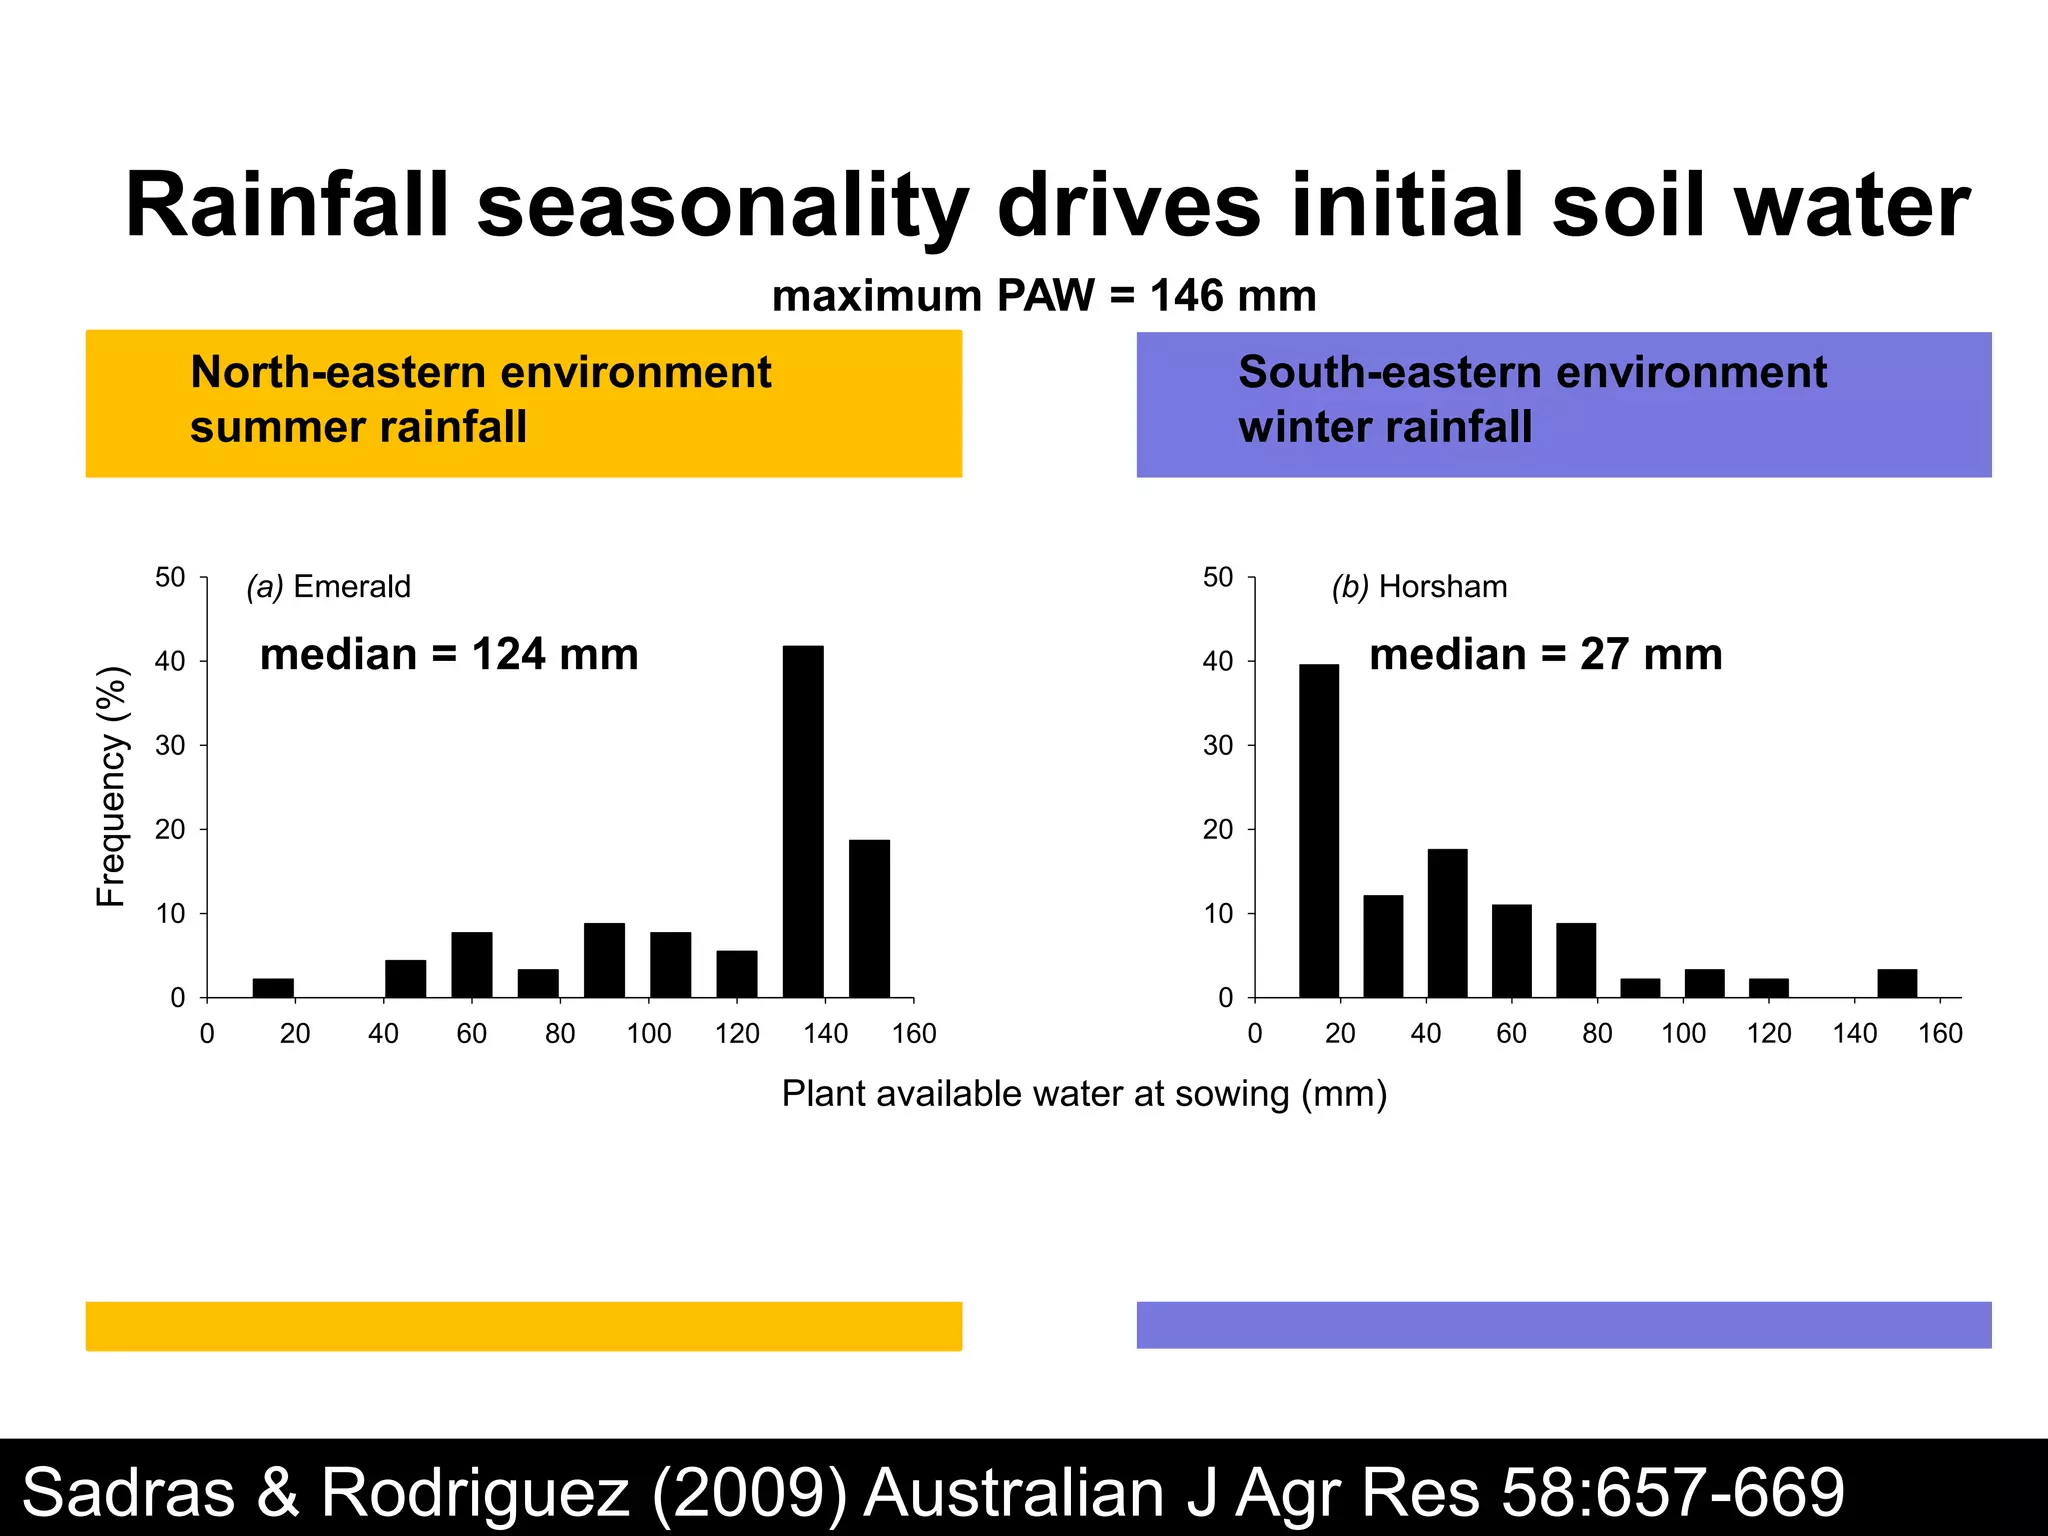
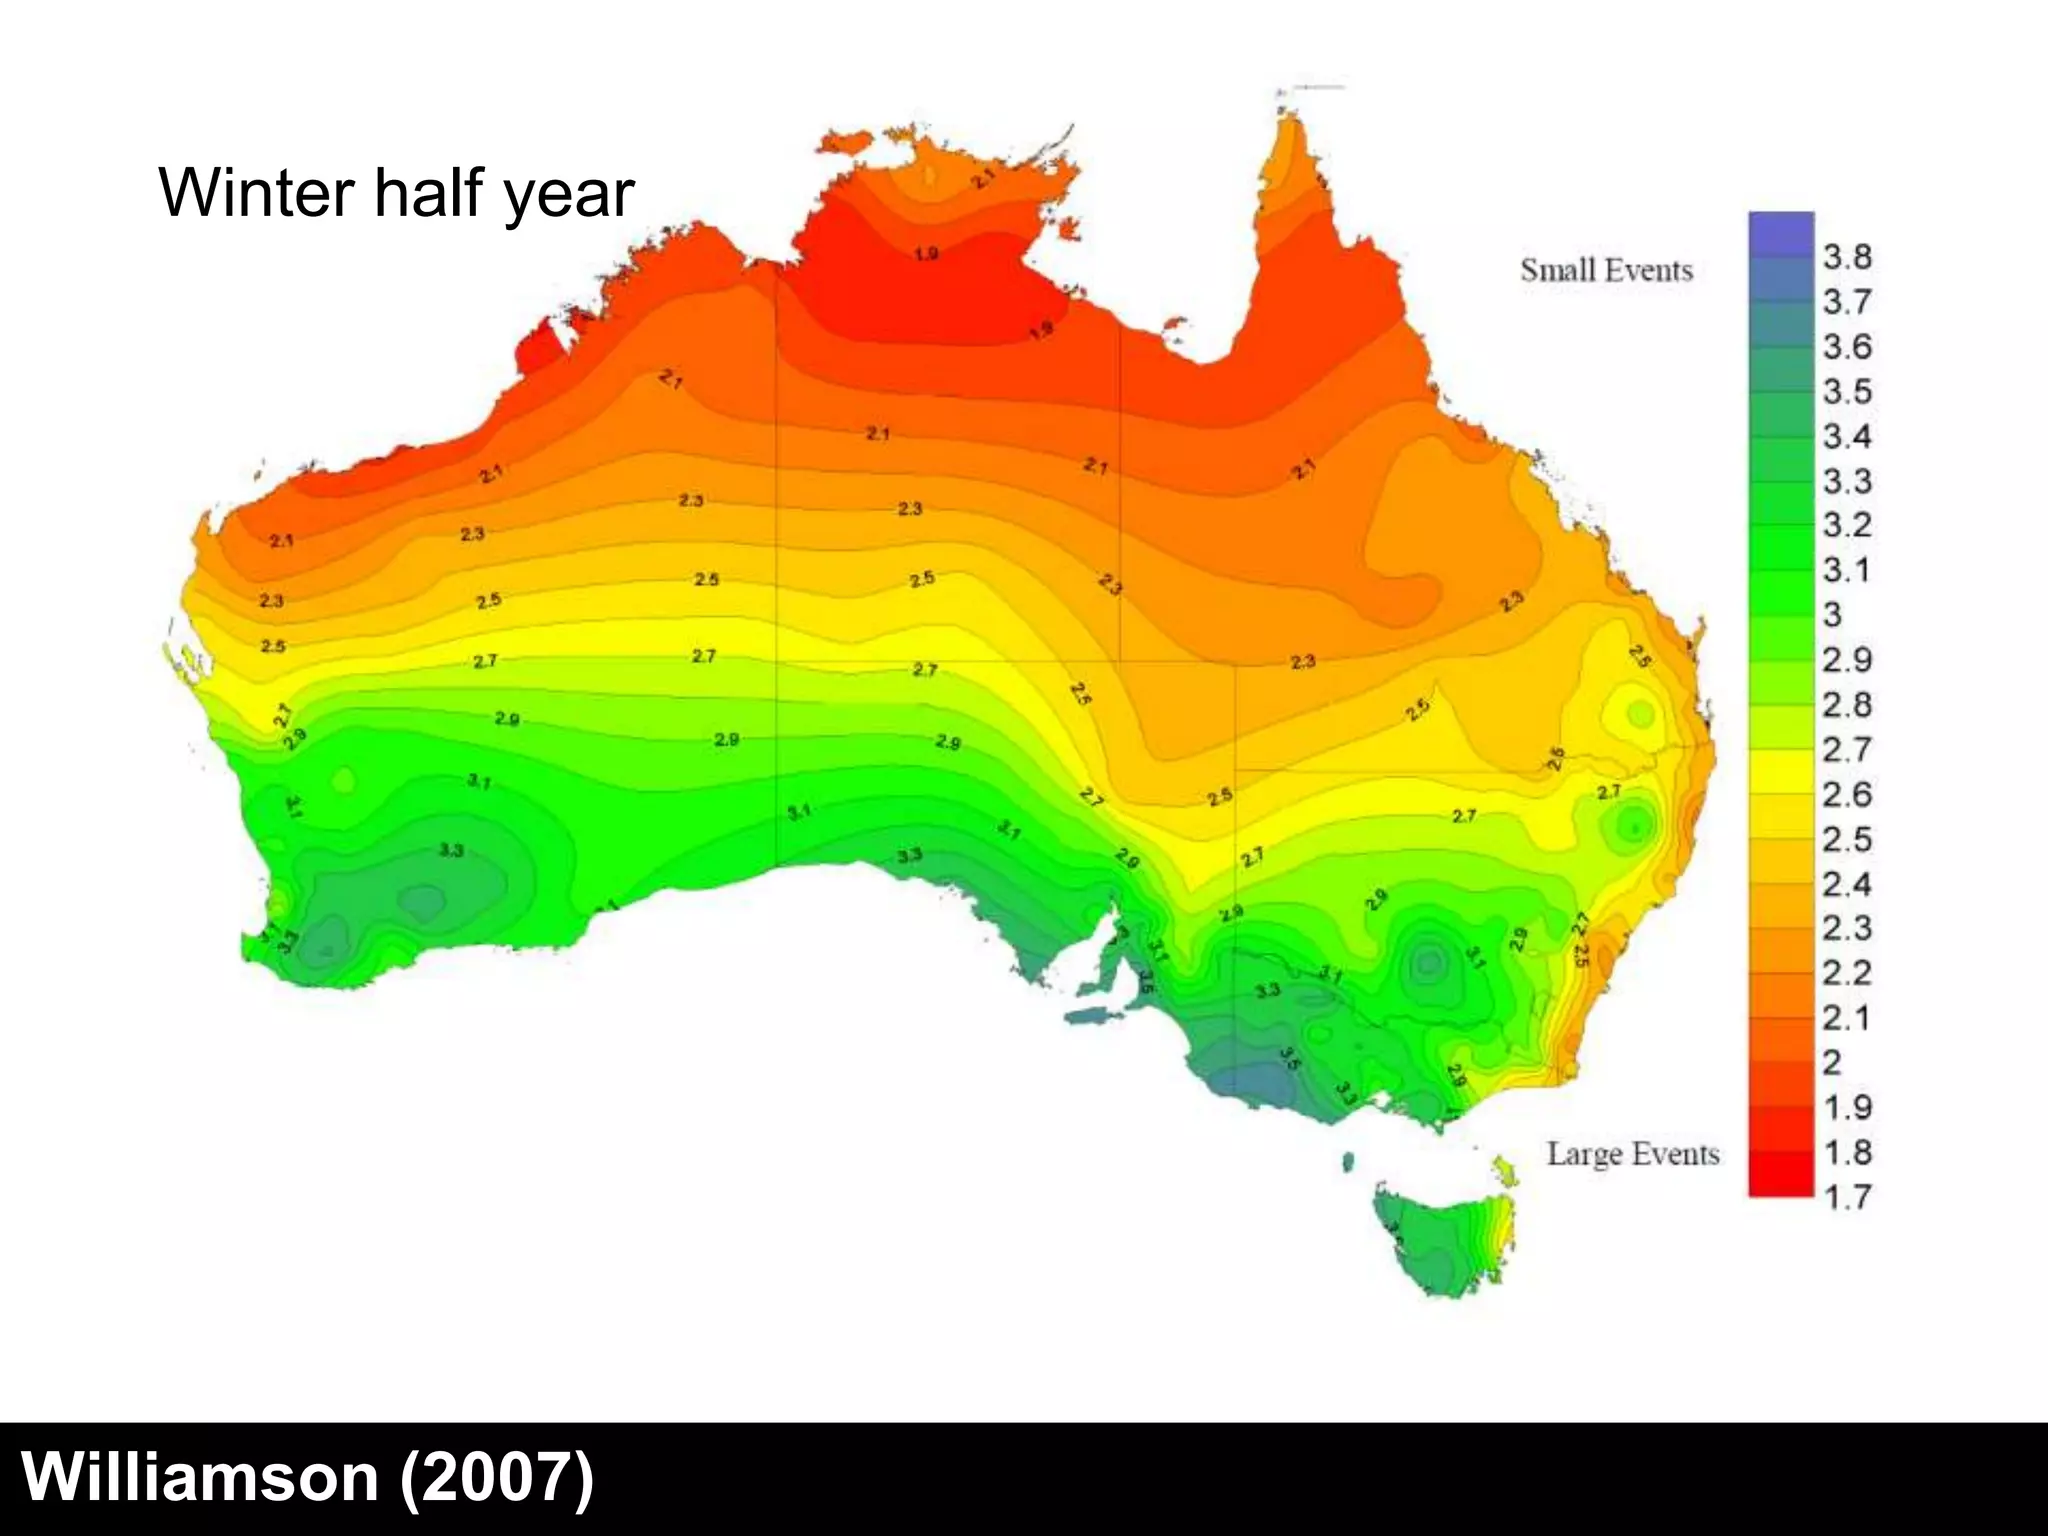
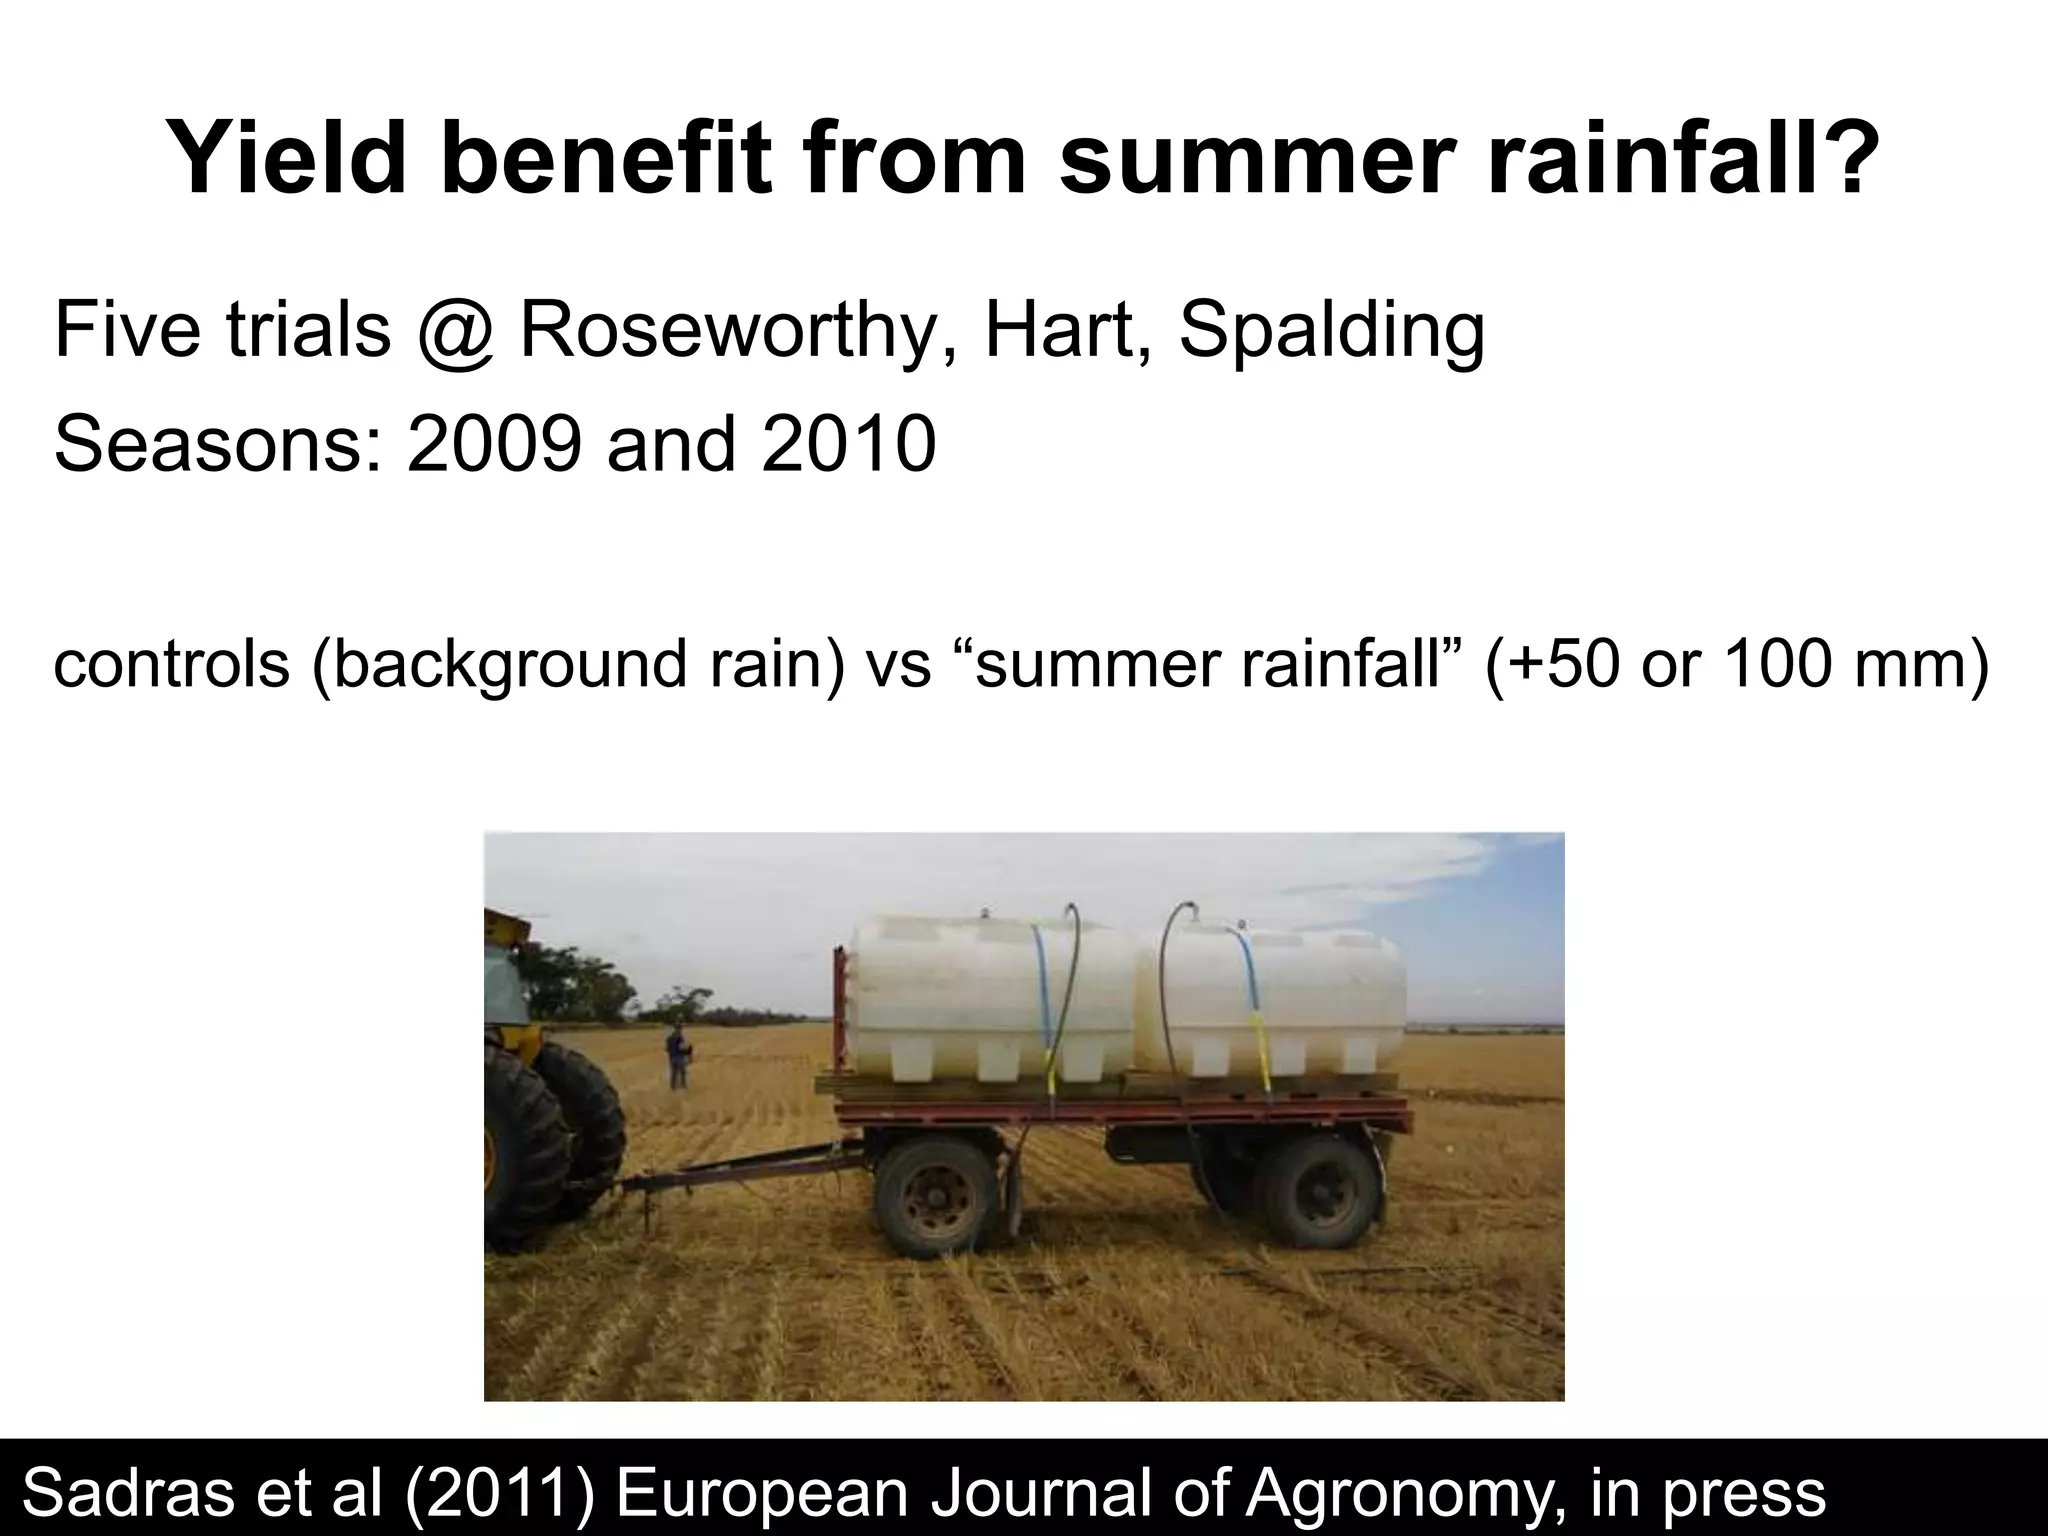
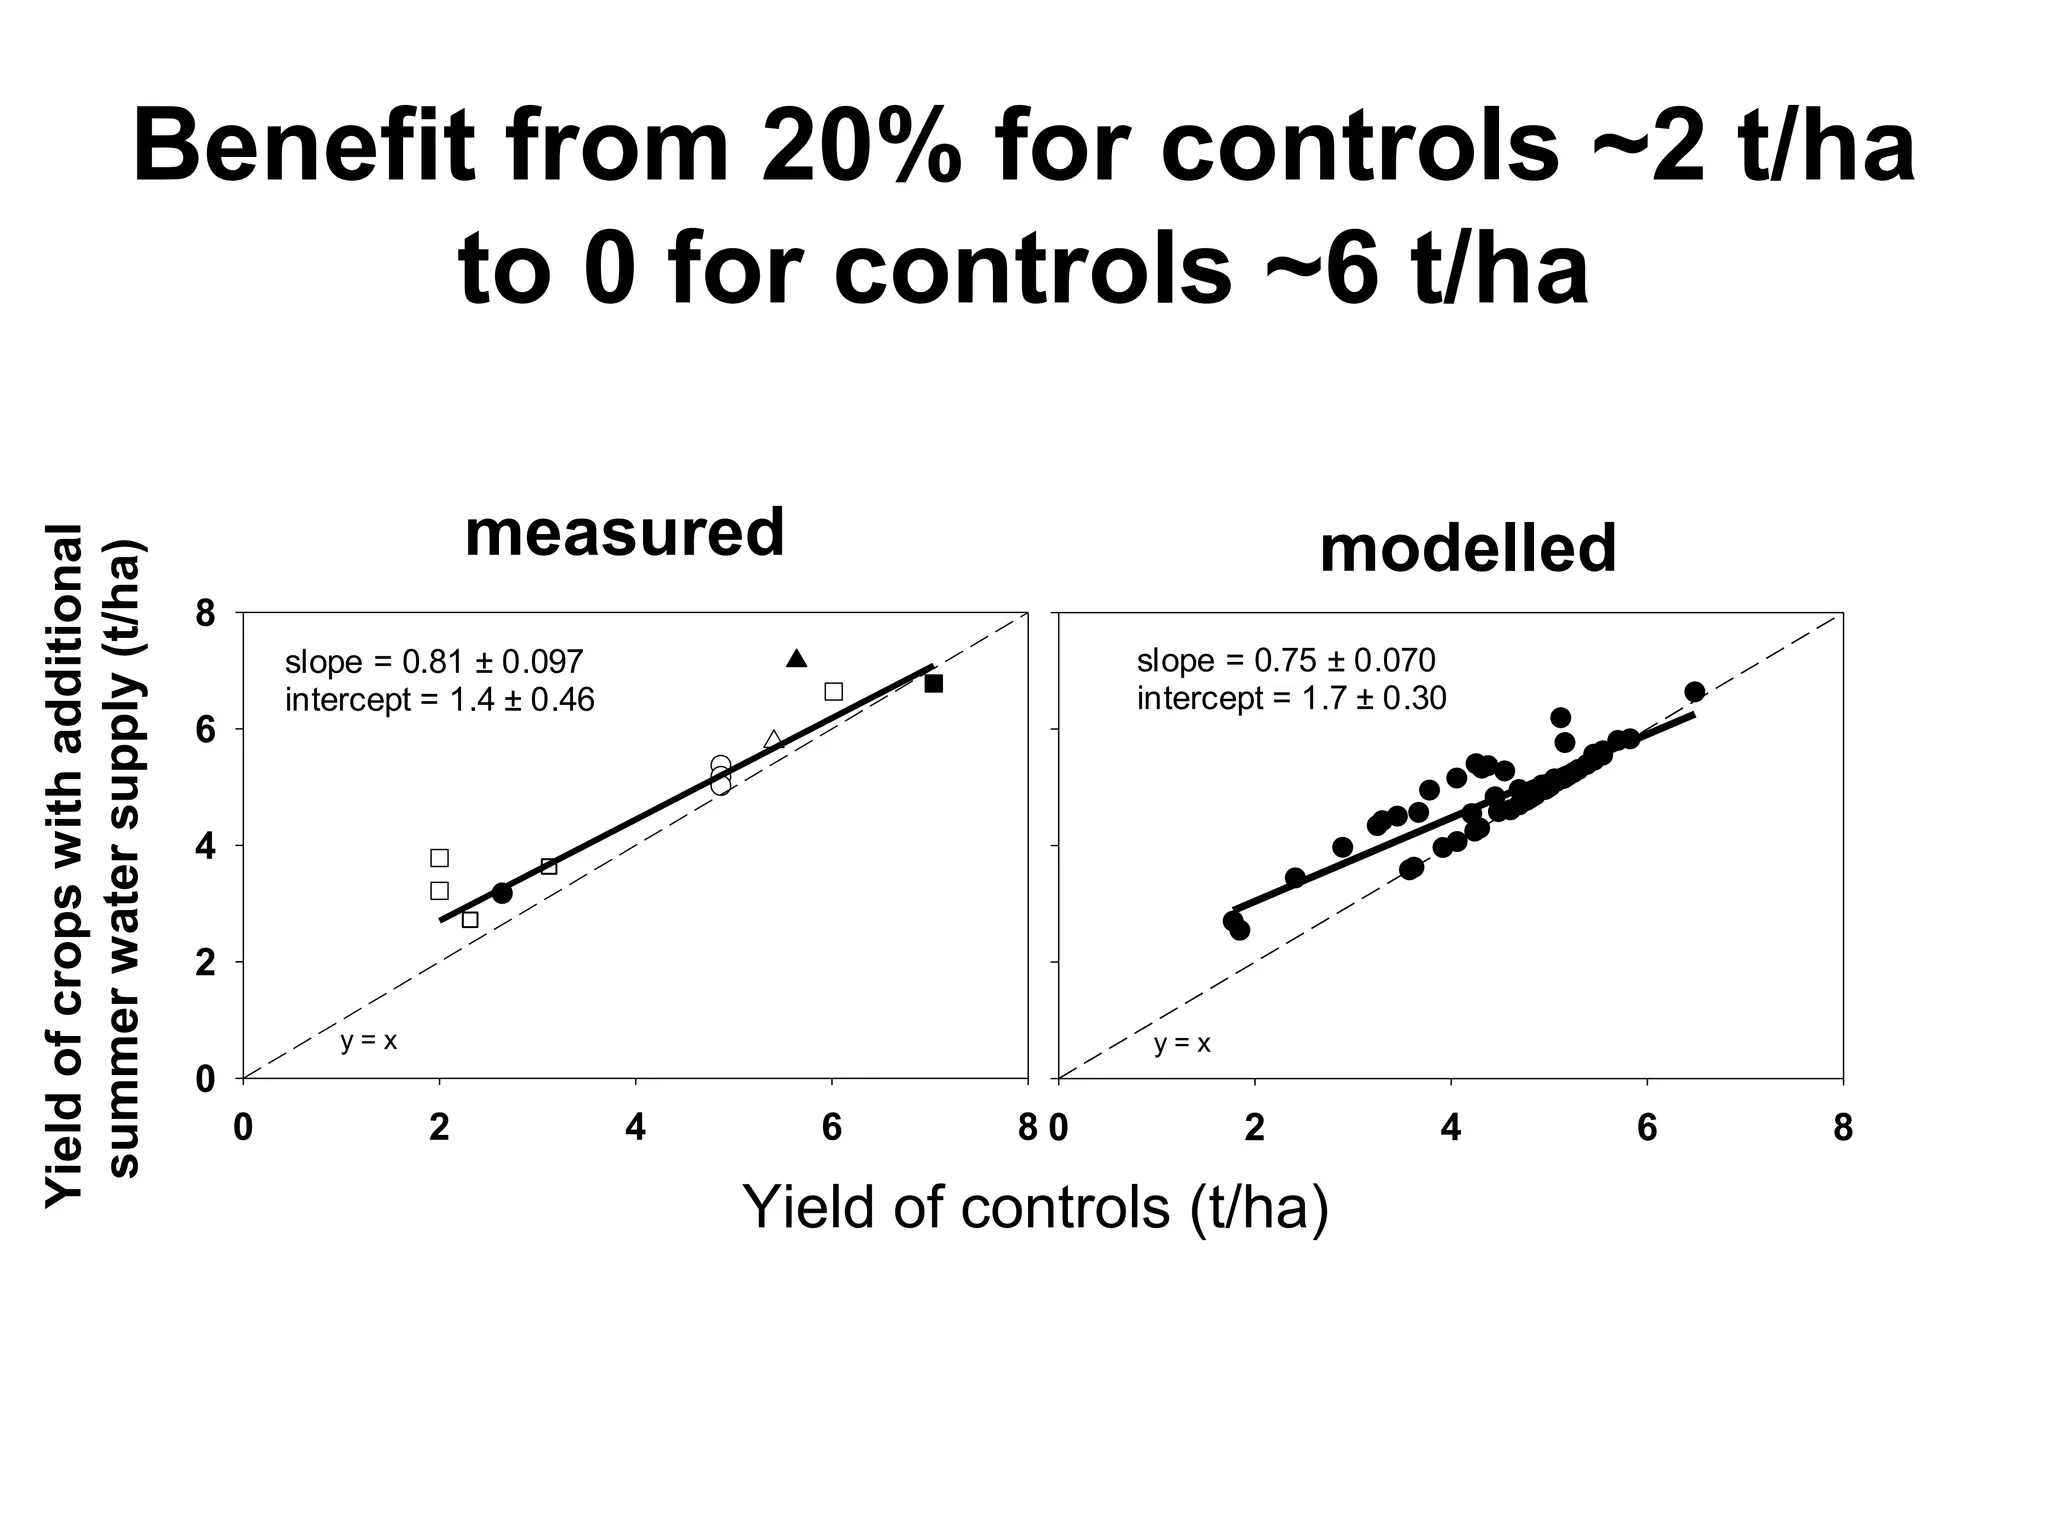
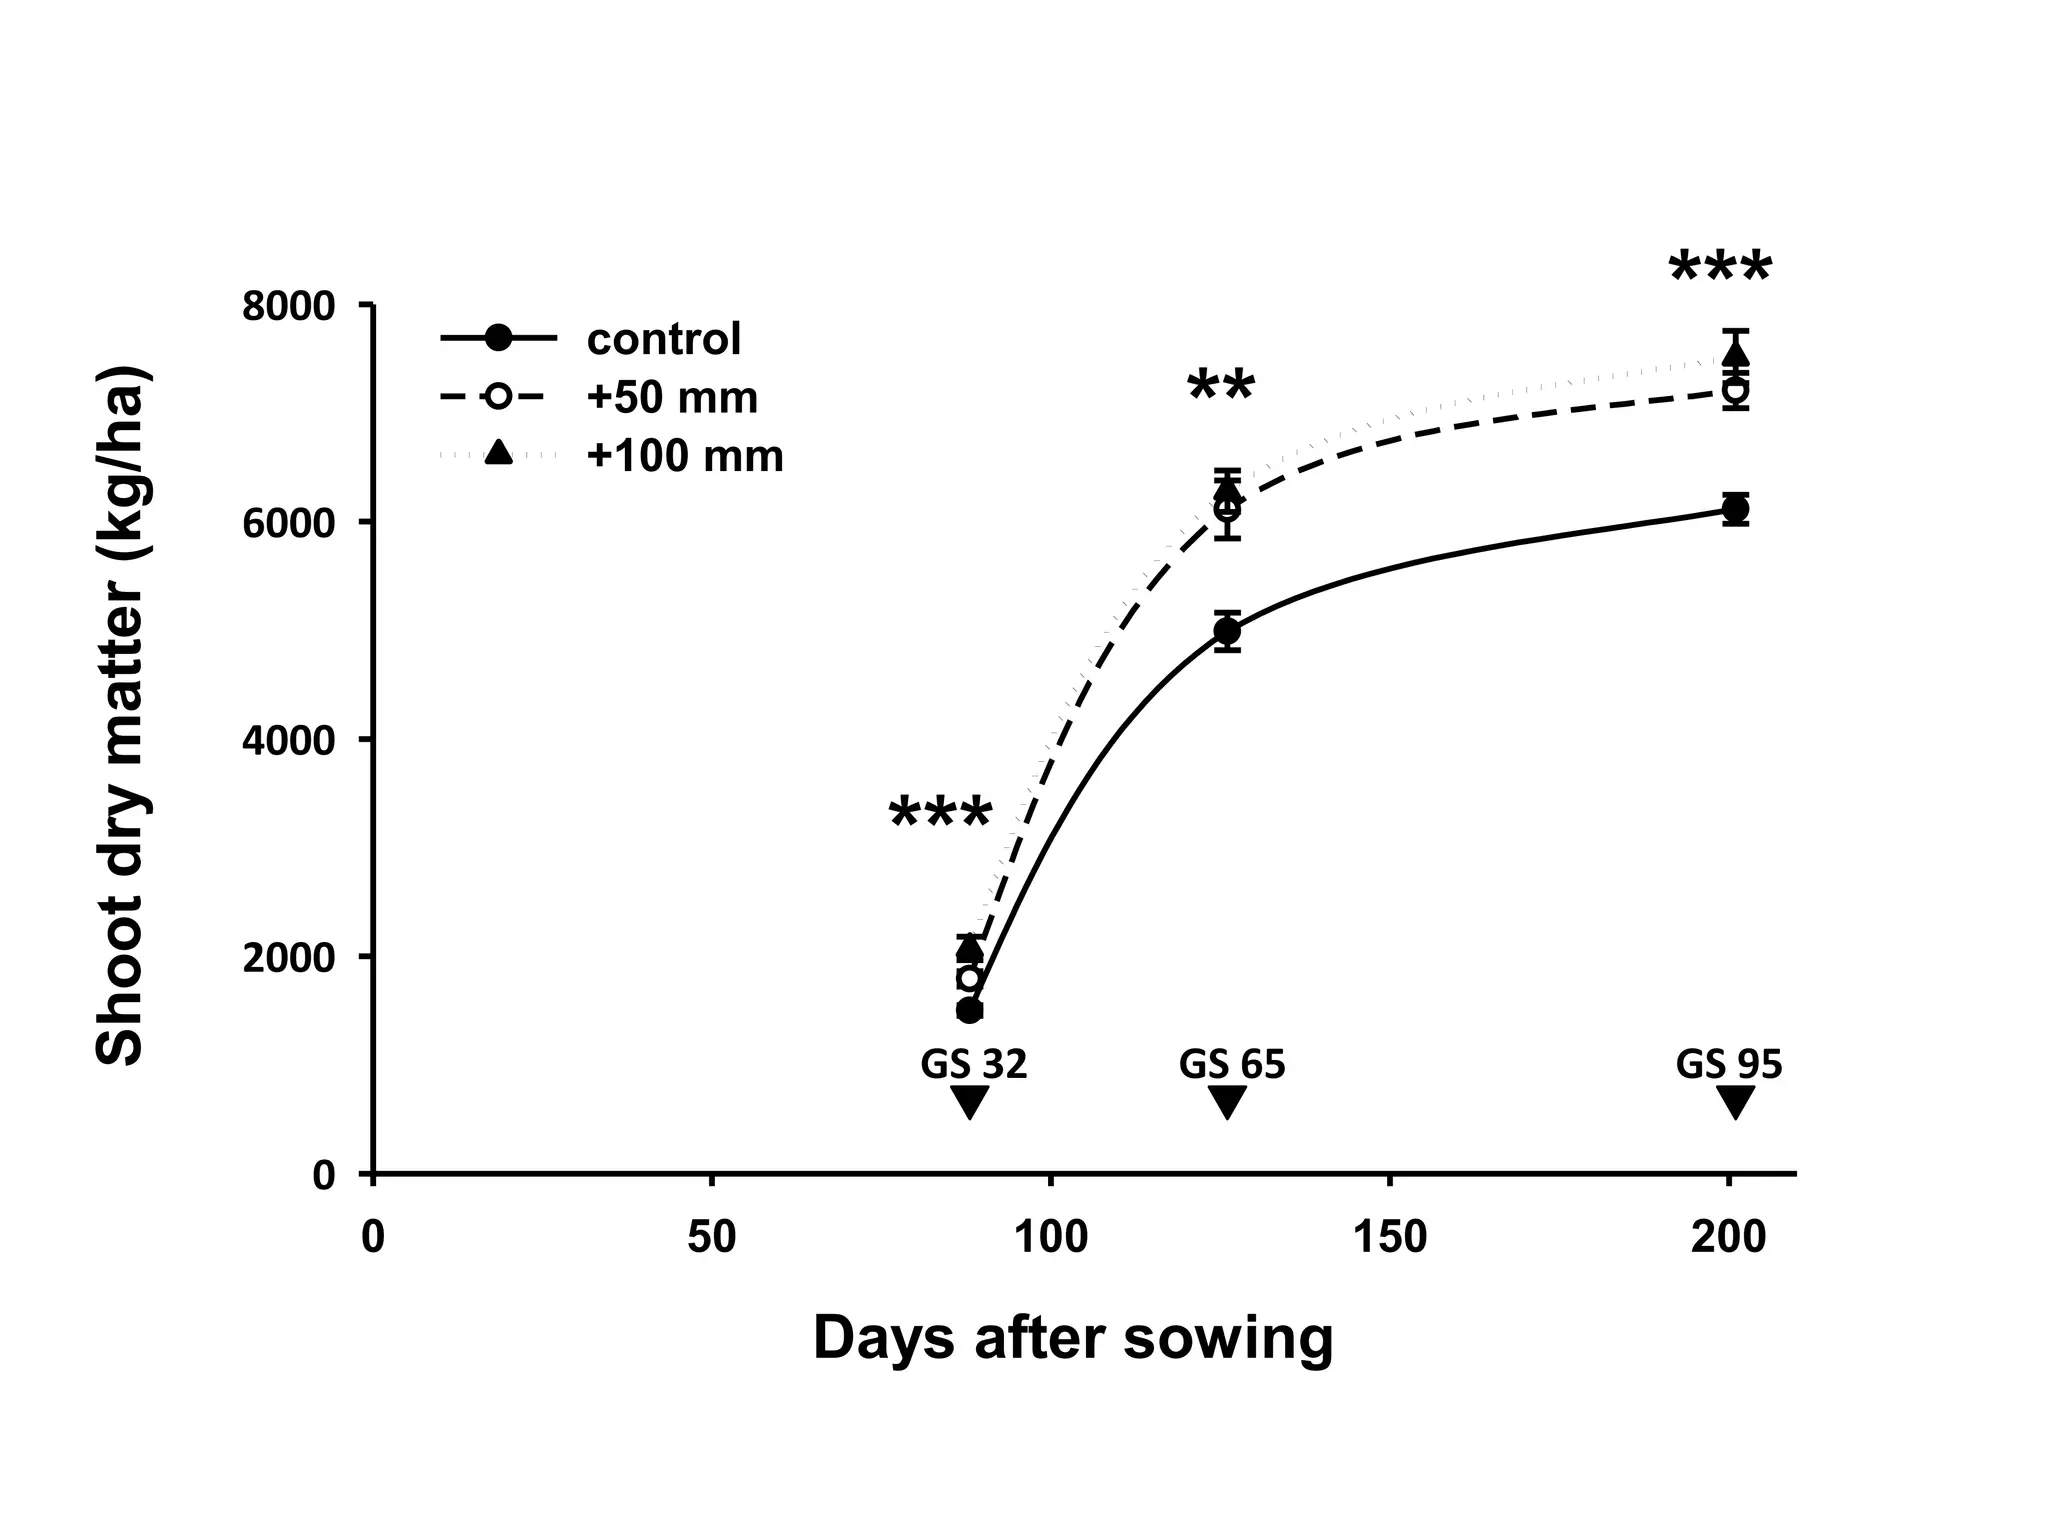
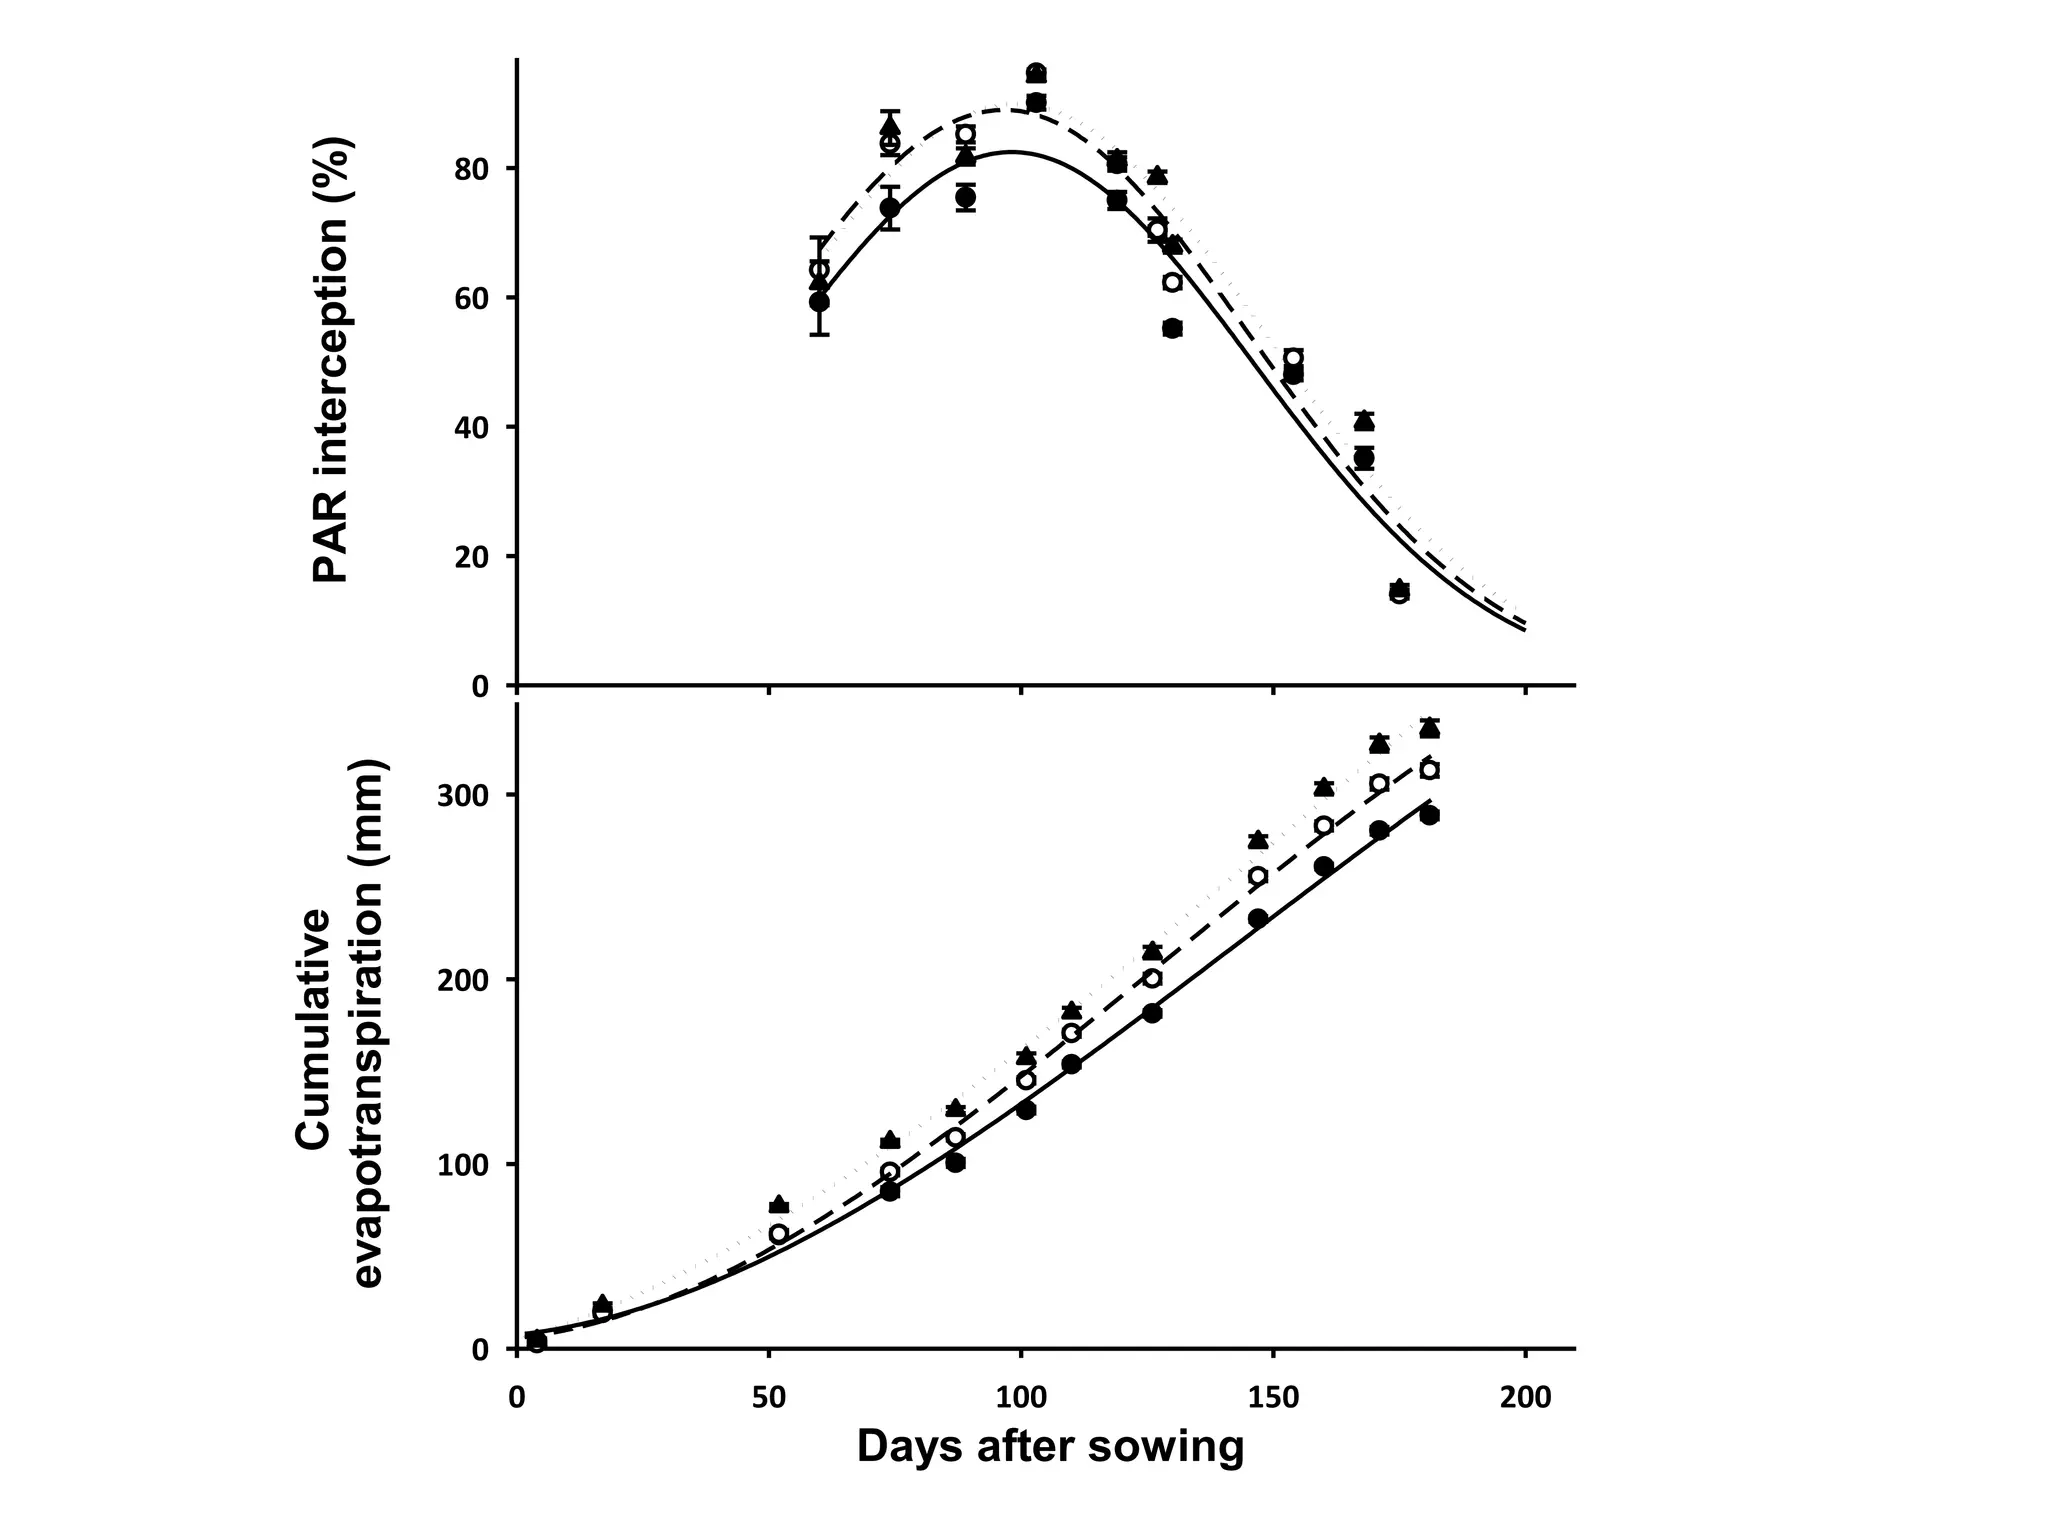
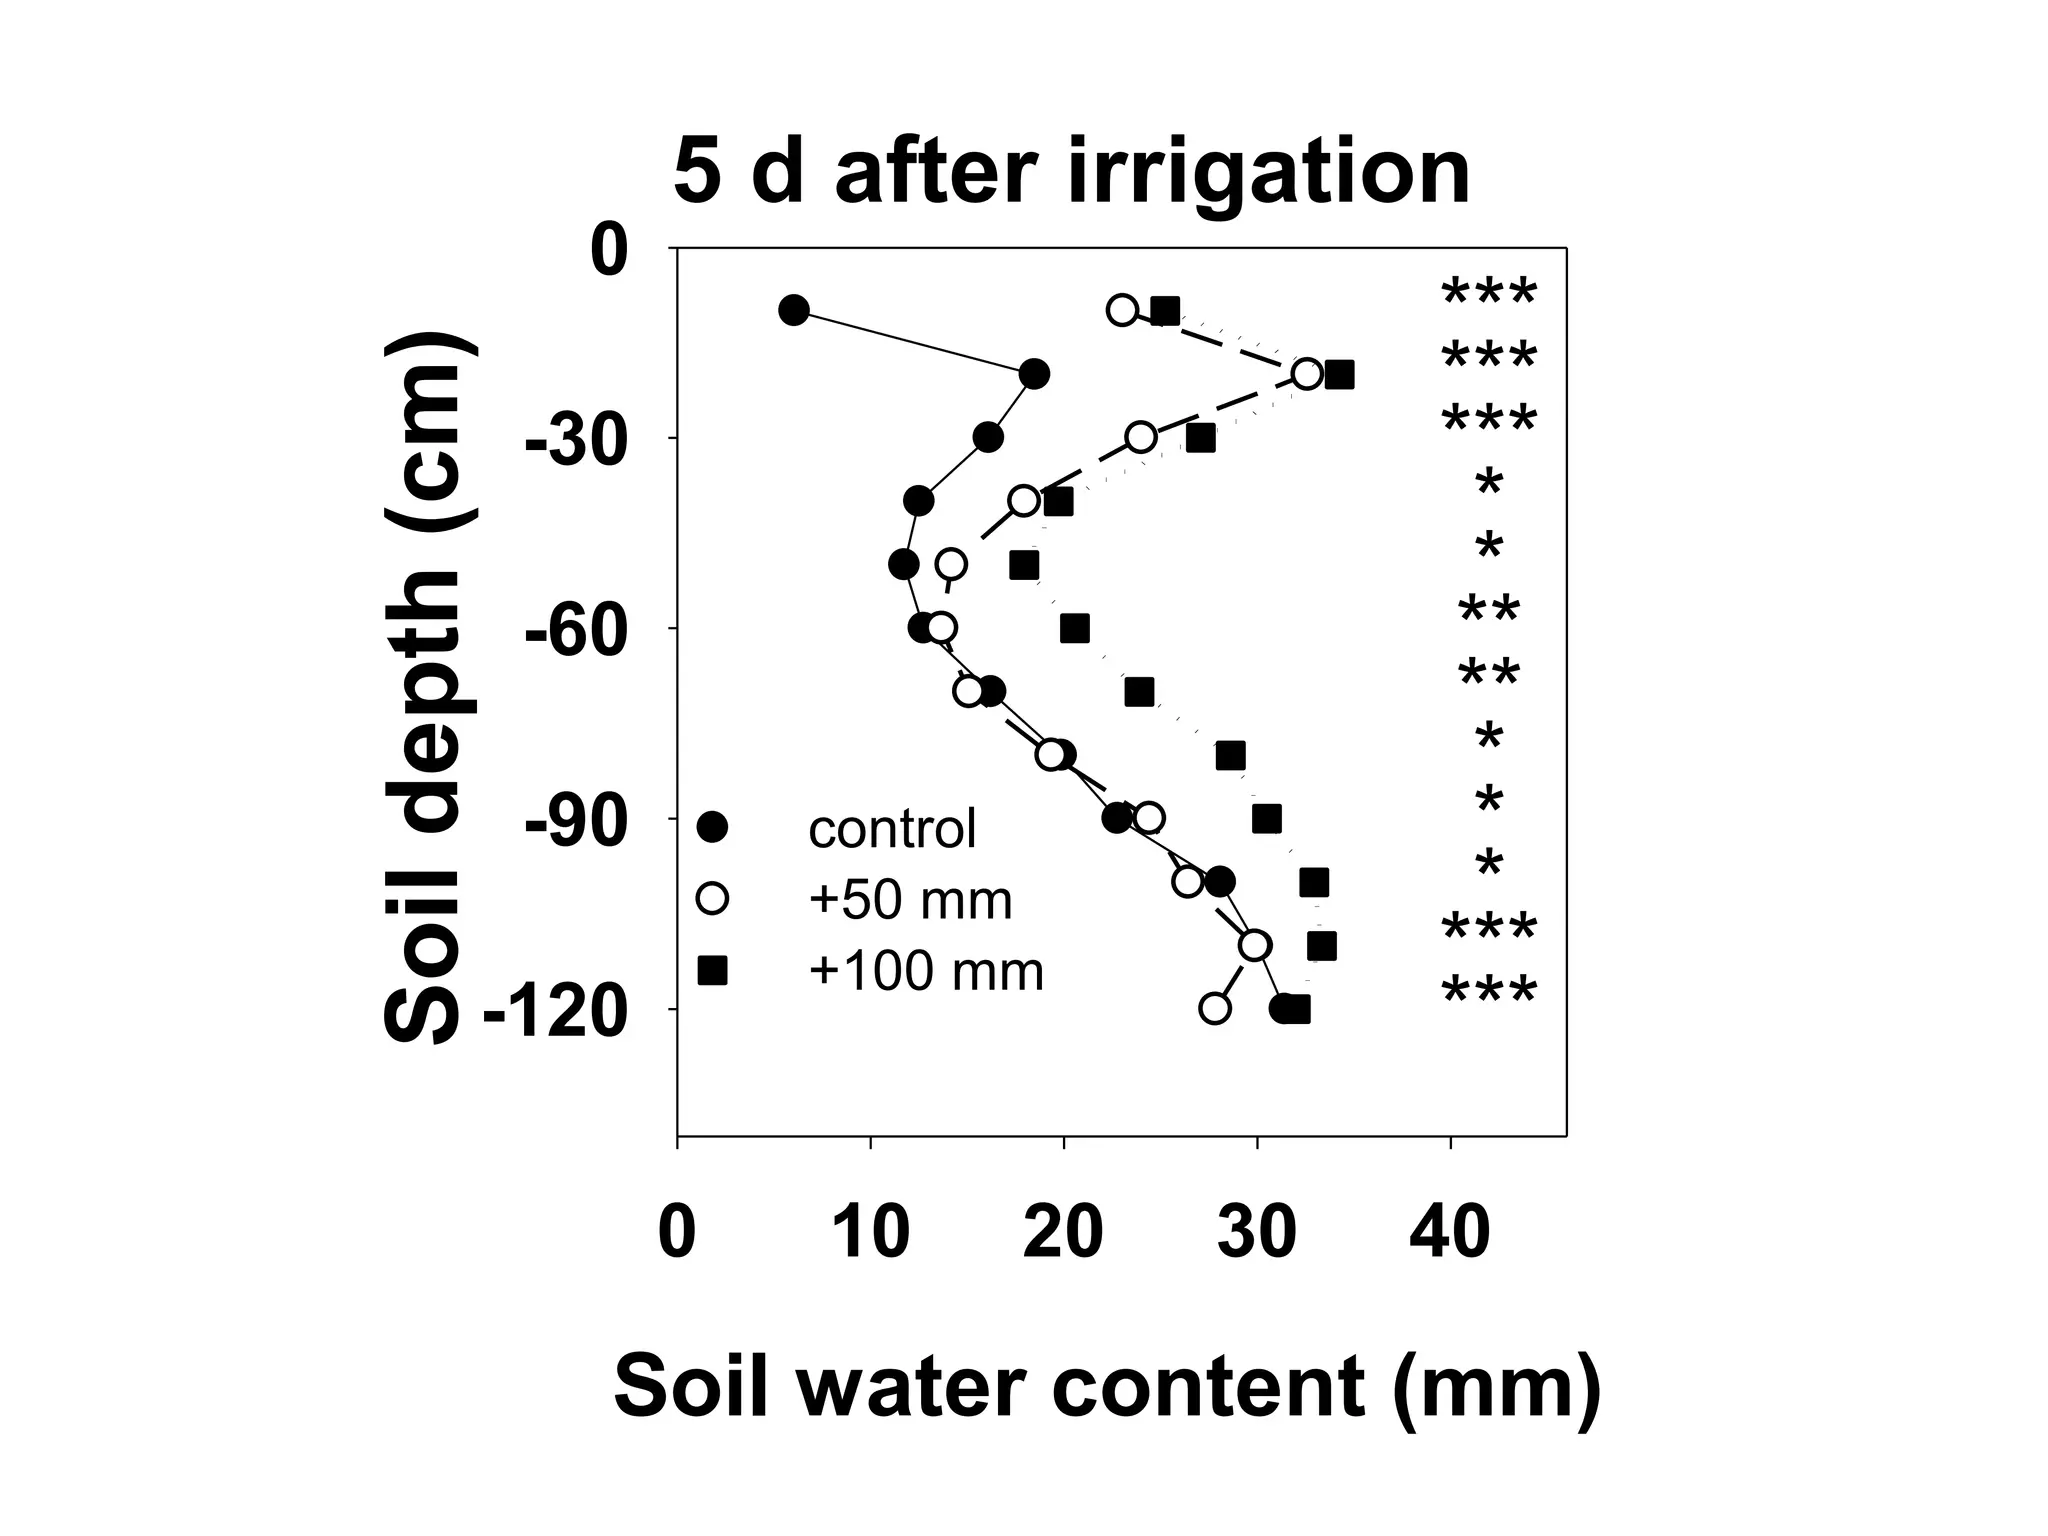
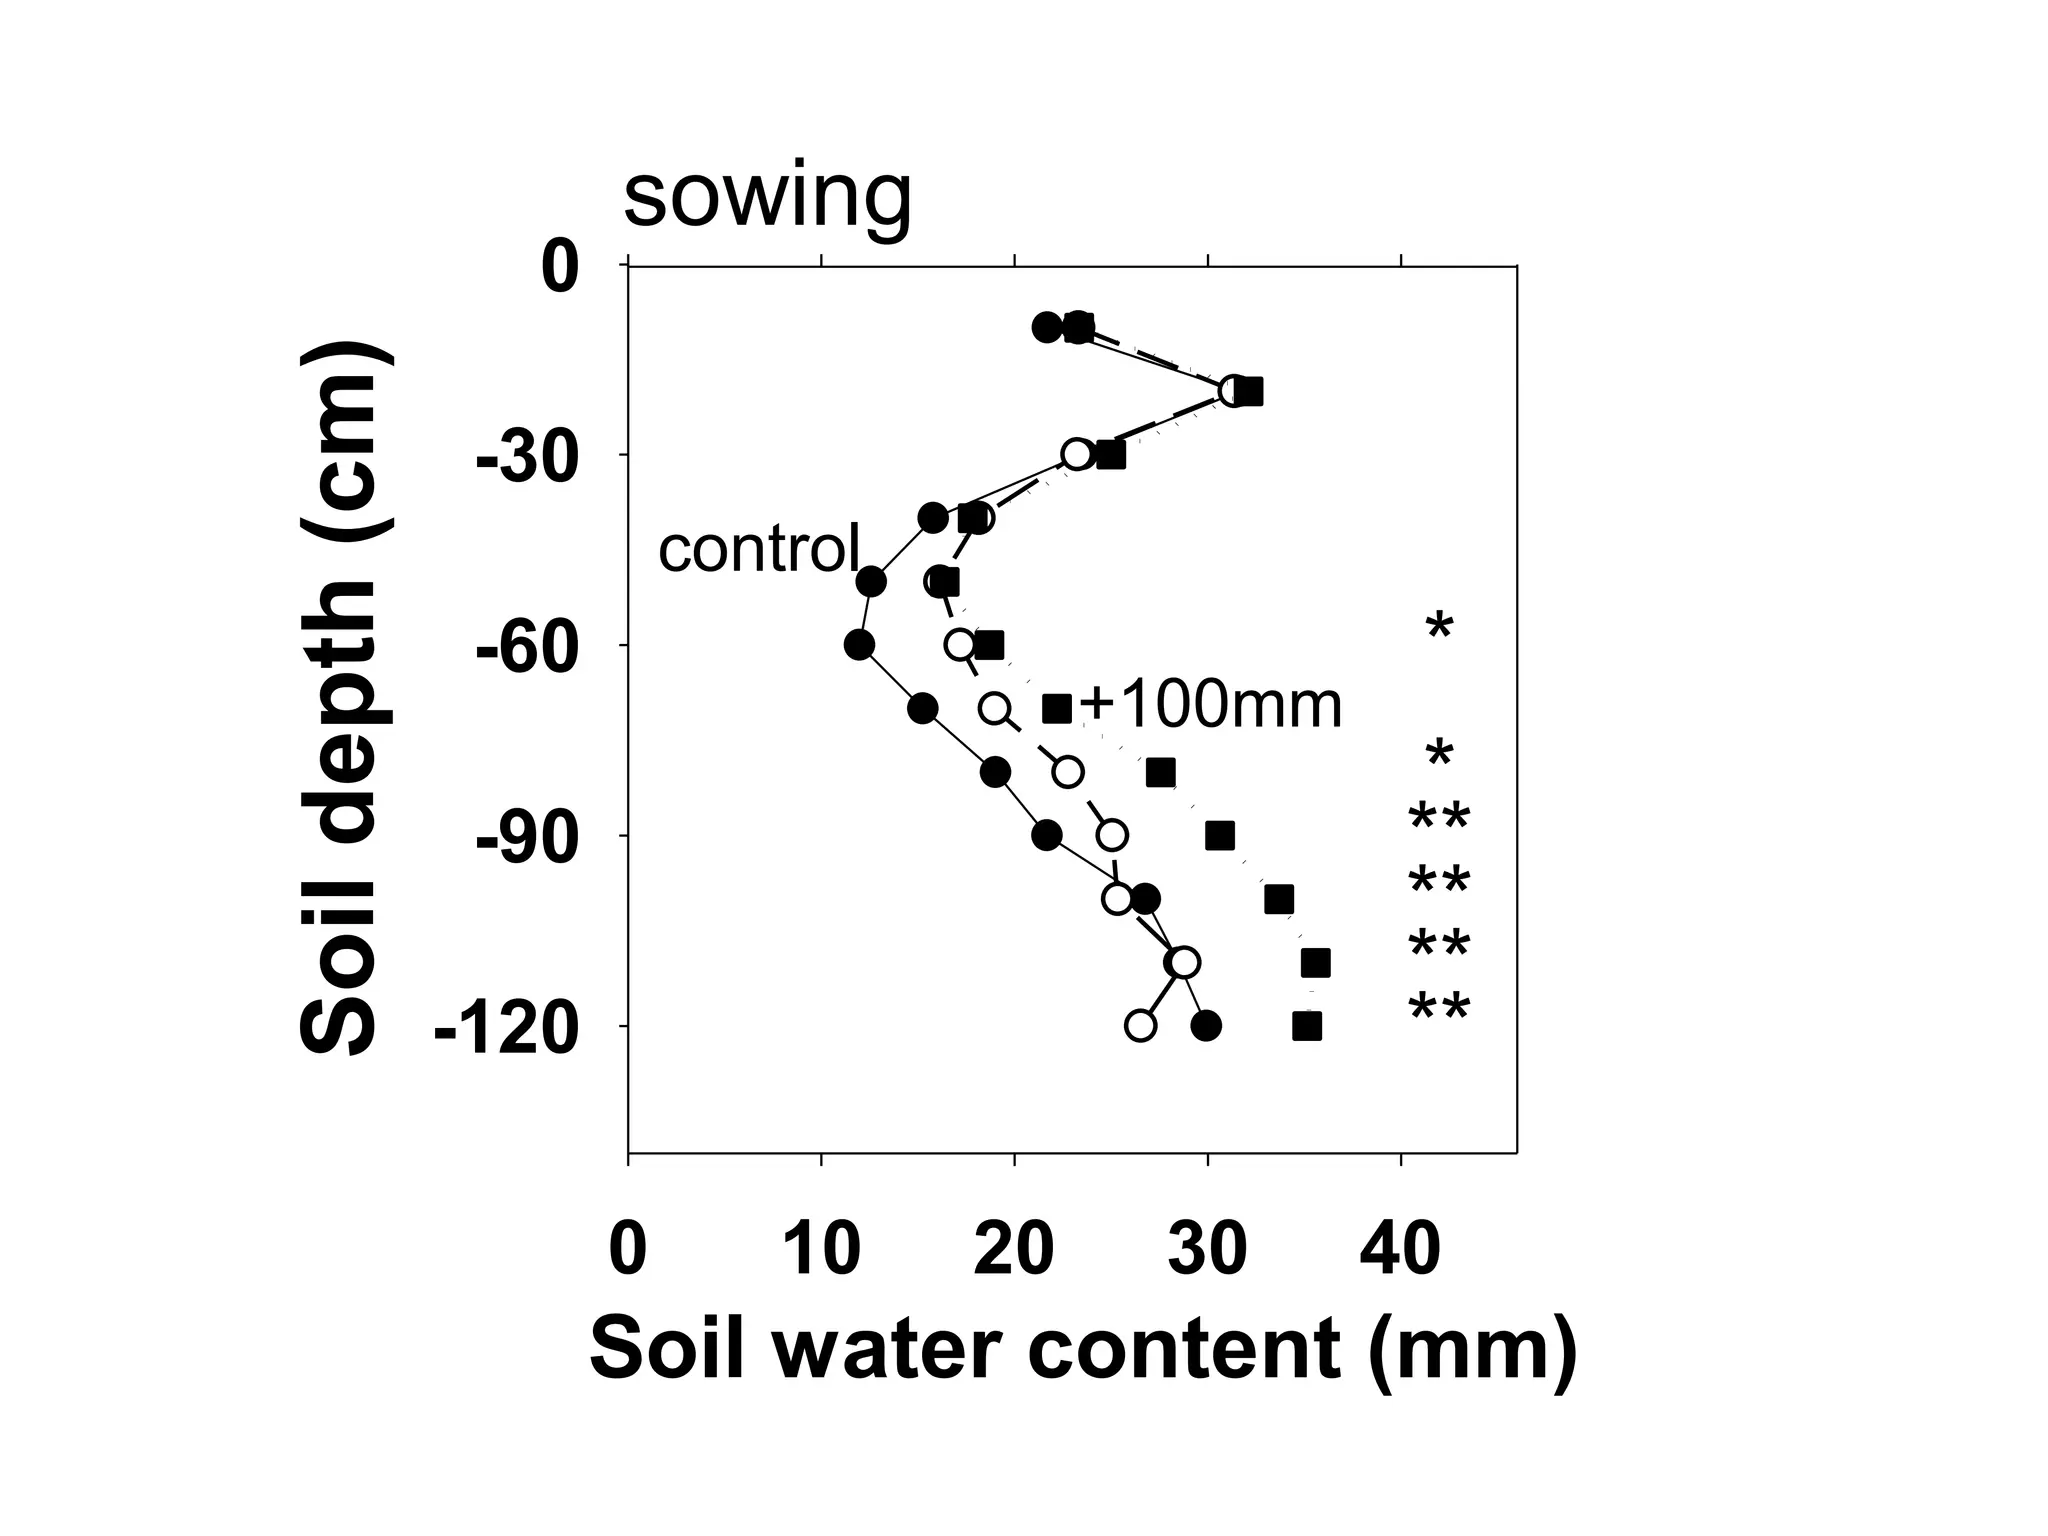
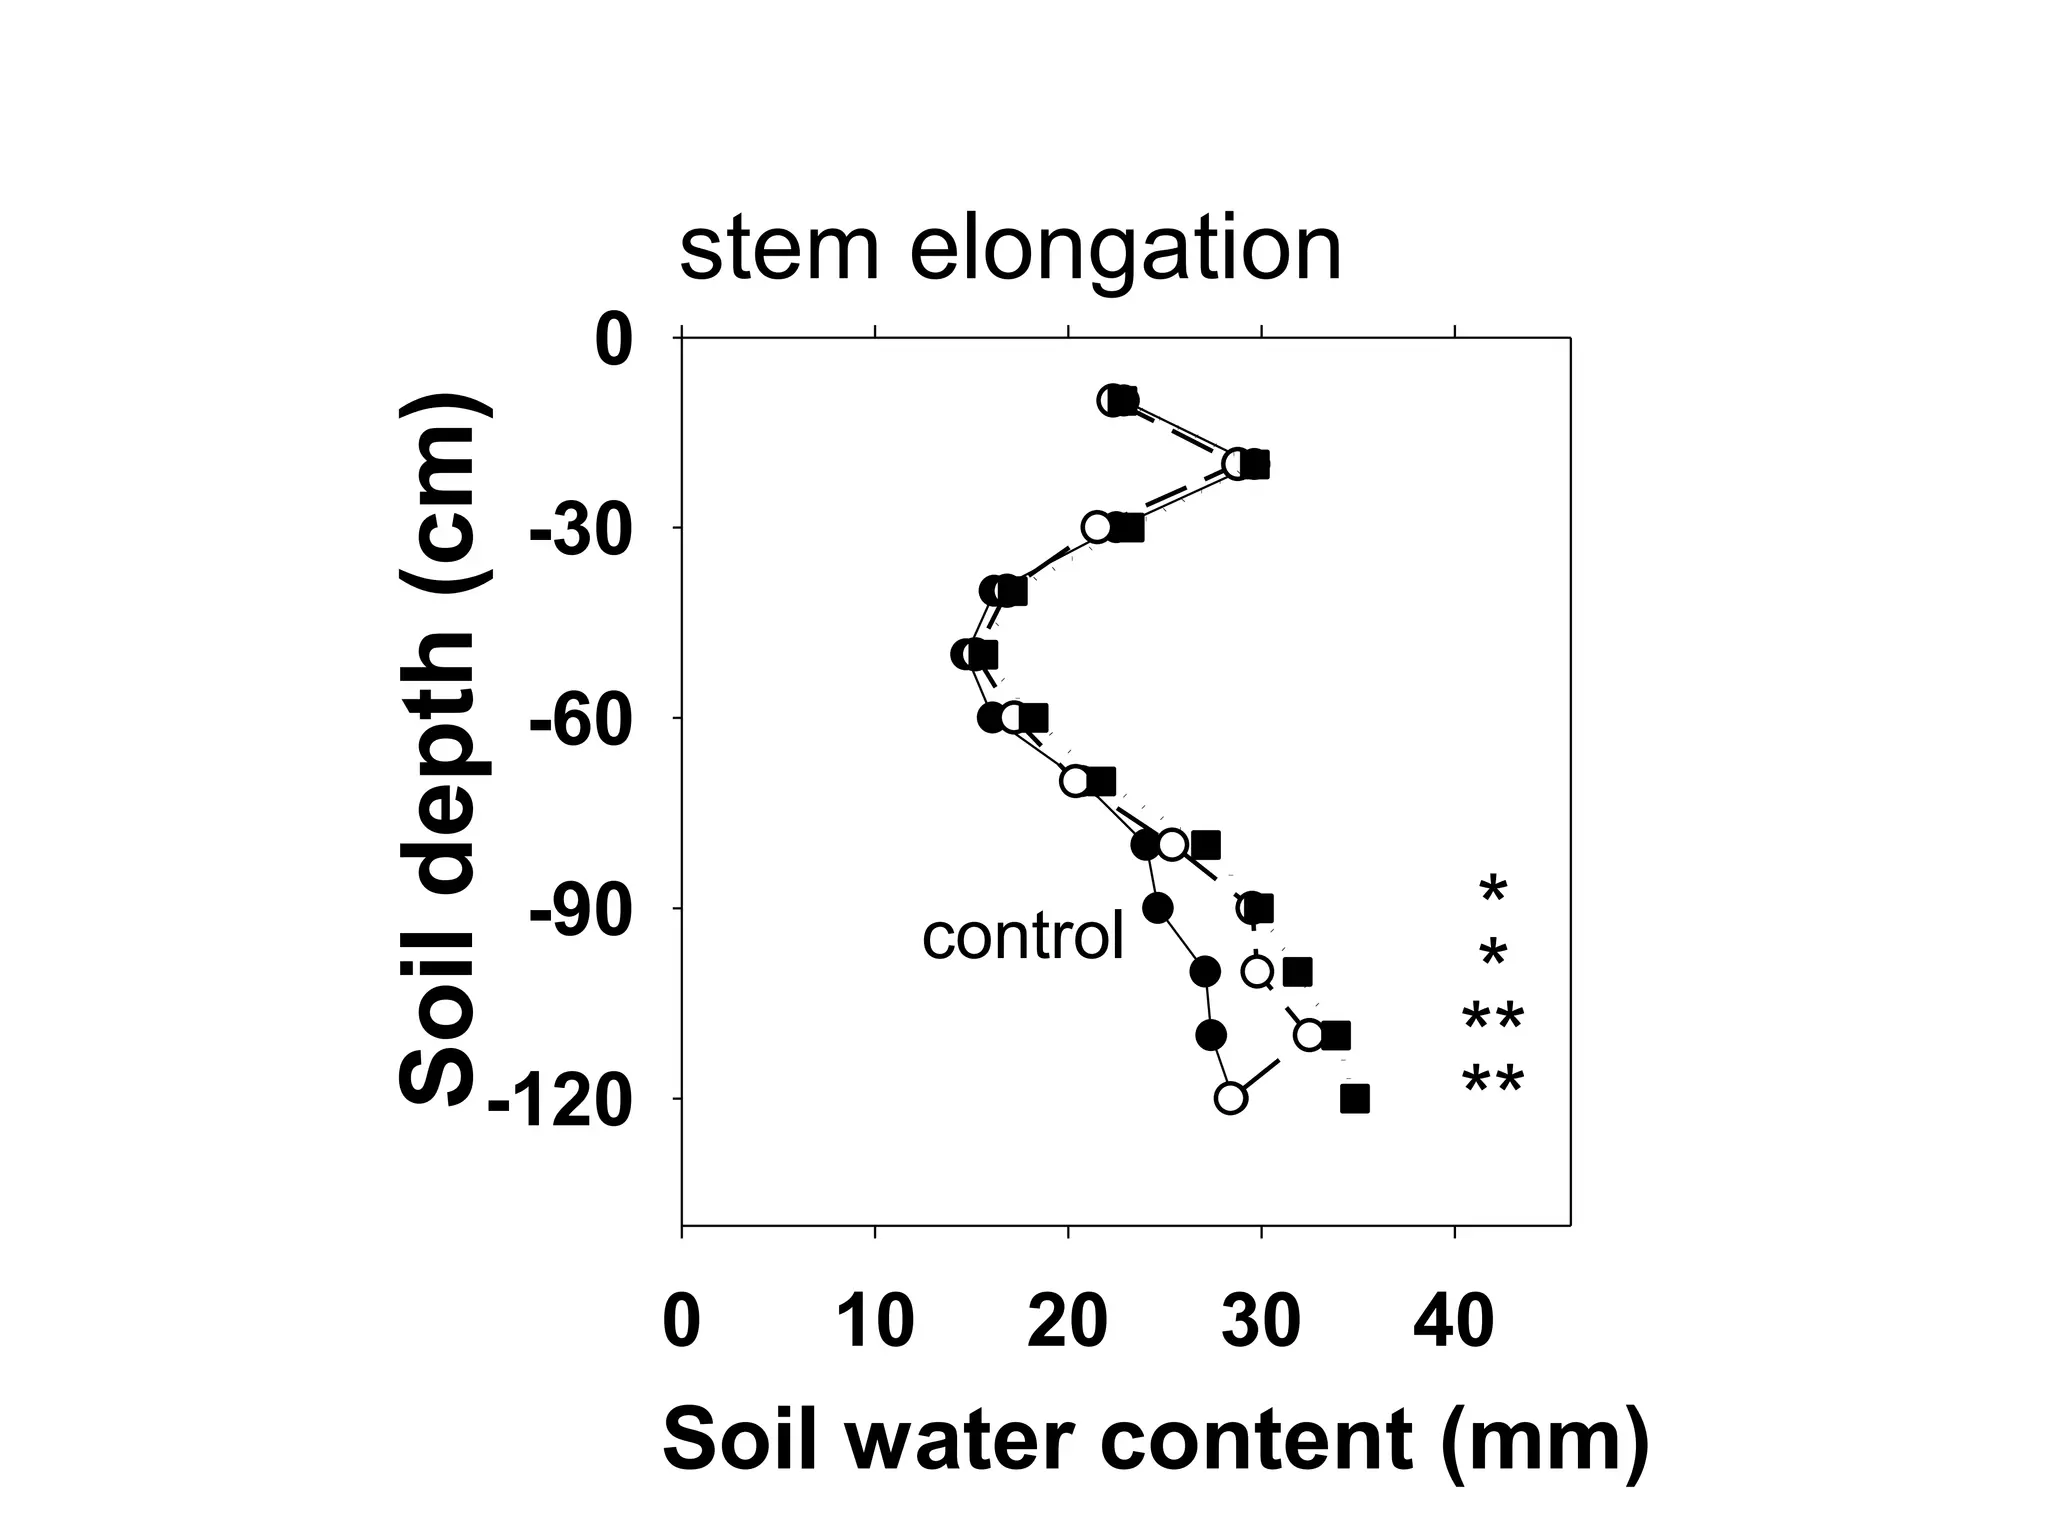
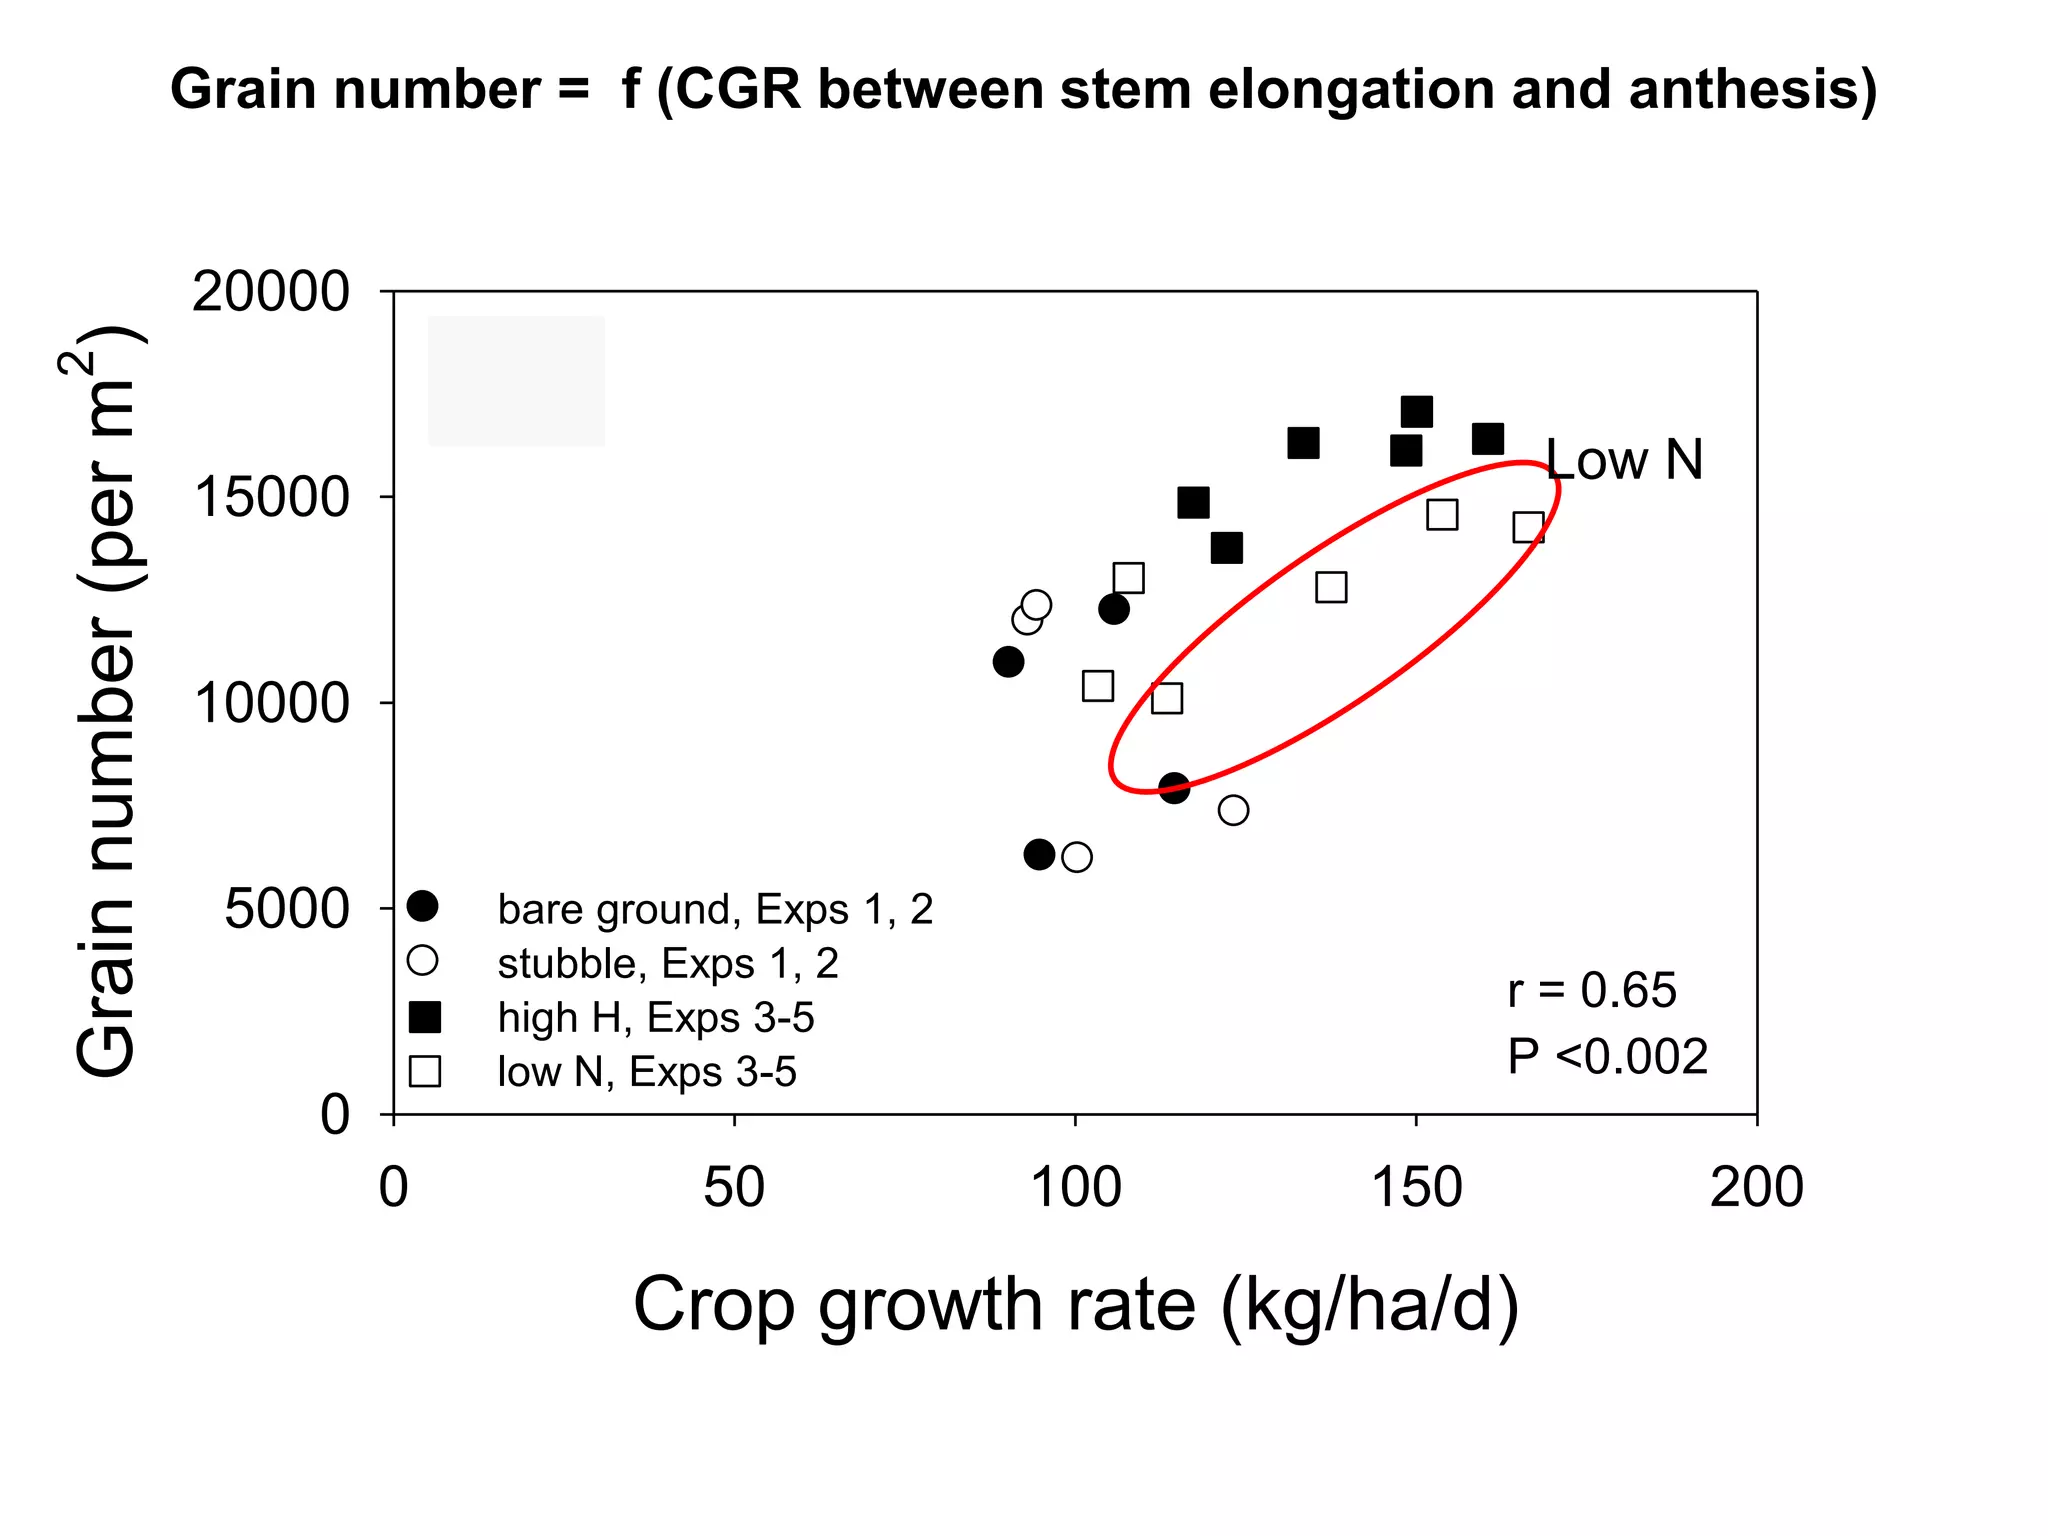
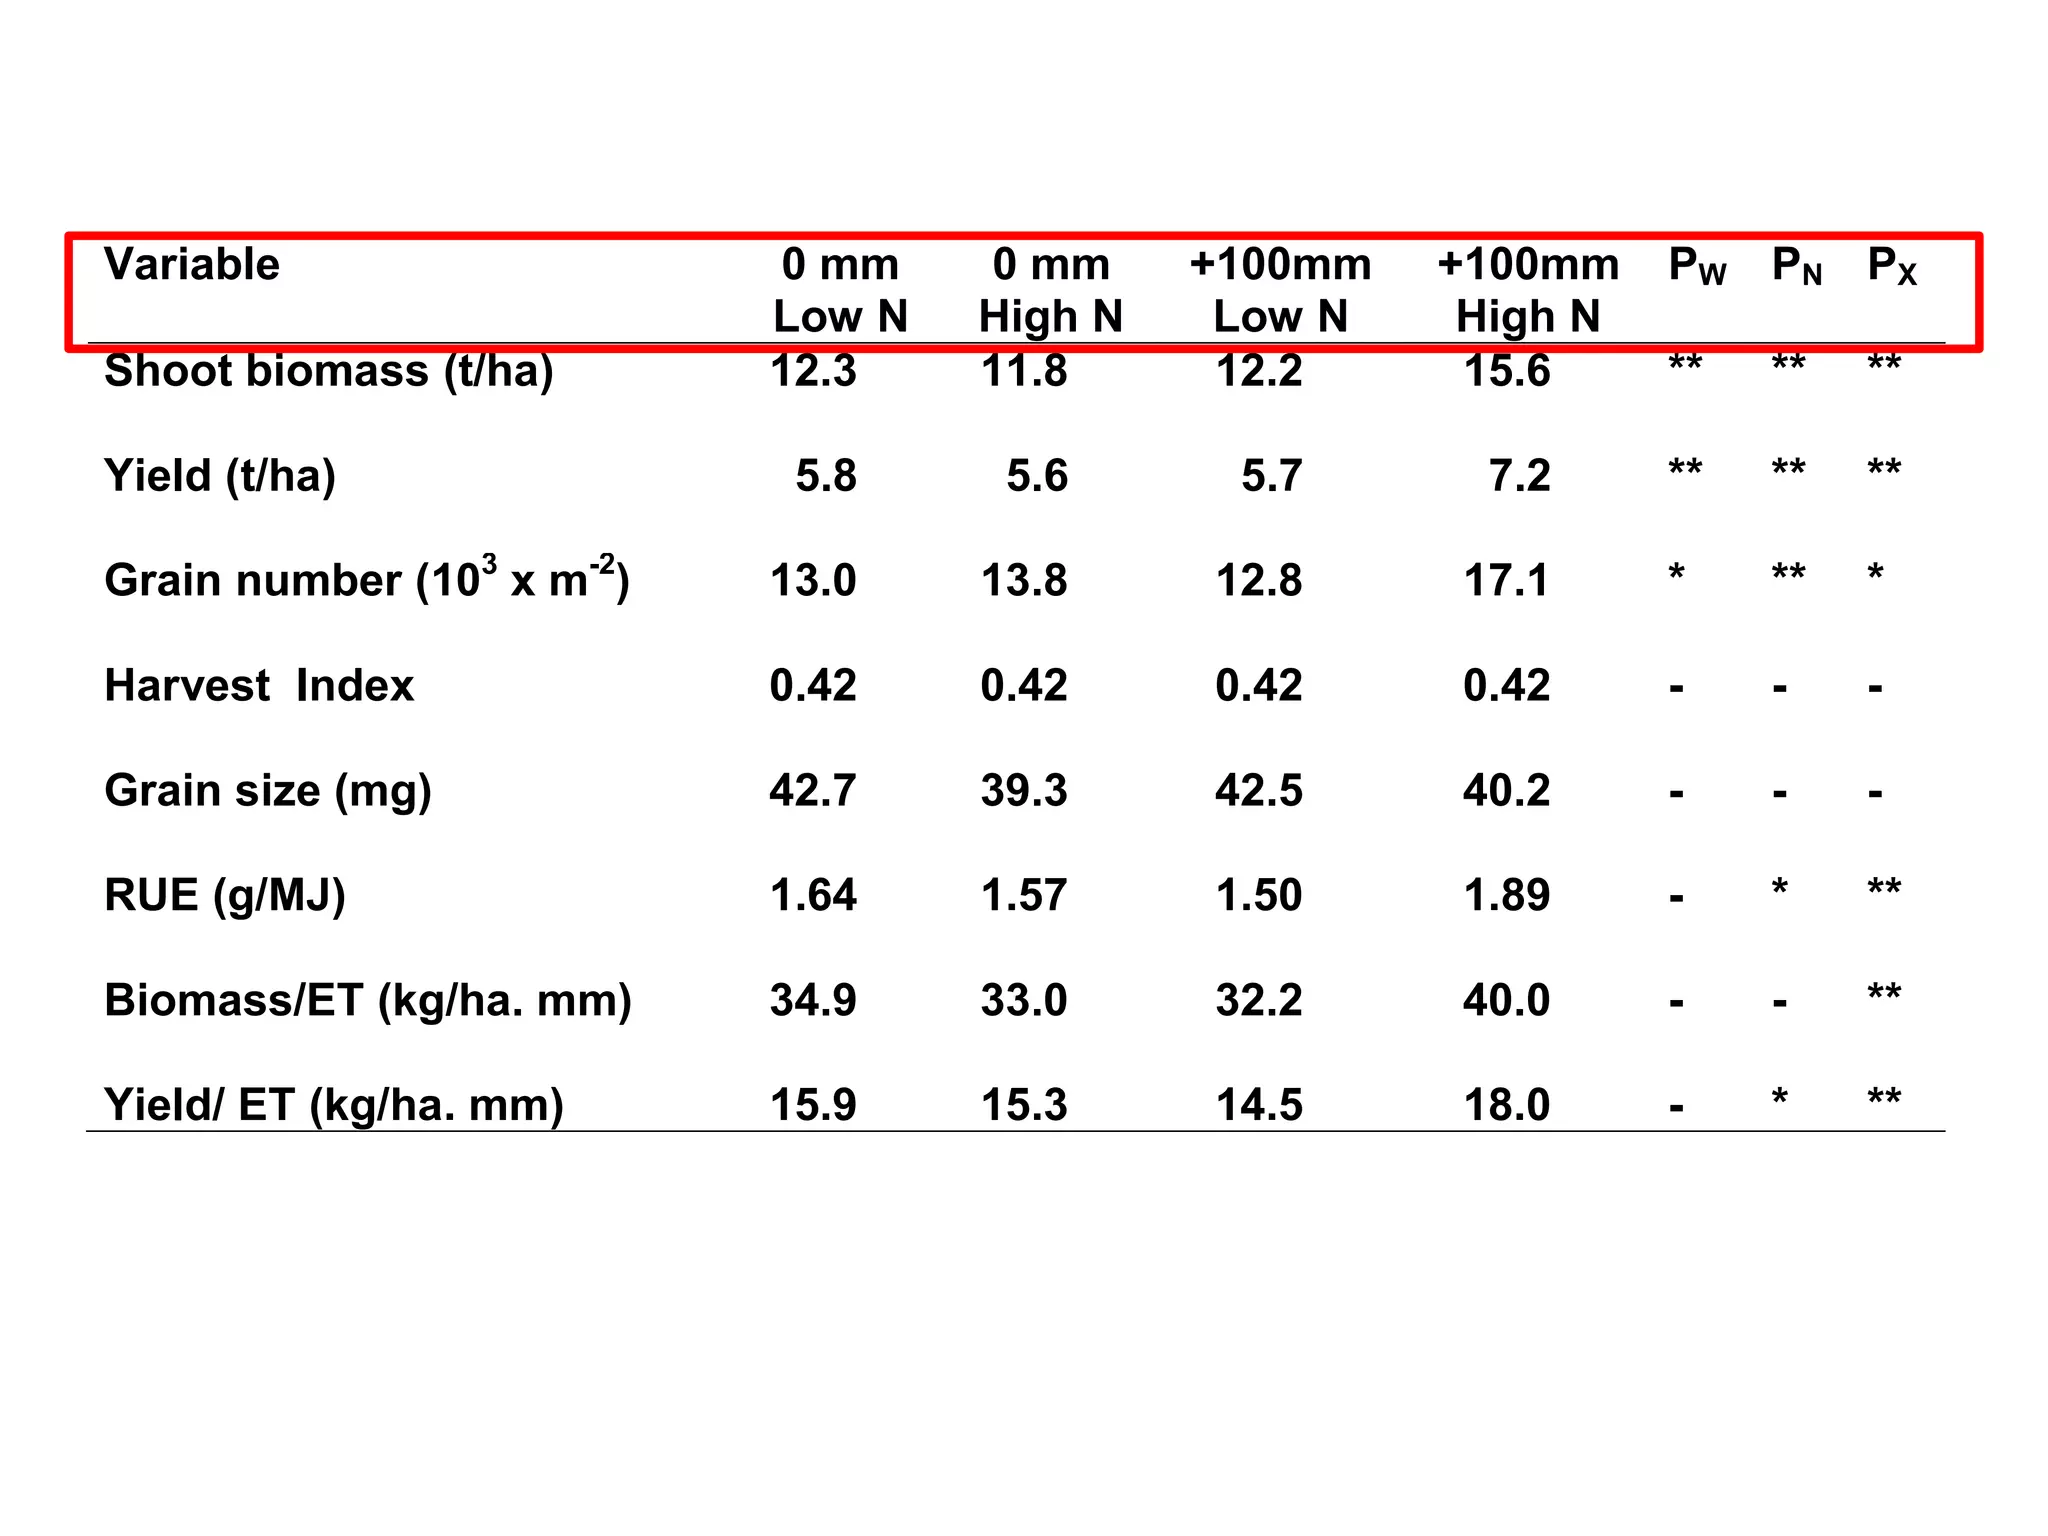
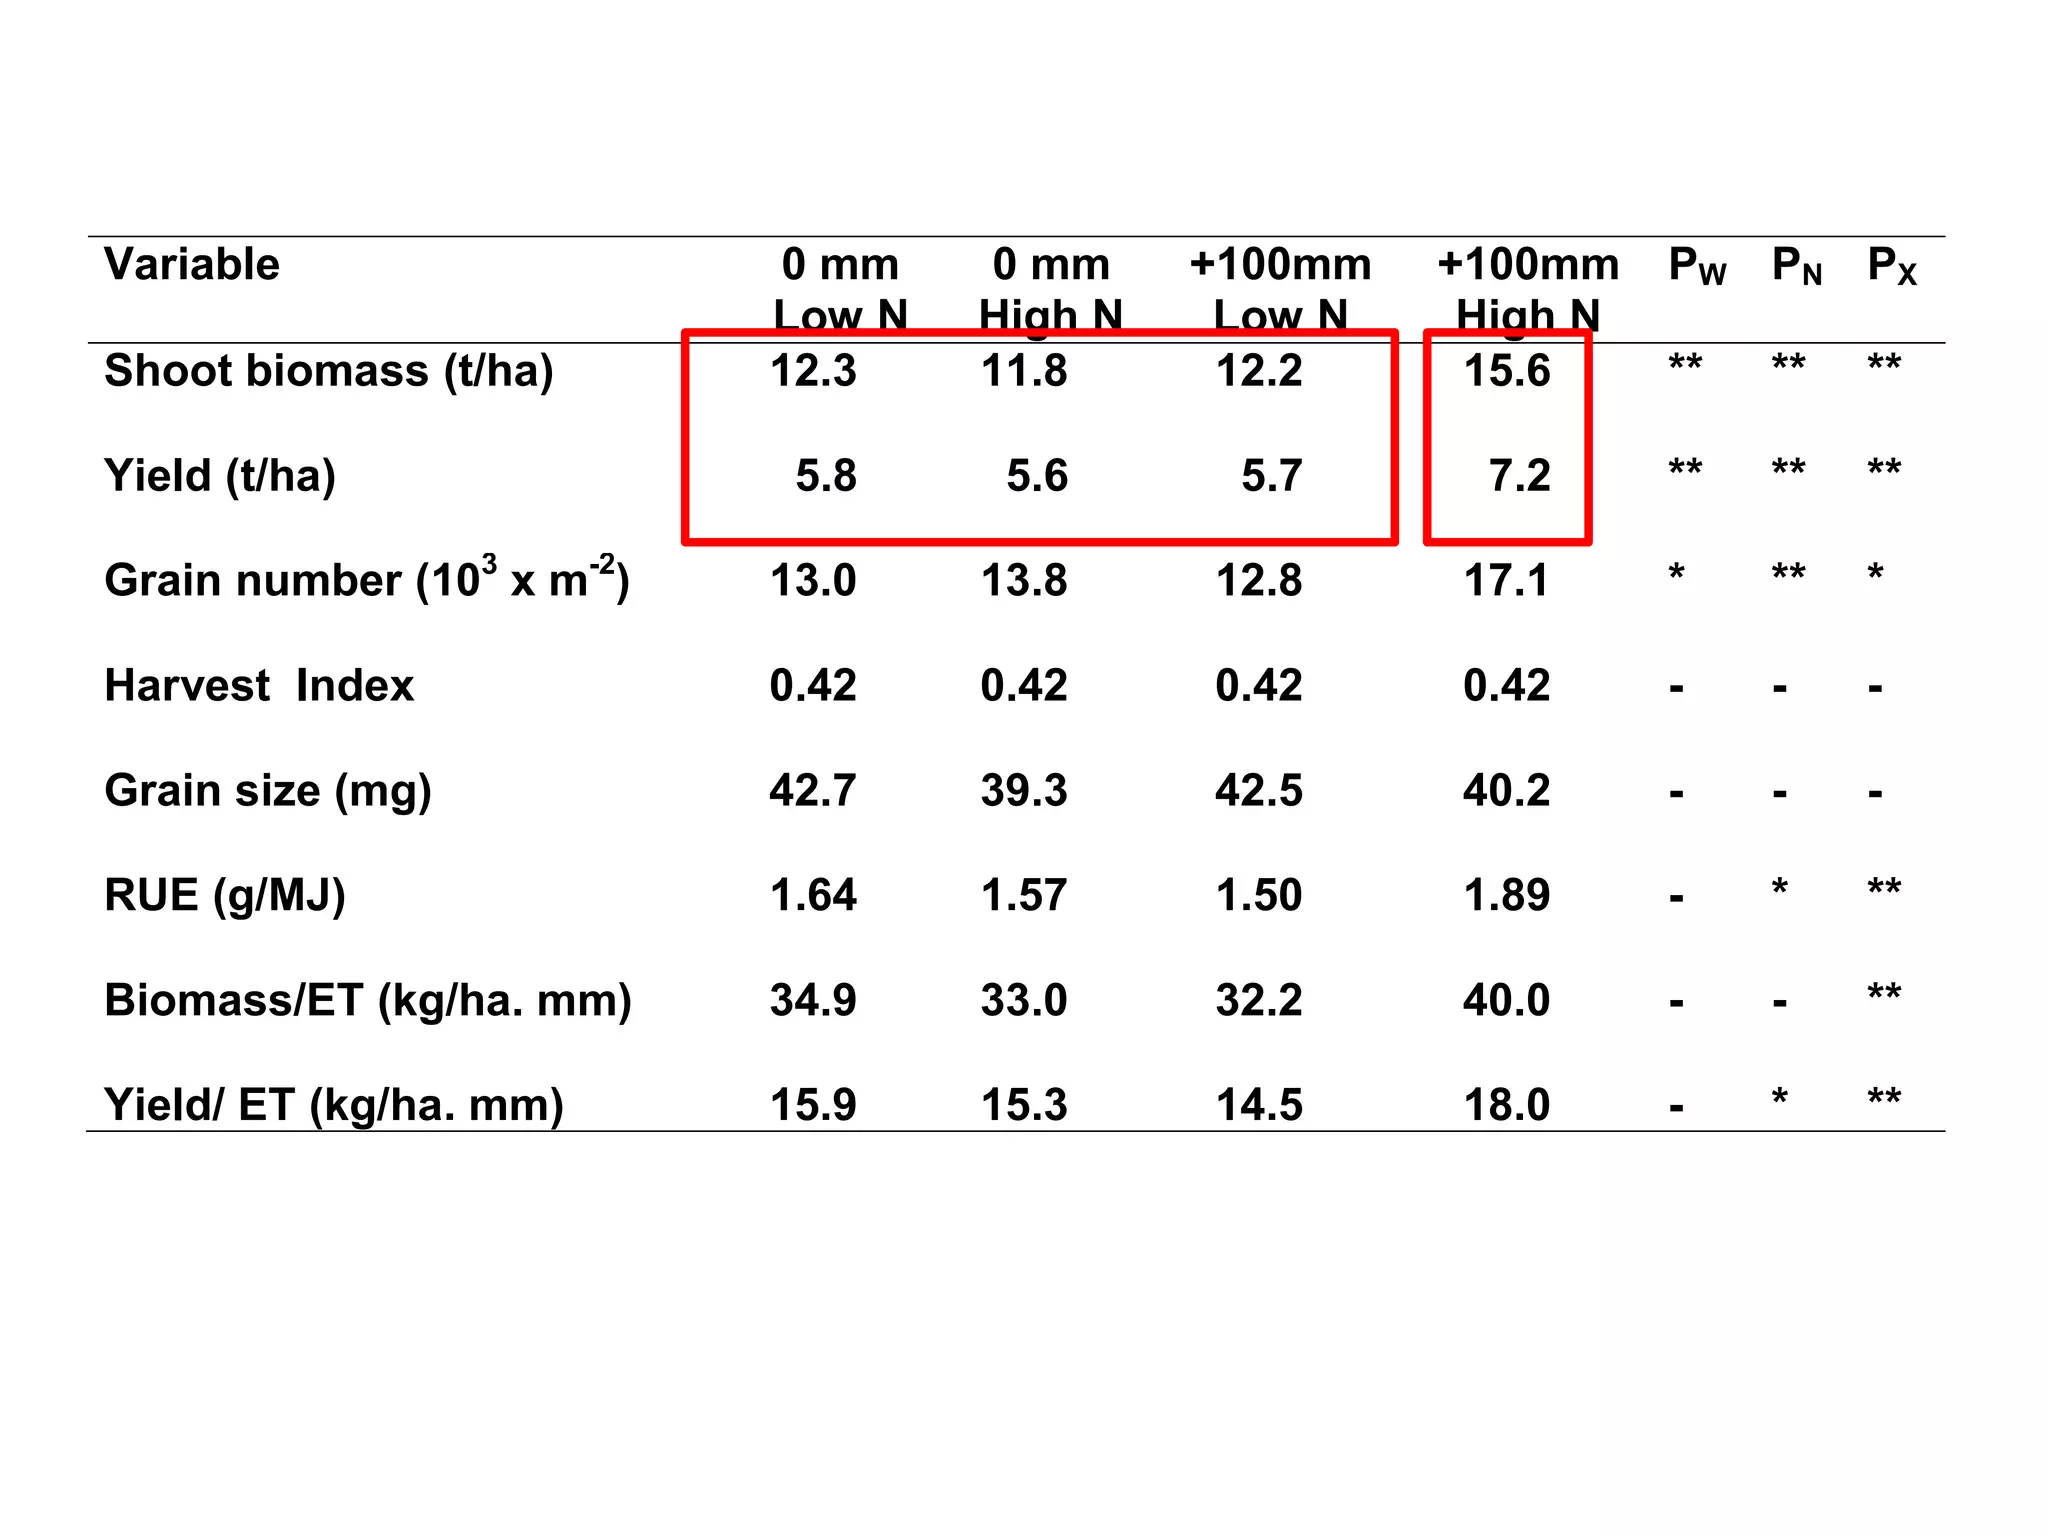
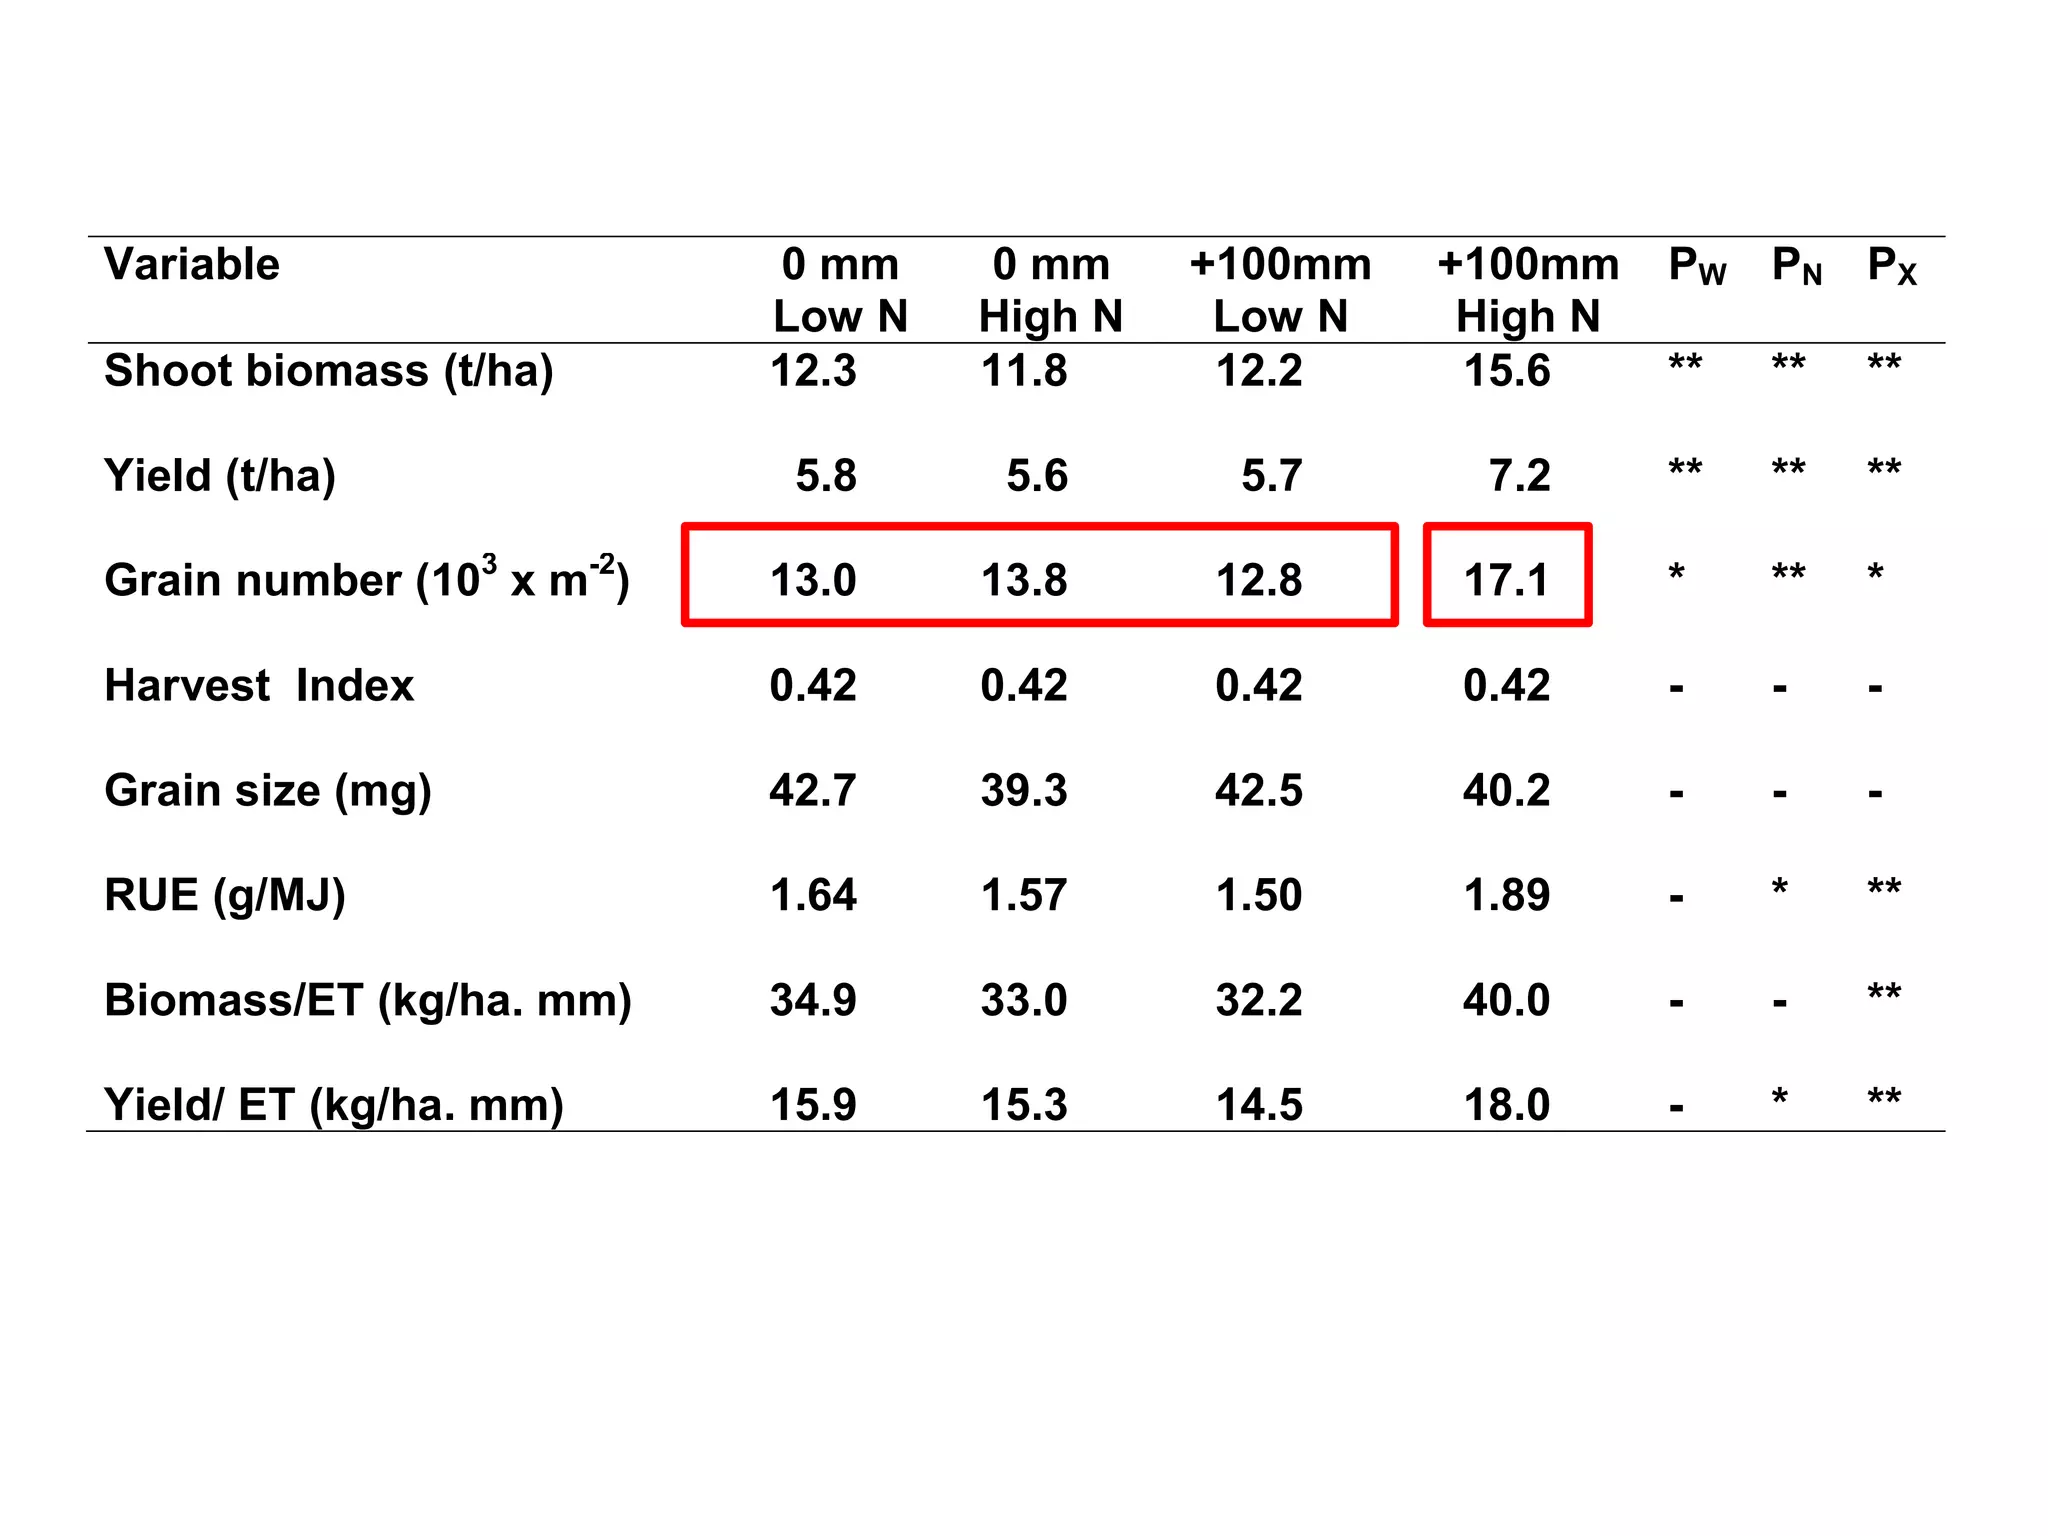
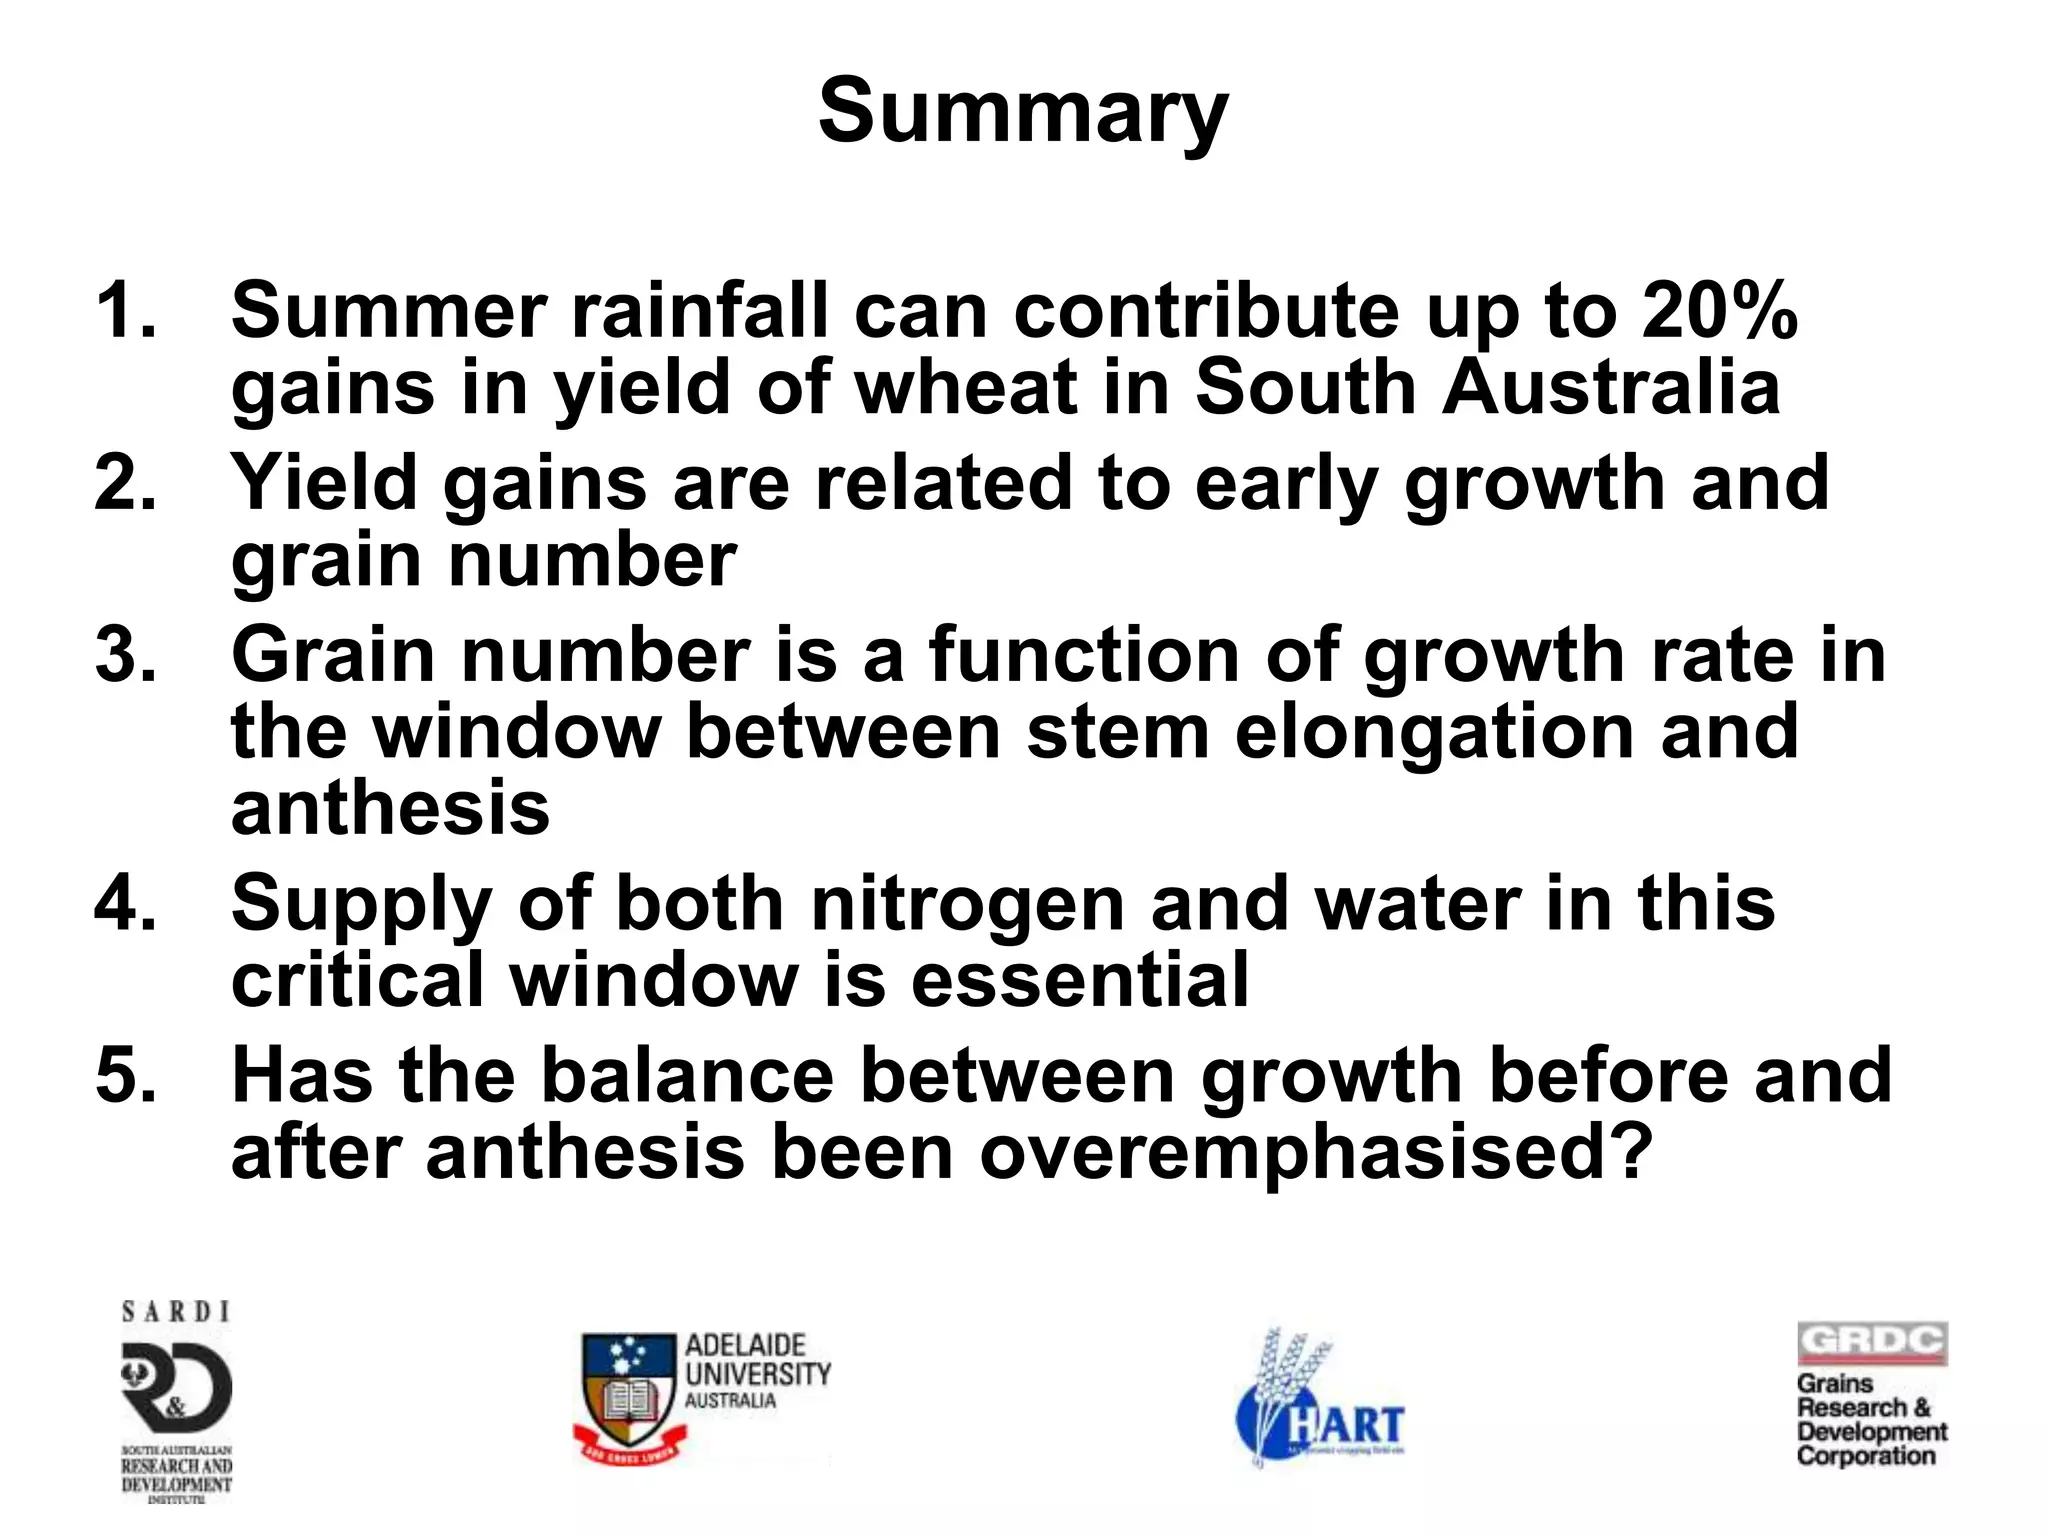
Nitrogen is essential to capture the benefit of
summer rainfall for wheat in Mediterranean
environments of South Australia


           Victor Sadras, Chris Lawson
          Peter Hooper, Glenn McDonald


South Australian Research & Development Institute
Hart Field Site, The University of Adelaide

Funded by Grains R&D Corporation
                                         Brisbane, September 2011
Climate gives rise to predictable types of ecosystems


                                    Terry Chapin
Ryan et al. (2009) Advances in Agronomy 104:53-136
Background. Rainfall patterns as drivers of
cropping systems

What is the value of summer rainfall in regions
with winter-dominant rainfall?

What are the physiological mechanisms involved
in the conversion of summer rainfall to yield?

What is the role of nitrogen to capture the benefit
of summer rainfall?
Three features of rainfall shape
cropping systems

     Amount

     Seasonality

     Size of events
Markham’s seasonality vector


Williamson (2007)
Rainfall seasonality drives initial soil water
                                                               maximum PAW = 146 mm
                       North-eastern environment                                             South-eastern environment
                       summer rainfall                                                       winter rainfall


                  50       (a) Emerald                                                  50       (b) Horsham

                  40       median = 124 mm                                              40            median = 27 mm
  Frequency (%)


                  30                                                                    30


                  20                                                                    20


                  10                                                                    10


                  0                                                                     0
                       0     20    40    60   80   100   120    140   160                    0   20    40   60   80   100   120   140   160

                                                               Plant available water at sowing (mm)


Sadras & Rodriguez (2009) Australian J Agr Res 58:657-669
power laws describe size-structure of rainfall

                          5
                                (a)
                                                                            Horsham
                                                                            Emerald
                          4                    = -3.1
   log number of events


                          3


                          2
                                      = -1.9


                          1


                          0
                              0.0      0.5        1.0         1.5     2.0         2.5
                                                  log size of event
                                                                                        low
Sadras -1.6
       & Rodriguez (2007) Australian J Agr Res 58:657
Size of rainfall events
   Influence fate of water – evaporation, run-off, drainage
                                     20
                                                                            (a)


                 Runoff (mm)
                                     15

                                     10

                                      5

                                      0
                                       150    200   250    300      350        400
                                               Seasonal rainfall (mm)

                                     12
                                                                         (b)
                    Residuals (mm)


                                      8
                                                                  P < 0.0001
                                      4

                                      0

                                      -4
                                        2.8    3     3.2    3.4       3.6         3.8


Sadras (2003) Australian J Agr Res 54:341-351
Winter half year


Williamson (2007)
SE Australia vs. Syria

                       5
                             (a)
                                                                     Horsham
                       4                    = -3.1                   Tel Hadya
log number of events


                       3
                                            = -3.0
                       2


                       1


                       0
                           0.0        0.5             1.0           1.5          2.0
                                                log size of event
Ryan et al. (2009) Advances in Agronomy 104:53-136
Climate of SE Australia shares important
features with those of the Mediterranean Basin

Australian wheat-based cropping systems match
the systems that evolved over centuries in the
Mediterranean basin

Australian wheat-based cropping systems are
not ill-adapted European transplants
Background. Rainfall patterns as drivers of
cropping systems

What is the value of summer rainfall in regions
with winter-dominant rainfall?

What are the physiological mechanisms involved
in the conversion of summer rainfall to yield?

What is the role of nitrogen to capture the benefit
of summer rainfall?
Yield benefit from summer rainfall?
 Five trials @ Roseworthy, Hart, Spalding
 Seasons: 2009 and 2010

 controls (background rain) vs “summer rainfall” (+50 or 100 mm)


Sadras et al (2011) European Journal of Agronomy, in press
Benefit from 20% for controls ~2 t/ha
                              to 0 for controls ~6 t/ha

                                                       measured                                   modelled
Yield of crops with additional
 summer water supply (t/ha)


                                 8
                                         slope = 0.81 ± 0.097                         slope = 0.75 ± 0.070
                                         intercept = 1.4 ± 0.46                       intercept = 1.7 ± 0.30
                                 6


                                 4


                                 2
                                            y=x                                        y=x
                                 0
                                     0             2              4      6       80          2             4   6   8

                                                                      Yield of controls (t/ha)
Background. Rainfall patterns as drivers of
cropping systems

What is the value of summer rainfall in regions
with winter-dominant rainfall?

What are the physiological mechanisms involved
in the conversion of summer rainfall to yield?

What is the role of nitrogen to capture the benefit
of summer rainfall?
8000
                                      control
                                                                            ***
Shoot dry matter (kg/ha)


                                      +50 mm
                                      +100 mm
                                                              **
                           6000


                           4000

                                                  ***
                           2000

                                                   GS 32      GS 65         GS 95

                              0
                                  0      50             100           150   200

                                                Days after sowing
Cumulative               PAR interception (%)
                              evapotranspiration (mm)


                          0
                                  100
                                          200
                                                  300
                                                        0
                                                            20
                                                                  40
                                                                       60
                                                                             80
                                                                                   100


                    0
                    50
                    100
Days after sowing
                    150
                    200
5 d after irrigation
                    0
                                             ***
Soil depth (cm)
                                             ***
                   -30                       ***
                                              *
                                              *
                   -60                       **
                                             **
                                              *
                   -90       control          *
                             +50 mm           *
                             +100 mm         ***
                  -120                       ***

                         0   10    20   30   40

                     Soil water content (mm)
sowing
                    0
Soil depth (cm)
                   -30
                             control
                   -60                                 *
                                            +100mm
                                                       *
                   -90                                **
                                                      **
                                                      **
                  -120                                **

                         0       10    20    30      40
                         Soil water content (mm)
stem elongation
                   0
Soil depth (cm)
                  -30

                  -60

                  -90            control          *
                                                  *
                                                 **
             -120                                **

                        0   10      20     30   40
                        Soil water content (mm)
flowering
                    0

Soil depth (cm)    -30

                   -60

                   -90
                                              *
                  -120                       **

                         0   10   20   30   40
                         Soil water content (mm)
maturity
                    0

Soil depth (cm)    -30
                                               *

                   -60

                   -90
                                               *
                  -120                         *

                         0   10     20   30   40
                     Soil water content (mm)
Residual water at maturity in N-deficient crops
                                    Roseworthy, 2010

                          0
                                   maturity
      Soil depth (cm)
                         -20
                         -40
                                                       low N
                         -60
                                              high N
                         -80
                        -100

                               0         5        10     15
                           Soil water content (mm)
Grain number accounted for 88% of the variation in yield


                8000


                6000
Yield (kg/ha)


                4000


                2000       bare ground, Exps 1, 2
                           stubble, Exps 1, 2
                           high H, Exps 3-5                       r = 0.94
                           low N, Exps 3-5                        P <0.0001
                   0
                       0           5000             10000   15000        20000
                                                              2
                                     Grain number (per m )
Grain number =          Grain number (per m2) and anthesis)
                                            f (CGR between stem elongation


                        20000
                                                                                            (c)
Grain number (per m )


                                    (b)
2


                                                                                            P < 0.
                                                                            Low N
                        15000


                        10000


                         5000         bare ground, Exps 1, 2
                                      stubble, Exps 1, 2
                                      high H, Exps 3-5
                                                                           r = 0.65
                                      low N, Exps 3-5                      P <0.002
                            0
                                0               50             100   150              200      low

                                            Crop growth rate (kg/ha/d)                      Nitrog
Variable                   0 mm    0 mm     +100mm   +100mm    P W PN P X
                           Low N   High N    Low N    High N
Shoot biomass (t/ha)       12.3    11.8      12.2     15.6     **   **   **

Yield (t/ha)                5.8     5.6      5.7      7.2      **   **   **

Grain number (103 x m-2)   13.0    13.8     12.8     17.1      *    **   *

Harvest Index              0.42    0.42     0.42     0.42      -    -    -

Grain size (mg)            42.7    39.3     42.5     40.2      -    -    -

RUE (g/MJ)                 1.64    1.57     1.50     1.89      -    *    **

Biomass/ET (kg/ha. mm)     34.9    33.0     32.2     40.0      -    -    **

Yield/ ET (kg/ha. mm)      15.9    15.3     14.5     18.0      -    *    **
N-driven trade-off between WUE and NUE


                                                                    Nitrogen utilisation efficiency
                                                               40
   Water use efficiency


                          20
                                   NUE


                                                                           (kg grain/kgN)
                                                               30
       (kg/ha mm)


                          15

                          10                                   20

                           5                                   10
                                         WUE
                           0                                    0
                               0          100    200         300

                                   Nitrogen rate (kg N/ha)

Sadras & Rodriguez (2010) Field Crops Research 118, 297–305.
Summary

1. Summer rainfall can contribute up to 20%
   gains in yield of wheat in South Australia
2. Yield gains are related to early growth and
   grain number
3. Grain number is a function of growth rate in
   the window between stem elongation and
   anthesis
4. Supply of both nitrogen and water in this
   critical window is essential
5. Has the balance between growth before and
   after anthesis been overemphasised?
The trade-off is universal –
    applies to maize in USA corn-belt


                                                        Nitrogen utilisation efficiency
                       30                          80
Water use efficiency


                                             WUE


                                                             (kg grain per kg N)
    (kg/ha/mm)


                                                   70
                       25
                                                   60
                       20                    NUE
                                                   50

                       15                          40
                             0    50   100   150

                            Nitrogen rate (kg N/ha)
The trade-off is universal –
     applies to rice in Philippines


                                                                    Nitrogen utilisation efficiency
                                                               65
Water use efficiency


                       6
                                                 WUE


                                                                           (kg grain/kg N)
    (kg/ha/mm)


                                                               60
                       4


                                                               55
                       2
                                                   NUE
                       0                                       50
                           0                             150
                               Nitrogen rate (kg N/ha)

Nitrogen is essential to capture the benefit of summer rainfall for wheat in mediterranean environments of South Australia. Victor Sadras

  • 1.
    Nitrogen is essentialto capture the benefit of summer rainfall for wheat in Mediterranean environments of South Australia Victor Sadras, Chris Lawson Peter Hooper, Glenn McDonald South Australian Research & Development Institute Hart Field Site, The University of Adelaide Funded by Grains R&D Corporation Brisbane, September 2011
  • 2.
    Climate gives riseto predictable types of ecosystems Terry Chapin
  • 3.
    Ryan et al.(2009) Advances in Agronomy 104:53-136
  • 4.
    Background. Rainfall patternsas drivers of cropping systems What is the value of summer rainfall in regions with winter-dominant rainfall? What are the physiological mechanisms involved in the conversion of summer rainfall to yield? What is the role of nitrogen to capture the benefit of summer rainfall?
  • 5.
    Three features ofrainfall shape cropping systems Amount Seasonality Size of events
  • 7.
  • 8.
    Rainfall seasonality drivesinitial soil water maximum PAW = 146 mm North-eastern environment South-eastern environment summer rainfall winter rainfall 50 (a) Emerald 50 (b) Horsham 40 median = 124 mm 40 median = 27 mm Frequency (%) 30 30 20 20 10 10 0 0 0 20 40 60 80 100 120 140 160 0 20 40 60 80 100 120 140 160 Plant available water at sowing (mm) Sadras & Rodriguez (2009) Australian J Agr Res 58:657-669
  • 9.
    power laws describesize-structure of rainfall 5 (a) Horsham Emerald 4 = -3.1 log number of events 3 2 = -1.9 1 0 0.0 0.5 1.0 1.5 2.0 2.5 log size of event low Sadras -1.6 & Rodriguez (2007) Australian J Agr Res 58:657
  • 10.
    Size of rainfallevents Influence fate of water – evaporation, run-off, drainage 20 (a) Runoff (mm) 15 10 5 0 150 200 250 300 350 400 Seasonal rainfall (mm) 12 (b) Residuals (mm) 8 P < 0.0001 4 0 -4 2.8 3 3.2 3.4 3.6 3.8 Sadras (2003) Australian J Agr Res 54:341-351
  • 11.
  • 12.
    SE Australia vs.Syria 5 (a) Horsham 4 = -3.1 Tel Hadya log number of events 3 = -3.0 2 1 0 0.0 0.5 1.0 1.5 2.0 log size of event
  • 13.
    Ryan et al.(2009) Advances in Agronomy 104:53-136
  • 14.
    Climate of SEAustralia shares important features with those of the Mediterranean Basin Australian wheat-based cropping systems match the systems that evolved over centuries in the Mediterranean basin Australian wheat-based cropping systems are not ill-adapted European transplants
  • 15.
    Background. Rainfall patternsas drivers of cropping systems What is the value of summer rainfall in regions with winter-dominant rainfall? What are the physiological mechanisms involved in the conversion of summer rainfall to yield? What is the role of nitrogen to capture the benefit of summer rainfall?
  • 16.
    Yield benefit fromsummer rainfall? Five trials @ Roseworthy, Hart, Spalding Seasons: 2009 and 2010 controls (background rain) vs “summer rainfall” (+50 or 100 mm) Sadras et al (2011) European Journal of Agronomy, in press
  • 17.
    Benefit from 20%for controls ~2 t/ha to 0 for controls ~6 t/ha measured modelled Yield of crops with additional summer water supply (t/ha) 8 slope = 0.81 ± 0.097 slope = 0.75 ± 0.070 intercept = 1.4 ± 0.46 intercept = 1.7 ± 0.30 6 4 2 y=x y=x 0 0 2 4 6 80 2 4 6 8 Yield of controls (t/ha)
  • 18.
    Background. Rainfall patternsas drivers of cropping systems What is the value of summer rainfall in regions with winter-dominant rainfall? What are the physiological mechanisms involved in the conversion of summer rainfall to yield? What is the role of nitrogen to capture the benefit of summer rainfall?
  • 19.
    8000 control *** Shoot dry matter (kg/ha) +50 mm +100 mm ** 6000 4000 *** 2000 GS 32 GS 65 GS 95 0 0 50 100 150 200 Days after sowing
  • 20.
    Cumulative PAR interception (%) evapotranspiration (mm) 0 100 200 300 0 20 40 60 80 100 0 50 100 Days after sowing 150 200
  • 21.
    5 d afterirrigation 0 *** Soil depth (cm) *** -30 *** * * -60 ** ** * -90 control * +50 mm * +100 mm *** -120 *** 0 10 20 30 40 Soil water content (mm)
  • 22.
    sowing 0 Soil depth (cm) -30 control -60 * +100mm * -90 ** ** ** -120 ** 0 10 20 30 40 Soil water content (mm)
  • 23.
    stem elongation 0 Soil depth (cm) -30 -60 -90 control * * ** -120 ** 0 10 20 30 40 Soil water content (mm)
  • 24.
    flowering 0 Soil depth (cm) -30 -60 -90 * -120 ** 0 10 20 30 40 Soil water content (mm)
  • 25.
    maturity 0 Soil depth (cm) -30 * -60 -90 * -120 * 0 10 20 30 40 Soil water content (mm)
  • 26.
    Residual water atmaturity in N-deficient crops Roseworthy, 2010 0 maturity Soil depth (cm) -20 -40 low N -60 high N -80 -100 0 5 10 15 Soil water content (mm)
  • 27.
    Grain number accountedfor 88% of the variation in yield 8000 6000 Yield (kg/ha) 4000 2000 bare ground, Exps 1, 2 stubble, Exps 1, 2 high H, Exps 3-5 r = 0.94 low N, Exps 3-5 P <0.0001 0 0 5000 10000 15000 20000 2 Grain number (per m )
  • 28.
    Grain number = Grain number (per m2) and anthesis) f (CGR between stem elongation 20000 (c) Grain number (per m ) (b) 2 P < 0. Low N 15000 10000 5000 bare ground, Exps 1, 2 stubble, Exps 1, 2 high H, Exps 3-5 r = 0.65 low N, Exps 3-5 P <0.002 0 0 50 100 150 200 low Crop growth rate (kg/ha/d) Nitrog
  • 29.
    Variable 0 mm 0 mm +100mm +100mm P W PN P X Low N High N Low N High N Shoot biomass (t/ha) 12.3 11.8 12.2 15.6 ** ** ** Yield (t/ha) 5.8 5.6 5.7 7.2 ** ** ** Grain number (103 x m-2) 13.0 13.8 12.8 17.1 * ** * Harvest Index 0.42 0.42 0.42 0.42 - - - Grain size (mg) 42.7 39.3 42.5 40.2 - - - RUE (g/MJ) 1.64 1.57 1.50 1.89 - * ** Biomass/ET (kg/ha. mm) 34.9 33.0 32.2 40.0 - - ** Yield/ ET (kg/ha. mm) 15.9 15.3 14.5 18.0 - * **
  • 30.
    Variable 0 mm 0 mm +100mm +100mm P W PN P X Low N High N Low N High N Shoot biomass (t/ha) 12.3 11.8 12.2 15.6 ** ** ** Yield (t/ha) 5.8 5.6 5.7 7.2 ** ** ** Grain number (103 x m-2) 13.0 13.8 12.8 17.1 * ** * Harvest Index 0.42 0.42 0.42 0.42 - - - Grain size (mg) 42.7 39.3 42.5 40.2 - - - RUE (g/MJ) 1.64 1.57 1.50 1.89 - * ** Biomass/ET (kg/ha. mm) 34.9 33.0 32.2 40.0 - - ** Yield/ ET (kg/ha. mm) 15.9 15.3 14.5 18.0 - * **
  • 31.
    Variable 0 mm 0 mm +100mm +100mm P W PN P X Low N High N Low N High N Shoot biomass (t/ha) 12.3 11.8 12.2 15.6 ** ** ** Yield (t/ha) 5.8 5.6 5.7 7.2 ** ** ** Grain number (103 x m-2) 13.0 13.8 12.8 17.1 * ** * Harvest Index 0.42 0.42 0.42 0.42 - - - Grain size (mg) 42.7 39.3 42.5 40.2 - - - RUE (g/MJ) 1.64 1.57 1.50 1.89 - * ** Biomass/ET (kg/ha. mm) 34.9 33.0 32.2 40.0 - - ** Yield/ ET (kg/ha. mm) 15.9 15.3 14.5 18.0 - * **
  • 32.
    Variable 0 mm 0 mm +100mm +100mm P W PN P X Low N High N Low N High N Shoot biomass (t/ha) 12.3 11.8 12.2 15.6 ** ** ** Yield (t/ha) 5.8 5.6 5.7 7.2 ** ** ** Grain number (103 x m-2) 13.0 13.8 12.8 17.1 * ** * Harvest Index 0.42 0.42 0.42 0.42 - - - Grain size (mg) 42.7 39.3 42.5 40.2 - - - RUE (g/MJ) 1.64 1.57 1.50 1.89 - * ** Biomass/ET (kg/ha. mm) 34.9 33.0 32.2 40.0 - - ** Yield/ ET (kg/ha. mm) 15.9 15.3 14.5 18.0 - * **
  • 33.
    Variable 0 mm 0 mm +100mm +100mm P W PN P X Low N High N Low N High N Shoot biomass (t/ha) 12.3 11.8 12.2 15.6 ** ** ** Yield (t/ha) 5.8 5.6 5.7 7.2 ** ** ** Grain number (103 x m-2) 13.0 13.8 12.8 17.1 * ** * Harvest Index 0.42 0.42 0.42 0.42 - - - Grain size (mg) 42.7 39.3 42.5 40.2 - - - RUE (g/MJ) 1.64 1.57 1.50 1.89 - * ** Biomass/ET (kg/ha. mm) 34.9 33.0 32.2 40.0 - - ** Yield/ ET (kg/ha. mm) 15.9 15.3 14.5 18.0 - * **
  • 34.
    N-driven trade-off betweenWUE and NUE Nitrogen utilisation efficiency 40 Water use efficiency 20 NUE (kg grain/kgN) 30 (kg/ha mm) 15 10 20 5 10 WUE 0 0 0 100 200 300 Nitrogen rate (kg N/ha) Sadras & Rodriguez (2010) Field Crops Research 118, 297–305.
  • 35.
    Summary 1. Summer rainfallcan contribute up to 20% gains in yield of wheat in South Australia 2. Yield gains are related to early growth and grain number 3. Grain number is a function of growth rate in the window between stem elongation and anthesis 4. Supply of both nitrogen and water in this critical window is essential 5. Has the balance between growth before and after anthesis been overemphasised?
  • 37.
    The trade-off isuniversal – applies to maize in USA corn-belt Nitrogen utilisation efficiency 30 80 Water use efficiency WUE (kg grain per kg N) (kg/ha/mm) 70 25 60 20 NUE 50 15 40 0 50 100 150 Nitrogen rate (kg N/ha)
  • 38.
    The trade-off isuniversal – applies to rice in Philippines Nitrogen utilisation efficiency 65 Water use efficiency 6 WUE (kg grain/kg N) (kg/ha/mm) 60 4 55 2 NUE 0 50 0 150 Nitrogen rate (kg N/ha)